Tento príspevok bol pôvodne publikovaný na stránke https://cointelegraph.com/news/top-5-cryptocurrencies-to-watch-this-week-btc-mana-mkr-zec-kcs a autorom článku je Cointelegraph By Rakesh Upadhyay. Tento článok je iba kópia originálneho článku.
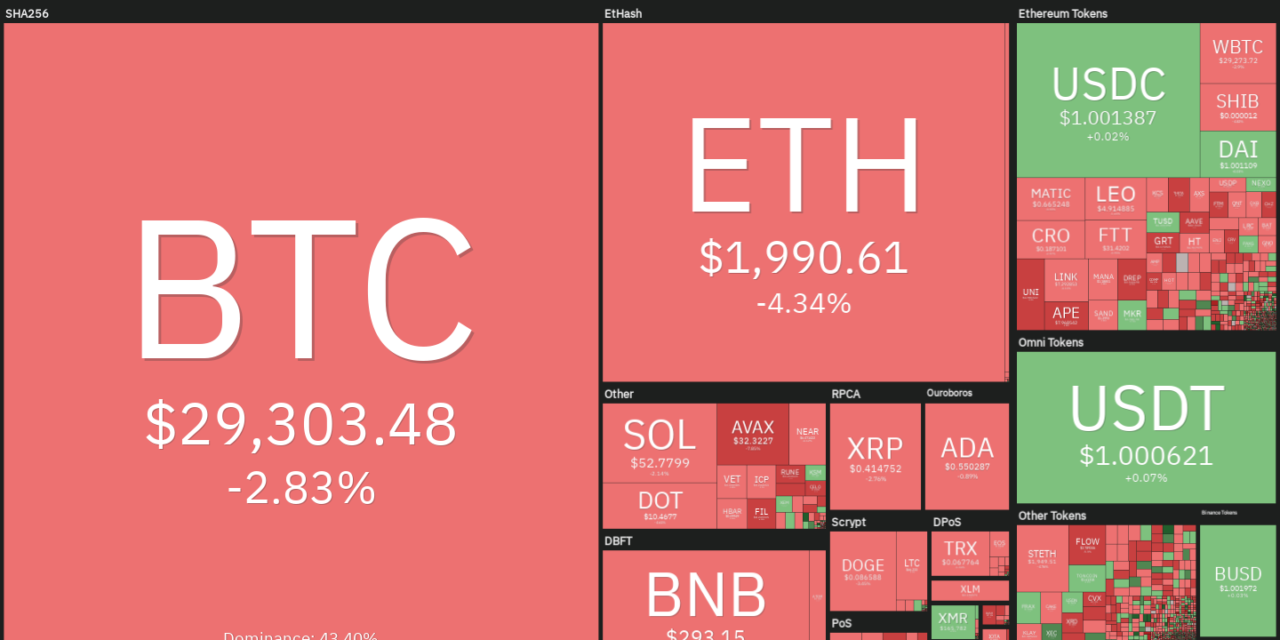
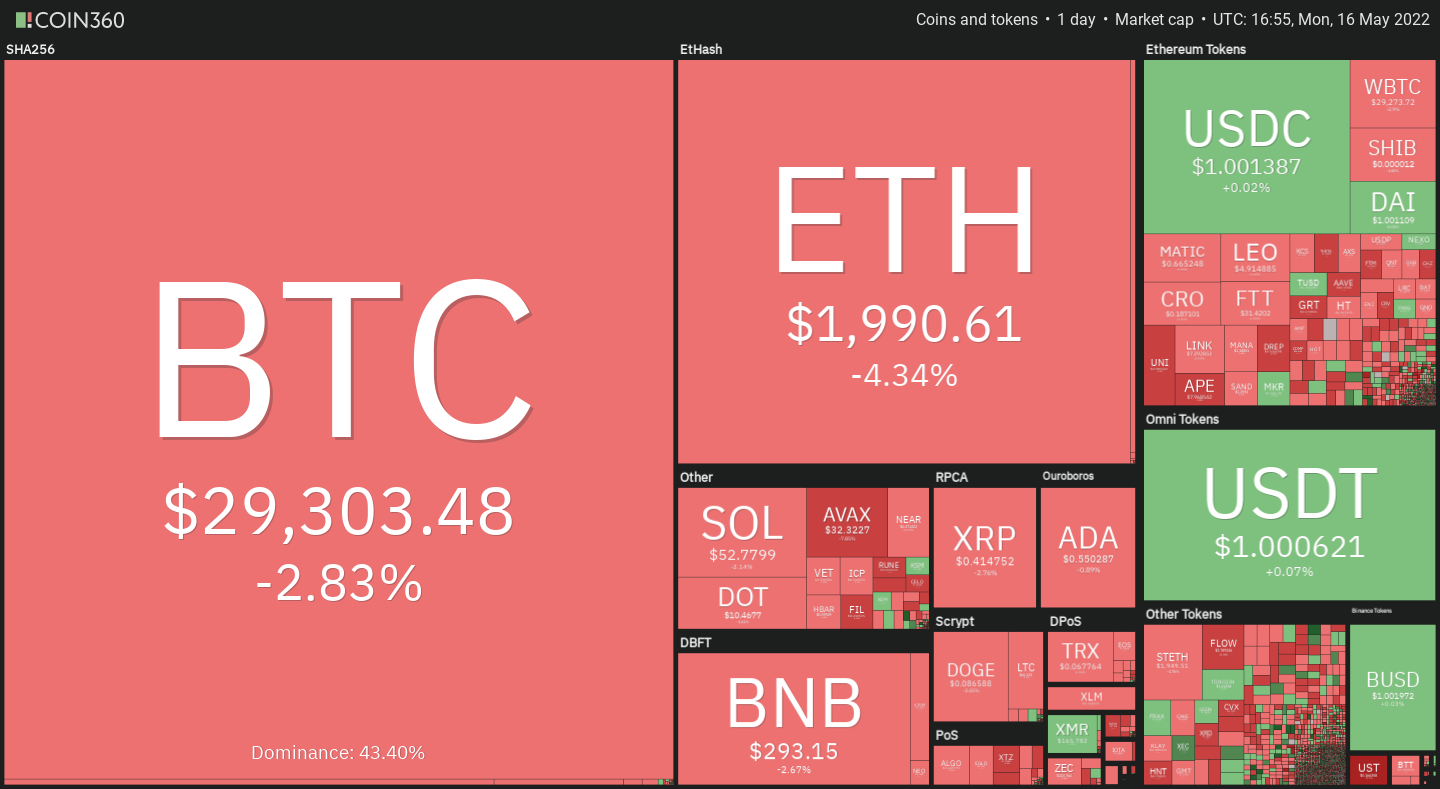
https://images.cointelegraph.com/images/840_aHR0cHM6Ly9zMy5jb2ludGVsZWdyYXBoLmNvbS91cGxvYWRzLzIwMjItMDUvZWFmMjA4NGYtZmZjYy00OGU2LThhYzEtNDBkMGRiODUyODQwLmpwZw==.jpgBitcoin (BTC) has been relatively calm during the weekend as crypto traders try to rebuild the markets after the Terra LUNA debacle. With macro factors not supportive, several analysts expect the recovery to be a slow grind.
Crypto research firm Delphi Digital said in a recent report that the rally in the United States dollar index (DXY) had pushed its 14-month relative strength index “above 70 for the first time since its late 2014 to 2016 run up.”
Historically, 11 out of 14 such instances had resulted in the DXY rising about 5.7% over the following 12 months. If the inverse correlation between the DXY and Bitcoin remains intact, that could spell trouble for crypto investors.
Arthur Hayes, the former CEO of crypto derivatives platform BitMEX, said in his latest blog post that the crypto markets “must be allowed time to heal” after the bloodbath. He said that if Bitcoin drops to $20,000 and Ether (ETH) to $1,300, he would turn into a buyer.
Although crypto markets are in a downtrend, periodic bear market rallies could offer short-term trading opportunities. Let’s study the charts of the top-5 cryptocurrencies that may bounce if the sentiment improves.
BTC/USDT
Bitcoin attempted a strong bounce on May 13 but the long wick on the day’s candlestick suggests that bears are in no mood to let go of their advantage. However, a minor positive is that the bears have not been able to sustain the price below the crucial support at $28,805.
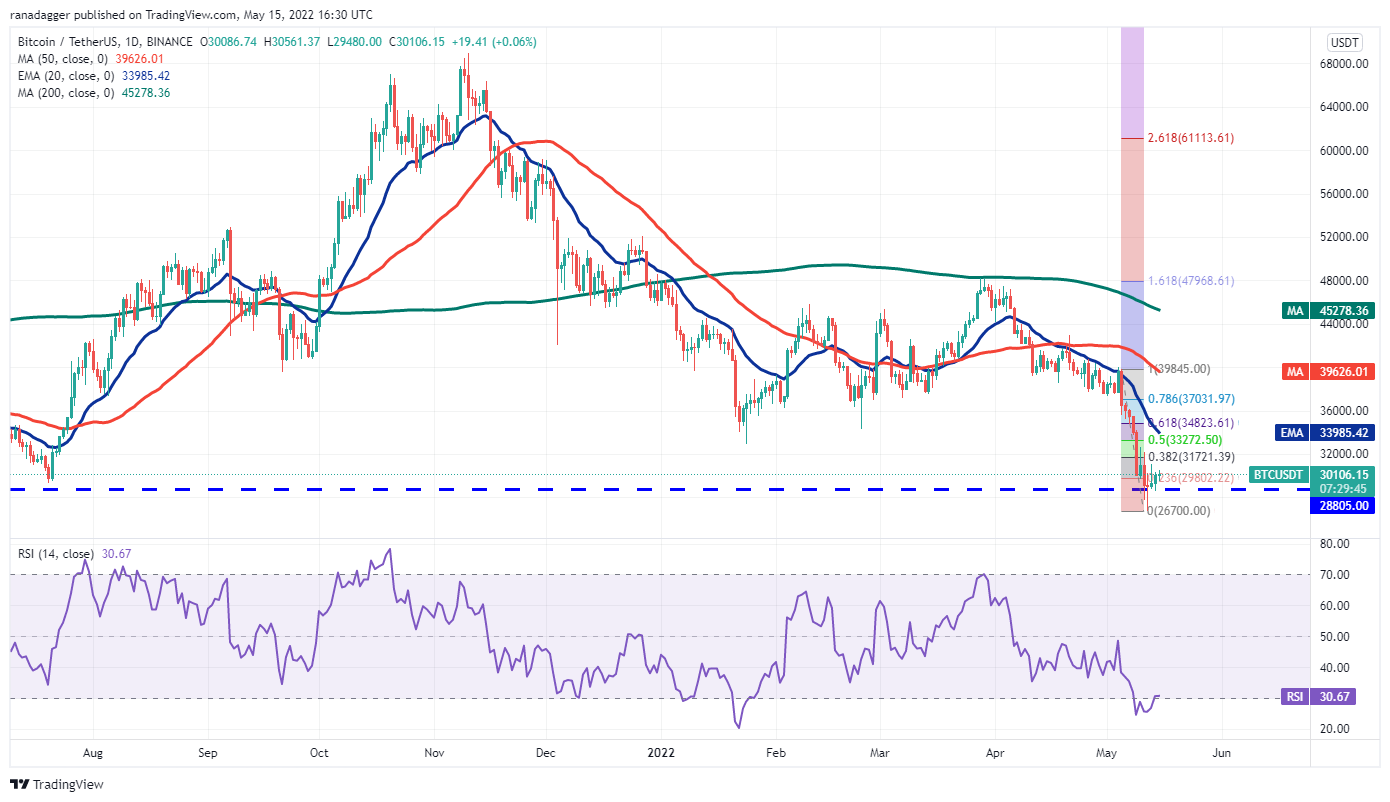
The recovery could hit a hurdle at the 38.2% Fibonacci retracement level at $31,721 and again at the 20-day exponential moving average (EMA)($33,985).
If the price turns down from either resistance, the bears will fancy their chances and try to sink the BTC/USDT pair below $26,700. If they manage to do that, the downtrend could resume. The next support on the downside is $25,000 and then $21,800.
Contrary to this assumption, if buyers drive the price above the 61.8% Fibonacci retracement level at $34,823, it will suggest that the selling pressure may be weakening. That could result in a sharp rally to the 50-day simple moving average (SMA) ($39,626) where the bears are again expected to pose a strong challenge.
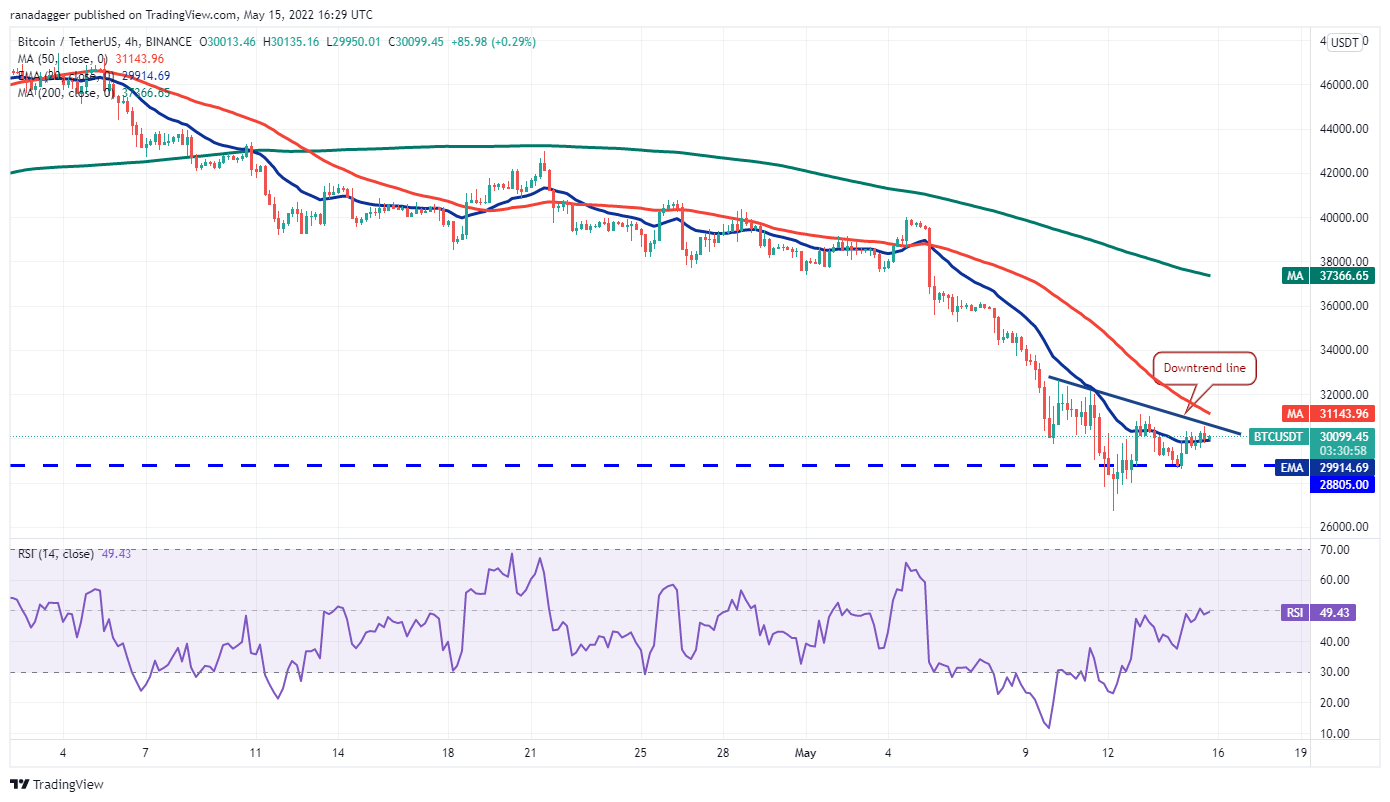
The bulls are buying the dips to the critical support at $28,805 while the bears are attempting to stall the recovery at the downtrend line. The 20-EMA has flattened out and the RSI has risen to the midpoint, indicating a balance between supply and demand.
If buyers propel the price above the downtrend line, it will indicate advantage to buyers. The bulls could then push the price to $32,659. A break and close above this level could clear the path for a possible rally to the 200-SMA.
Conversely, if bears pull the price below $28,805, the pair could drop to $27,700. The bulls are likely to defend this support aggressively because a break below it could signal the resumption of the downtrend.
MANA/USDT
Decentraland (MANA) has been in a strong downtrend for the past several days. The bulls aggressively defended the decline to $0.60 on May 12 resulting in a recovery to the 20-day EMA ($1.36).
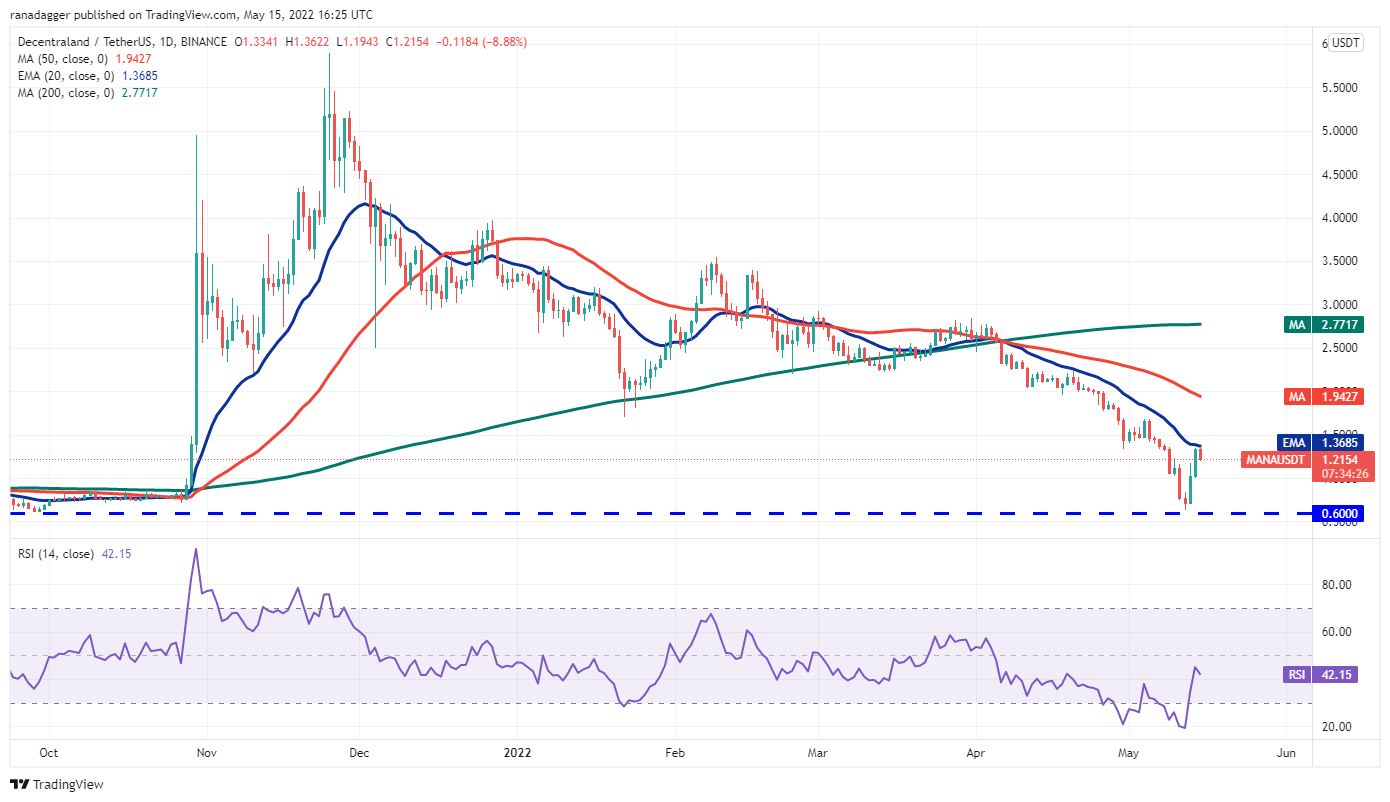
In a downtrend, the bears sell on rallies to the 20-day EMA. If the price turns down sharply from the current level, the bears will again try to retest the support at $0.60. A break and close below this level could indicate the resumption of the downtrend. The MANA/USDT pair could then extend its decline to the psychological level at $0.50.
Conversely, if bulls do not give up much ground from the current level, it will suggest that traders are buying on dips. That could enhance the prospects of a break above the 20-day EMA. If that happens, the pair could rally to the 50-day SMA ($1.94).
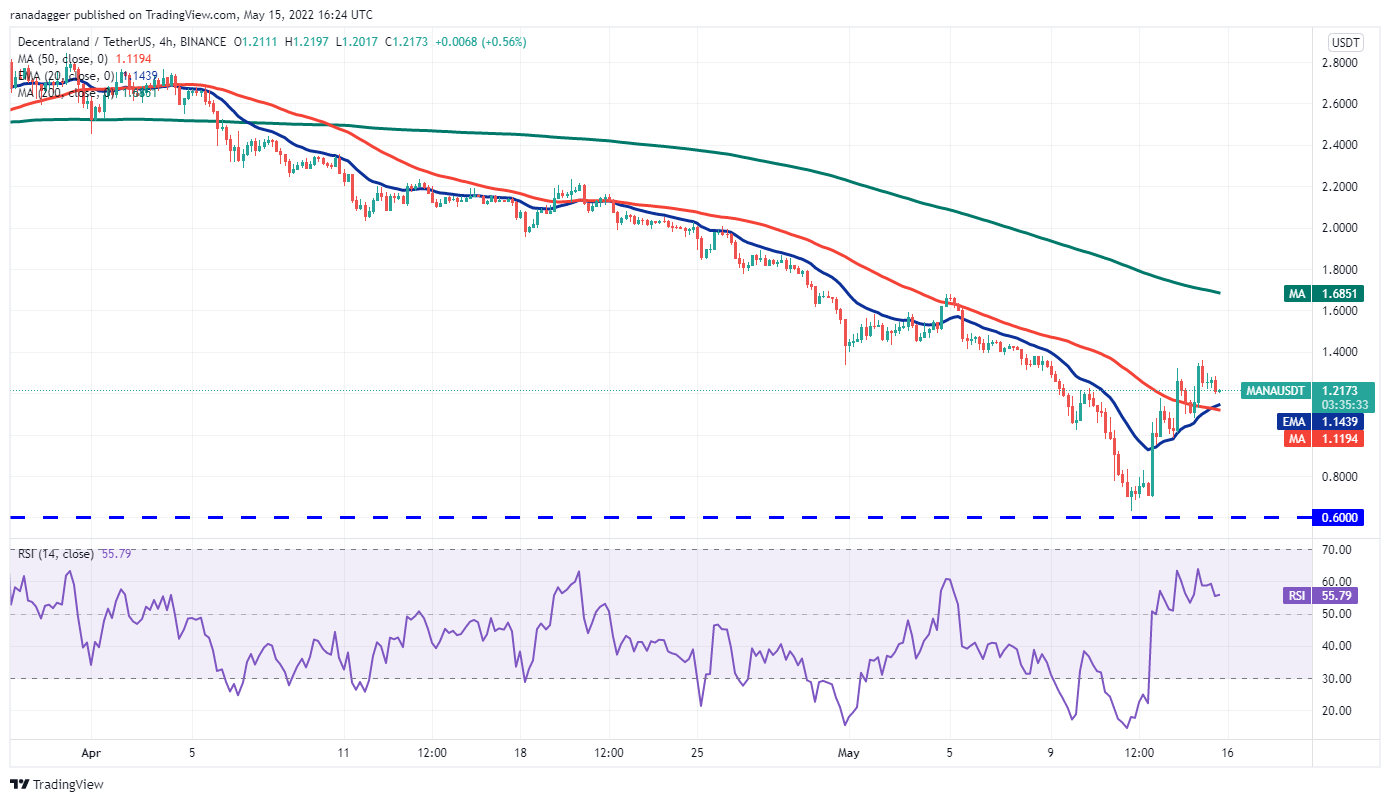
The strong rebound off the 0.60 level has risen above the 50-SMA. Although bears tried to pull the pair down, the bulls bought the dips to the 20-EMA. This suggests that bulls are attempting a comeback. The buyers will now attempt to push the price to the 200-SMA, which is likely to act as a strong resistance.
Contrary to this assumption, if the price turns down from the current level and breaks below the 20-EMA, it will suggest that bears are active at higher levels. That could pull the price down to $0.95. If this level cracks, the pair could retest the crucial support at $0.60.
MKR/USDT
Maker (MKR) bounced off the psychological support at $1,000 on May 12 indicating that bulls are defending this level with all their might. The bulls pushed the price to the 50-day SMA ($1,754) on May 13 but the long wick on the day’s candlestick shows strong selling at higher levels.
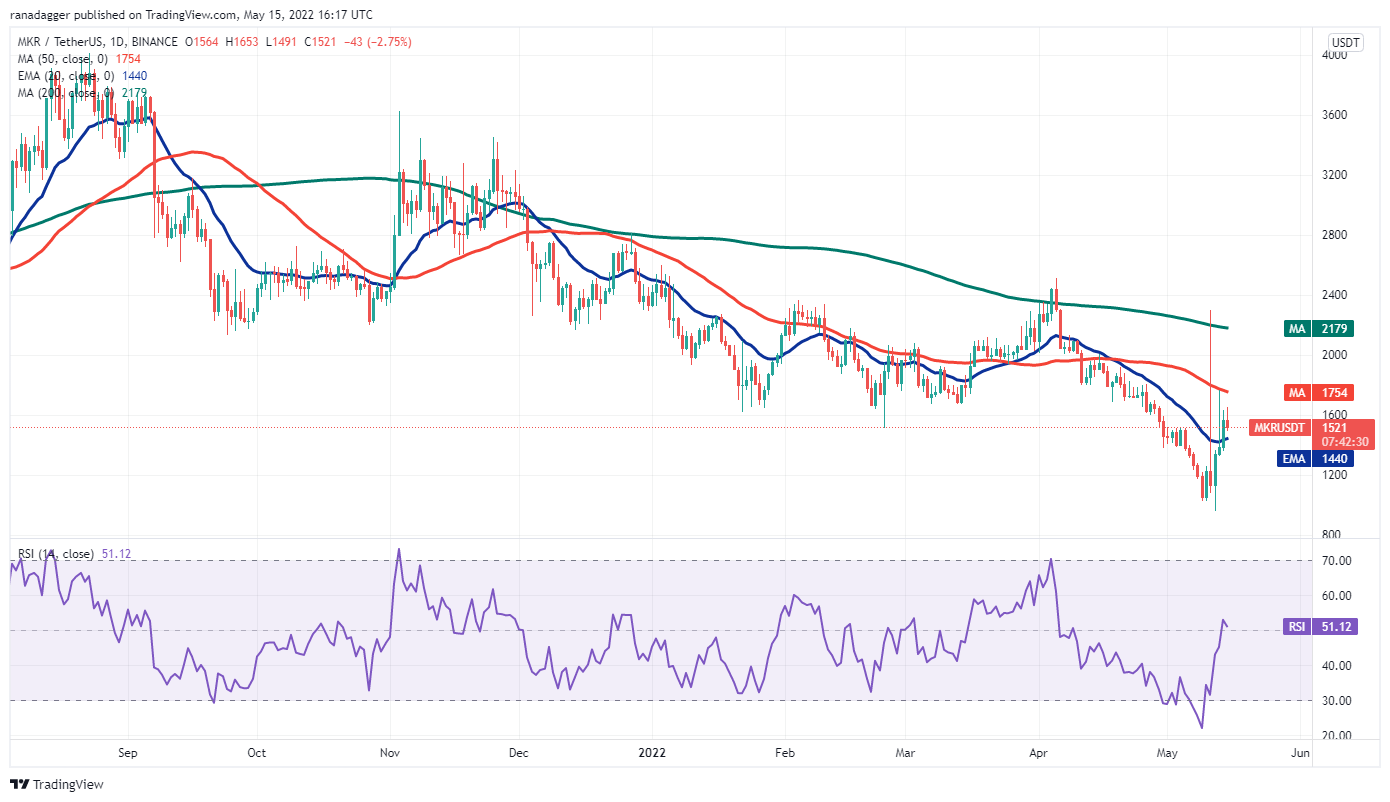
However, a positive sign is that the bulls did not give up ground on May 13 and resumed the relief rally. The 20-day EMA ($1,440) has started to turn up and the RSI is just above the midpoint, suggesting a minor advantage to buyers.
The bulls will attempt to drive the price above the 50-day SMA. If they succeed, it will clear the path for a possible rally to the 200-day SMA ($2,179).
Alternatively, if the price turns down from the current level or the 50-day SMA, it will suggest strong selling at higher levels. The bullish momentum could weaken if bears pull and sustain the price below the 20-day EMA.
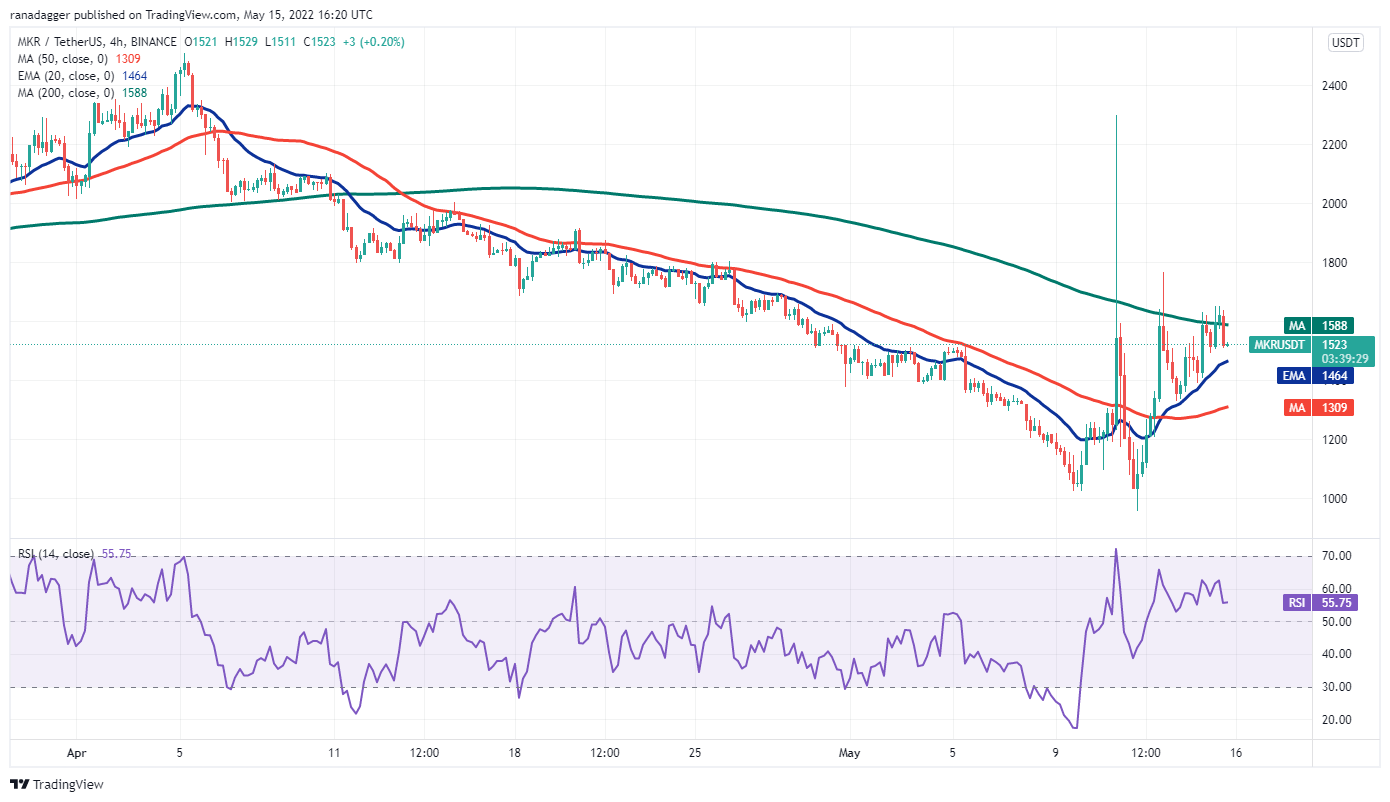
The 200-SMA has been repeatedly acting as a strong resistance but a positive sign is that the bulls are buying the dips to the 20-EMA. This suggests a change in sentiment from selling on rallies to buying on dips.
If buyers sustain the price above the 200-SMA, the MKR/USDT pair could pick up momentum and rally to $1,800 and later to $1,900. Conversely, if the price turns down from the current level and breaks below the 20-EMA, the pair could drop to the 50-SMA.
Related: Ethereum in danger of 25% crash as ETH price forms classic bearish technical pattern
ZEC/USDT
Zcash (ZEC) has successfully held the strong support at $81 in the past few days. Although bears pulled the price below this support on May 11 and 12, they could not sustain the lower levels. This indicates strong demand from the bulls.
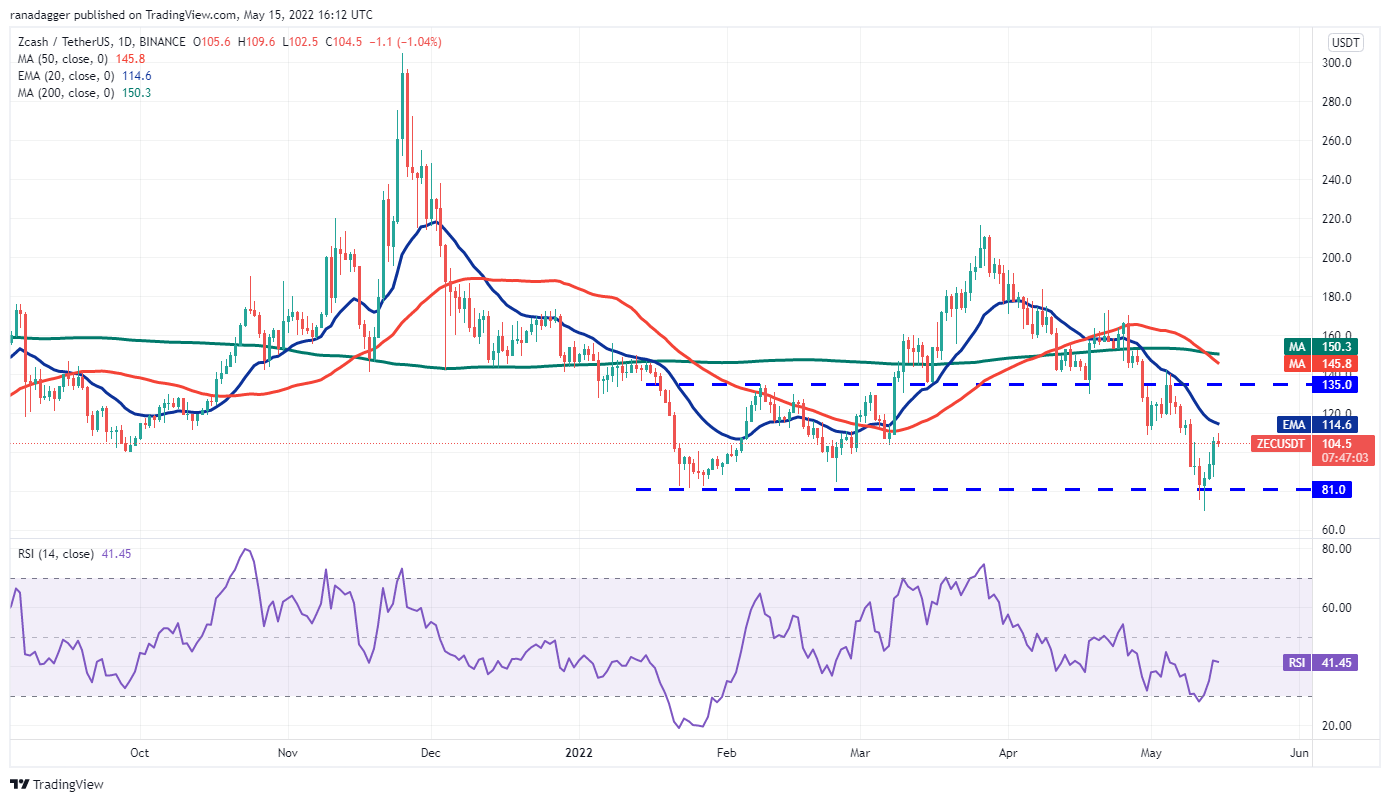
The ZEC/USDT pair could now rise to the 20-day EMA ($114). This level had acted as a strong hurdle during the previous pullback on May 5. Therefore, the bears will try to stall the recovery at the 20-day EMA.
If they manage to do that, the price could again drop toward the crucial support at $81. The bears will have to sustain the price below this level to start the next leg of the downtrend.
Alternatively, if bulls push the price above the 20-day EMA, the pair could rise to $135 where the bears may mount a strong defense. The bulls will have to push the price above the 200-day SMA ($150) to signal a potential change in trend.
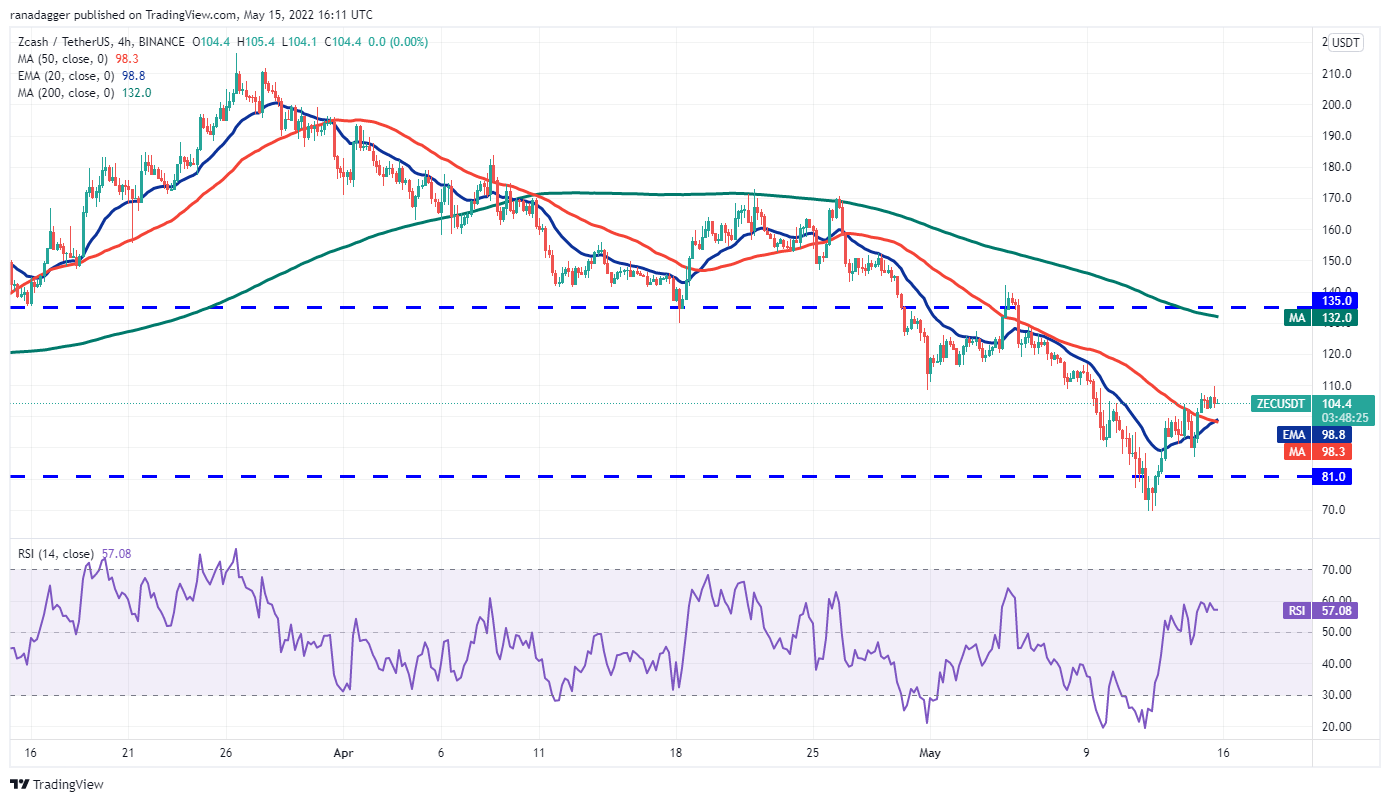
The bulls have pushed the price above the 50-SMA on the 4-hour chart. This suggests that demand remains intact at higher levels. The 20-EMA has started to turn up and the RSI is in the positive zone, indicating that sellers may be losing their grip.
The buyers could face resistance in the zone between $108 to $116 but if they overcome this barrier, the recovery could reach $135.
On the downside, the first sign of weakness will be a break and close below $87. That could open the doors for a retest of the crucial support zone between $81 and $69. A break and close below $69 could indicate the resumption of the downtrend.
KCS/USDT
KuCoin Token (KCS) rebounded sharply off the strong support at $9 on May 12. The relief rally has risen above the first hurdle at the 38.2% Fibonacci retracement level at $12.89, which is a mild positive.
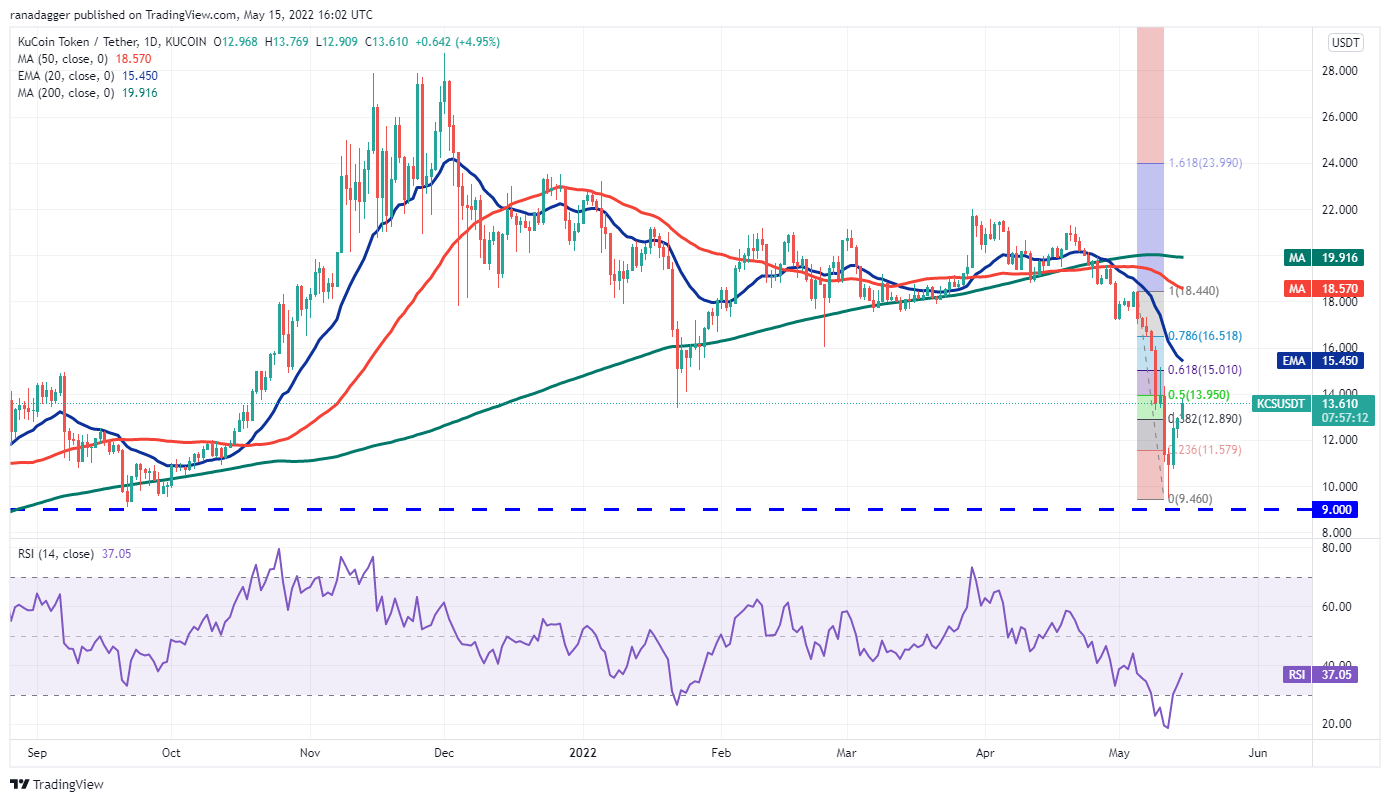
The KCS/USDT pair could next rise to the 50% retracement level at $14.95 and later rally to the critical overhead resistance at the 20-day EMA ($15.45). This is an important level to keep an eye on because a break above it could signal that the downtrend may have ended.
Contrary to this assumption, if the price turns down sharply from the current level, the bears will again attempt to sink the pair below the crucial support at $9. If this level cracks, the pair could resume its downtrend and decline to $5 and thereafter to $4.40.
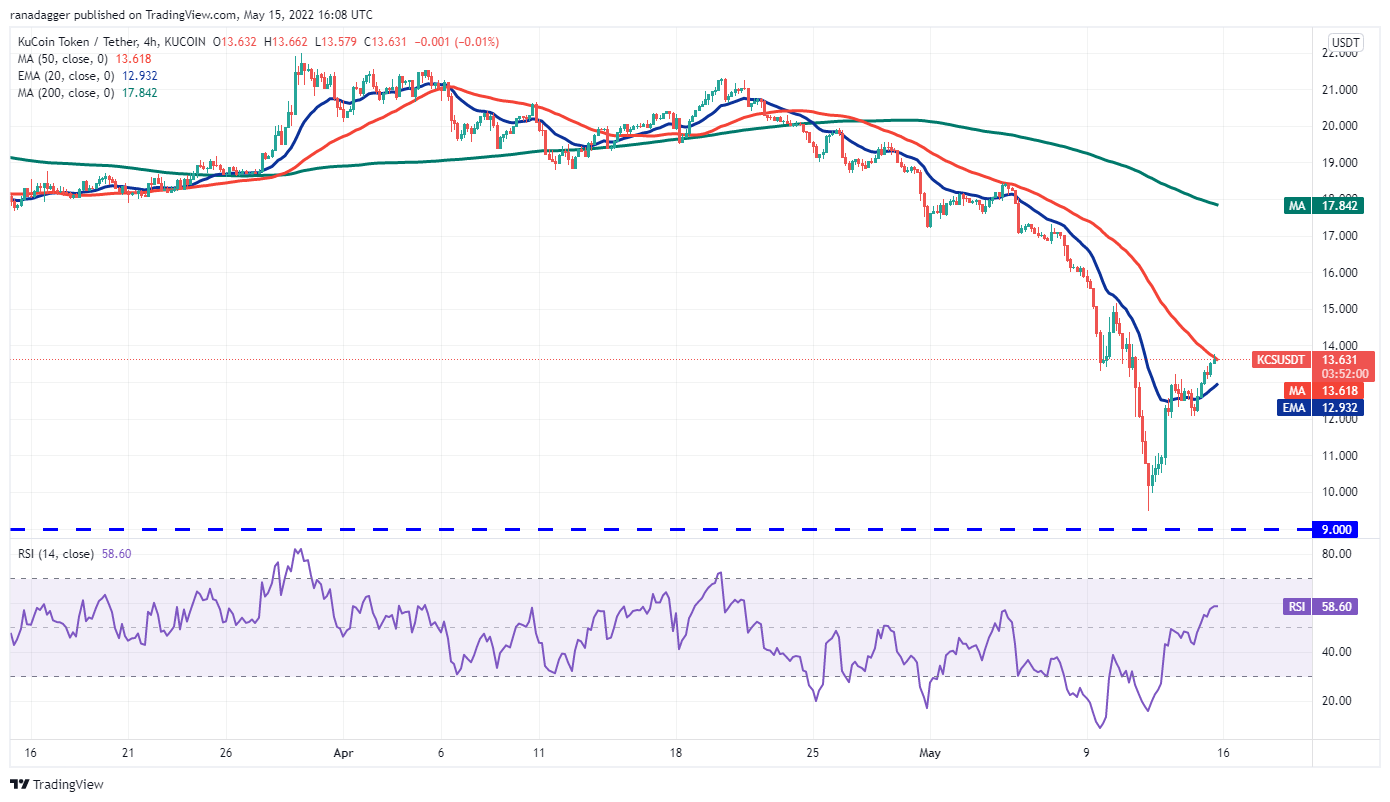
The bulls have pushed the price to the 50-SMA indicating a strong comeback attempt. The 20-EMA has started to turn up gradually and the RSI has jumped into the positive territory, suggesting that the path of least resistance is to the upside.
If bulls push the price above the 50-SMA, the pair could rally to $15. The bullish momentum could pick up further if buyers overcome this barrier. This positive view could invalidate in the short term if the price turns down from the 50-SMA and breaks below $12. The bears will then try to sink the pair to the strong support at $9.
The views and opinions expressed here are solely those of the author and do not necessarily reflect the views of Cointelegraph. Every investment and trading move involves risk, you should conduct your own research when making a decision.

