Binance to delist privacy tokens in France, Italy, Spain and Poland
Binance users in France, Italy, Poland and Spain will no longer be able to buy or sell 12 privacy tokens starting from June 26.
Čítaj viac
Binance users in France, Italy, Poland and Spain will no longer be able to buy or sell 12 privacy tokens starting from June 26.
Čítaj viac
Dogecoin, Zcash and Litecoin have already patched the “critical” vulnerability, but hundreds of others may not have, risking billions’ worth of crypto.
Čítaj viac
Tento príspevok bol pôvodne publikovaný na stránke...
Čítaj viac
Tento príspevok bol pôvodne publikovaný na stránke...
Čítaj viac
Tento príspevok bol pôvodne publikovaný na stránke...
Čítaj viac
Tento príspevok bol pôvodne publikovaný na stránke...
Čítaj viac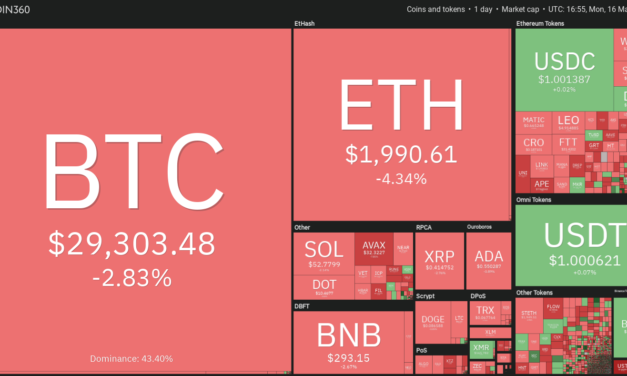
Bitcoin (BTC) has been relatively calm during the weekend as crypto traders try to rebuild the markets after the Terra LUNA debacle. With macro factors not supportive, several analysts expect the recovery to be a slow grind.Crypto research firm Delphi Digital said in a recent report that the rally in the United States dollar index (DXY) had pushed its 14-month relative strength index “above 70 for the first time since its late 2014 to 2016 run up.”Historically, 11 out of 14 such instances had resulted in the DXY rising about 5.7% over the following 12 months. If the inverse correlation between the DXY and Bitcoin remains intact, that could spell trouble for crypto investors.Crypto market data daily view. Source: Coin360Arthur Hayes, the former CEO of crypto derivatives platform BitMEX, said in his latest blog post that the crypto markets “must be allowed time to heal” after the bloodbath. He said that if Bitcoin drops to $20,000 and Ether (ETH) to $1,300, he would turn into a buyer.Although crypto markets are in a downtrend, periodic bear market rallies could offer short-term trading opportunities. Let’s study the charts of the top-5 cryptocurrencies that may bounce if the sentiment improves.BTC/USDTBitcoin attempted a strong bounce on May 13 but the long wick on the day’s candlestick suggests that bears are in no mood to let go of their advantage. However, a minor positive is that the bears have not been able to sustain the price below the crucial support at $28,805.BTC/USDT daily chart. Source: TradingViewThe recovery could hit a hurdle at the 38.2% Fibonacci retracement level at $31,721 and again at the 20-day exponential moving average (EMA)($33,985). If the price turns down from either resistance, the bears will fancy their chances and try to sink the BTC/USDT pair below $26,700. If they manage to do that, the downtrend could resume. The next support on the downside is $25,000 and then $21,800.Contrary to this assumption, if buyers drive the price above the 61.8% Fibonacci retracement level at $34,823, it will suggest that the selling pressure may be weakening. That could result in a sharp rally to the 50-day simple moving average (SMA) ($39,626) where the bears are again expected to pose a strong challenge.BTC/USDT 4-hour chart. Source: TradingViewThe bulls are buying the dips to the critical support at $28,805 while the bears are attempting to stall the recovery at the downtrend line. The 20-EMA has flattened out and the RSI has risen to the midpoint, indicating a balance between supply and demand.If buyers propel the price above the downtrend line, it will indicate advantage to buyers. The bulls could then push the price to $32,659. A break and close above this level could clear the path for a possible rally to the 200-SMA.Conversely, if bears pull the price below $28,805, the pair could drop to $27,700. The bulls are likely to defend this support aggressively because a break below it could signal the resumption of the downtrend.MANA/USDTDecentraland (MANA) has been in a strong downtrend for the past several days. The bulls aggressively defended the decline to $0.60 on May 12 resulting in a recovery to the 20-day EMA ($1.36).MANA/USDT daily chart. Source: TradingViewIn a downtrend, the bears sell on rallies to the 20-day EMA. If the price turns down sharply from the current level, the bears will again try to retest the support at $0.60. A break and close below this level could indicate the resumption of the downtrend. The MANA/USDT pair could then extend its decline to the psychological level at $0.50.Conversely, if bulls do not give up much ground from the current level, it will suggest that traders are buying on dips. That could enhance the prospects of a break above the 20-day EMA. If that happens, the pair could rally to the 50-day SMA ($1.94).MANA/USDT 4-hour chart. Source: TradingViewThe strong rebound off the 0.60 level has risen above the 50-SMA. Although bears tried to pull the pair down, the bulls bought the dips to the 20-EMA. This suggests that bulls are attempting a comeback. The buyers will now attempt to push the price to the 200-SMA, which is likely to act as a strong resistance.Contrary to this assumption, if the price turns down from the current level and breaks below the 20-EMA, it will suggest that bears are active at higher levels. That could pull the price down to $0.95. If this level cracks, the pair could retest the crucial support at $0.60.MKR/USDTMaker (MKR) bounced off the psychological support at $1,000 on May 12 indicating that bulls are defending this level with all their might. The bulls pushed the price to the 50-day SMA ($1,754) on May 13 but the long wick on the day’s candlestick shows strong selling at higher levels.MKR/USDT daily chart. Source: TradingViewHowever, a positive sign is that the bulls did not give up ground on May 13 and resumed the relief rally. The 20-day EMA ($1,440) has started to turn up and the RSI is just above the midpoint, suggesting a minor advantage to buyers.The bulls will attempt to drive the price above the 50-day SMA. If they succeed, it will clear the path for a possible rally to the 200-day SMA ($2,179). Alternatively, if the price turns down from the current level or the 50-day SMA, it will suggest strong selling at higher levels. The bullish momentum could weaken if bears pull and sustain the price below the 20-day EMA.MKR/USDT 4-hour chart. Source: TradingViewThe 200-SMA has been repeatedly acting as a strong resistance but a positive sign is that the bulls are buying the dips to the 20-EMA. This suggests a change in sentiment from selling on rallies to buying on dips.If buyers sustain the price above the 200-SMA, the MKR/USDT pair could pick up momentum and rally to $1,800 and later to $1,900. Conversely, if the price turns down from the current level and breaks below the 20-EMA, the pair could drop to the 50-SMA.Related: Ethereum in danger of 25% crash as ETH price forms classic bearish technical patternZEC/USDTZcash (ZEC) has successfully held the strong support at $81 in the past few days. Although bears pulled the price below this support on May 11 and 12, they could not sustain the lower levels. This indicates strong demand from the bulls.ZEC/USDT daily chart. Source: TradingViewThe ZEC/USDT pair could now rise to the 20-day EMA ($114). This level had acted as a strong hurdle during the previous pullback on May 5. Therefore, the bears will try to stall the recovery at the 20-day EMA. If they manage to do that, the price could again drop toward the crucial support at $81. The bears will have to sustain the price below this level to start the next leg of the downtrend.Alternatively, if bulls push the price above the 20-day EMA, the pair could rise to $135 where the bears may mount a strong defense. The bulls will have to push the price above the 200-day SMA ($150) to signal a potential change in trend.ZEC/USDT 4-hour chart. Source: TradingViewThe bulls have pushed the price above the 50-SMA on the 4-hour chart. This suggests that demand remains intact at higher levels. The 20-EMA has started to turn up and the RSI is in the positive zone, indicating that sellers may be losing their grip.The buyers could face resistance in the zone between $108 to $116 but if they overcome this barrier, the recovery could reach $135.On the downside, the first sign of weakness will be a break and close below $87. That could open the doors for a retest of the crucial support zone between $81 and $69. A break and close below $69 could indicate the resumption of the downtrend.KCS/USDTKuCoin Token (KCS) rebounded sharply off the strong support at $9 on May 12. The relief rally has risen above the first hurdle at the 38.2% Fibonacci retracement level at $12.89, which is a mild positive.KCS/USDT daily chart. Source: TradingViewThe KCS/USDT pair could next rise to the 50% retracement level at $14.95 and later rally to the critical overhead resistance at the 20-day EMA ($15.45). This is an important level to keep an eye on because a break above it could signal that the downtrend may have ended.Contrary to this assumption, if the price turns down sharply from the current level, the bears will again attempt to sink the pair below the crucial support at $9. If this level cracks, the pair could resume its downtrend and decline to $5 and thereafter to $4.40.KCS/USDT 4-hour chart. Source: TradingViewThe bulls have pushed the price to the 50-SMA indicating a strong comeback attempt. The 20-EMA has started to turn up gradually and the RSI has jumped into the positive territory, suggesting that the path of least resistance is to the upside.If bulls push the price above the 50-SMA, the pair could rally to $15. The bullish momentum could pick up further if buyers overcome this barrier. This positive view could invalidate in the short term if the price turns down from the 50-SMA and breaks below $12. The bears will then try to sink the pair to the strong support at $9.The views and opinions expressed here are solely those of the author and do not necessarily reflect the views of Cointelegraph. Every investment and trading move involves risk, you should conduct your own research when making a decision.
Čítaj viac
Tento príspevok bol pôvodne publikovaný na stránke...
Čítaj viac
Tento príspevok bol pôvodne publikovaný na stránke...
Čítaj viac
Recent weeks saw a massive surge of the so-called privacy coins’ prices — namely Monero (XMR), Dash (DASH), Zcash (ZEC) and Haven Protocol (XHV). As many other cryptocurrencies and the industry at large faced immense regulatory pressure amid the war in Ukraine, one narrative that began taking hold in the crypto space was the potential of such privacy-enhancing assets to provide investors a greater level of financial anonymity. But, can privacy coins deliver on Bitcoin’s (BTC) original promise? A good month for privacy-focused assetsOver the past month, Monero has almost doubled its tally. With some minor oscillations, it rose from $134 on Feb. 24 to over $200 on March 26. ZEC showed even more impressive dynamics that hiked from $88 to $202 over the same period. DASH also pulled off a rally, if a bit more modest, from $83 to $128. One of the biggest winners appeared to be XHV, which has almost tripled its price from $1.60 to $4.20. Two main macro-level factors could underpin this sudden rise of privacy coins. The first one is the regulatory pressure building up around more “mainstream” cryptocurrencies due to the war in Ukraine and the resulting suspicion — as unsound as it is — that Russian elites can use crypto to circumvent the financial sanctions imposed on them. Another one is the executive order by United States President Joe Biden, which, in fact, doesn’t bring any outright harm to the industry with its roadmap or reports that should eventually lead to a clear regulatory framework for digital assets in the U.S. Speaking to Cointelegraph, Justin Ehrenhofer from the Monero community suggested that the recent price surge has come from more family funds and individuals holding Monero as a hedge and was spurred by recent market and political turmoil. A member of the Haven Protocol community, Ahawk, tied XHV’s price spike to an upcoming integration on THORChain, which he called one of the most cutting-edge decentralized exchanges (DEXs) in all of crypto. Jack Gavigan, executive director of the Zcash Foundation, said that the surge of privacy coins’ prices could be the result of Bitcoin price’s strong dynamics. Privacy without compromisesAt the outset of the cryptocurrency movement, anonymity was one of the core promises of Bitcoin and crypto at large. But, alongside industry maturing and gradually merging with the traditional financial markets, digital currencies have faced a demand from both institutional investors and regulatory bodies everywhere to comply with the Know Your Customer (KYC) and Anti-Money Laundering (AML) standards. This strips users of anonymity, at least at the point of withdrawal/exchange operations on compliant platforms.As a series of high-profile enforcement actions in the U.S. demonstrated, blockchain traceability also doesn’t help those who wish to hide their financial operations. Privacy coins came about as a reaction to these compromises. “Bitcoin has never been private. Ether has never been private. Tether has never been private,” Ahawk noted to Cointelegraph, explaining crypto developers’ persistent drive to create “truly private,” fungible cryptocurrencies. Given the tendencies toward corporate and government overreach, it’s no surprise that such currencies have enjoyed heightened demand in recent years. Ahawk added:“Why do you need a password for your bank account? For the same reason crypto users increasingly need privacy options: You don’t want anyone to be able to see your entire financial history with the click of a few buttons. Just because you want your money and financial decisions to be private doesn’t mean you’re doing anything wrong.”Ehrenhofer said that without privacy, each address and output have unique histories associated with them, losing digital money’s key feature: fungibility. He commented:“This opens the door to mass surveillance and the assignment of proprietary risk scores to everyone’s money, which in turn makes transparent assets nonfungible in practice.”Gavigan, who himself wrote the Regulatory & Compliance Brief for Zcash, doesn’t see any major difference between privacy coins and traditional bank accounts in terms of KYC/AML compliance:“While the bank may not be able to see where you got the cash from or what you spend it on after you withdraw it, they still know who you are, and they can assess whether your deposits/withdrawals are normal for the type of customer you are.”Will regulators push back?This appetite for anonymity, however, doesn’t find many supporters among regulators and law enforcement. South Korea was the first country to outlaw anonymity-enhanced currencies (AEC) straight away in November 2020. A month later, the U.S. Financial Crimes Enforcement Network (FinCEN) mentioned that “several types of AEC are increasing in popularity and employ various technologies that inhibit investigators’ ability both to identify transaction activity using blockchain data.” Someexchange platforms such as BitBay and Bittrex have been delisting privacy coins in the past several years. Despite that, it’s not only investors but developers, too, who see the bright future for AECs in the years to come. Ehrenhofer believes there’s nothing impossible about combining enhanced privacy for users with compliance with regulators. It’s not accidental that privacy coin developers mention cash as AECs’ closest equivalent. As KYC/AML requirements become more common in the cryptocurrency space, Monero’s importance will only increase, Ehrenhofer assured:“No one is reasonably asking Monero or Bitcoin to ‘comply’ with AML regulations — that makes no sense. Instead, the push is for regulated entities such as exchanges to follow these AML regulations. They unquestionably can already do this.”Ahawk also doesn’t see reasons to cater to regulators’ demands on AEC developers. “Any so-called tension is due to the fact that some regulators want to be able to track every transaction you make with your crypto,” he claims, adding that it is a number one mission for developers to provide privacy for its users. “Private cryptocurrencies actually make it easy for you to comply with regulations in their jurisdiction. But, more important is what they ‘don’t do:’ provide a public ledger for anyone in the world to track your every financial transaction, down to the penny.”Gavigan also observed that in some respects, privacy coins make it easier for their owners to comply. For one, regulated entities can attach the required “Travel Rule” information to a shielded Zcash transaction by using the encrypted memo field, which is not possible with Bitcoin. What’s nextPrivacy protocols should continue what they are already doing, Ahawk opined, which is to create secure protections for everyday users and make sure they can comply with regulations in their respective jurisdictions. He stated that “it’s the job of law enforcement to track down criminals, not cryptocurrency developers.”The mechanisms for that already exist, Ehrenhofer noted. Regulated exchanges already collect information about user trades, deposits and withdrawals. He added:“The United States should encourage cooperative, regulated exchanges to list Monero so that investigators can receive more information about suspicious transactions through Suspicious Activity Reports and Currency Transaction Records.”The question is whether these exchanges would collaborate with both regulators and developers.
Čítaj viac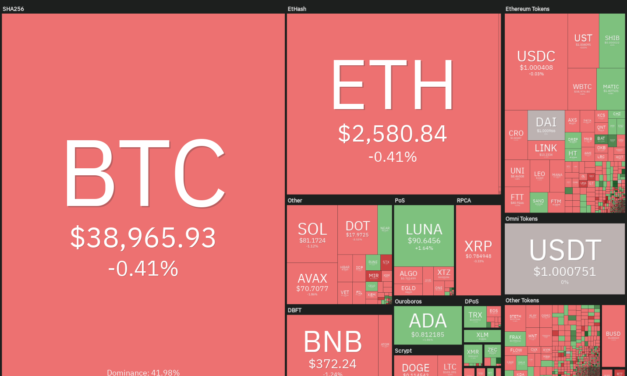
Bitcoin (BTC) has been relatively calm during the weekend, indicating that traders are playing it safe and not waging large bets before the upcoming Federal Open Market Committee meeting on March 15 and March 16. The quantum of the rate hike could act as the next trigger for the crypto markets.The current neutral setup of Bitcoin has kept the analysts guessing. Analytics resource Material Indicators warned that Bitcoin could plunge but they advised investors to be ready to buy the dip as they believe that the “bounce can change your life.”Crypto market data daily view. Source: Coin360A Price Waterhouse Coopers’ Sports Outlook 2022 report for North America highlighted three use cases for nonfungible tokens, which could shape the future of sports. The consultancy believes that NFTs and digital assets are among the ten major trends in the sports industry.Could the crypto markets start a directional move in the near term? Let’s study the charts of the top-5 cryptocurrencies that may participate in a rally if the bullish sentiment picks up.BTC/USDTBitcoin formed a Doji candlestick pattern on March 12 and on Sunday, indicating indecision among the bulls and bears. The price is stuck between the 20-day exponential moving average ($39,810) and the horizontal support at $37,000.BTC/USDT daily chart. Source: TradingViewThe 20-day EMA is flattish and the relative strength index (RSI) is just below the midpoint, indicating a balance between supply and demand.If the price rises and breaks above the 50-day simple moving average ($39,978) the bulls will attempt to push the BTC/USDT pair above $42,600. If they succeed, the pair could rally to $45,400 and later to the resistance line of the channel.Conversely, if the price turns down and breaks below $37,000, the bears will smell an opportunity. The sellers will then try to pull and sustain the pair below the support line of the channel. Such a move could clear the path for a possible drop to $30,000.BTC/USDT 4-hour chart. Source: TradingViewThe pair is forming a descending triangle pattern which will complete on a break and close below the strong support at $37,000. The pair could then drop to $34,322 and later start its journey toward the pattern target at $29,250.Alternatively, if bulls push and sustain the price above the 50-SMA, the pair could rise to the downtrend line. A break and close above this level will invalidate the bearish pattern. That could attract buying and the pair may then rally toward $45,400.DOT/USDTPolkadot (DOT) has been in a downtrend for the past several months but the bulls are trying to form a bottom in the zone between $16 and $14. The price rose above the 20-day EMA ($17) but the bulls have not been able to overcome the barrier at the 50-day SMA ($18).DOT/USDT daily chart. Source: TradingViewHowever, a positive sign is that the bulls have not given up much ground from the 50-day SMA. This suggests that the traders may be holding on to their position anticipating a break above the resistance. If that happens, the DOT/USDT pair could rally to the overhead resistance at $23 where the bears may again pose a stiff challenge.The flattish 20-day EMA and the RSI near the midpoint suggest a range-bound action in the short term. If the price turns down from the 50-day SMA, the bears will try to pull the pair below $16. If they succeed, the pair could retest the critical support at $14.DOT/USDT 4-hour chart. Source: TradingViewThe 4-hour chart shows that the pair is oscillating between $16 and $19. The failure of the buyers to propel the price above the overhead resistance may have attracted profit-booking from short-term traders. That pulled the price to the 50-SMA.If the price rises above the 200-SMA, it will suggest that bulls continue to buy on dips. The buyers will then again try to drive the price above the overhead resistance at $19. If they manage to do that, the pair could rise to $20 and later make a dash toward $23.Conversely, a break and close below the 50-SMA may increase the possibility of a drop to the strong support at $16.SAND/USDTThe Sandbox (SAND) has been range-bound between $2.55 and $4.86 for the past several weeks. The bears pulled the price below the 200-day SMA ($3.15) on March 4 but haven’t been able to break the support at $2.55.SAND/USDT daily chart. Source: TradingViewThis indicates accumulation near the support of the range. The RSI is showing signs of a positive divergence, indicating that the bearish momentum may be weakening.If the price rises from the current level, the bulls will try to push the SAND/USDT pair above the 200-day SMA. If that happens, the pair could rise to the 50-day SMA ($3.51). A break and close above this resistance could open the doors for a possible rally to $4.50 and then to $4.86.This bullish view will invalidate in the short term if the price turns down and slides below $2.55. That could suggest the resumption of the downtrend.SAND/USDT 4-hour chart. Source: TradingViewThe 50-SMA has been acting as a stiff resistance on the 4-hour chart. If bears sink the price below $2.70, the pair could drop to the solid support at $2.55. A break and close below this level could indicate advantage to bears.To negate this view, the bulls will have to push the price above the zone between the 50-SMA and $3. If that happens, the pair could rally to $3.42 where the bears may again mount a strong defense.Related: Cryptocurrencies against the ‘silent thief.’ Can Bitcoin protect capital from inflation?RUNE/USDTTHORChain (RUNE) broke above the moving averages on March 1 and successfully defended the level during the retest on March 8. This suggests that the sentiment has changed from sell on rallies to buy on dips.RUNE/USDT daily chart. Source: TradingViewThe bulls will now try to push the price to the 200-day SMA ($7.90) where the bears may again pose a strong challenge. If the price does not give up much ground from the 200-day SMA, the bulls will make one more attempt to clear this hurdle. If they succeed, the RUNE/USDT pair could rise to $9.Alternatively, if the price turns down from the current level, the 20-day EMA is the important level to watch out for. A strong rebound off this level will suggest that the bullish sentiment remains intact while a break below it could result in a decline to $4.RUNE/USDT 4-hour chart. Source: TradingViewThe 20-EMA on the 4-hour chart is sloping up and the RSI is in the positive zone, indicating that the bulls have the upper hand. The pair could now rise to the overhead resistance at $7 where the bears will try to stall the up-move.Alternatively, if the price turns down from the current level, the pair could drop to the 20-EMA. If the price rebounds off this level, the bulls will attempt to resume the uptrend. The bears will have to pull and sustain the price below the 20-EMA to indicate a change in the short-term trend.ZEC/USDTZcash (ZEC) broke and closed above the $135 resistance on March 8, which completed a double bottom pattern. This was followed by a break above the 200-day SMA ($145) on March 10, signaling that bulls are back in the game.ZEC/USDT daily chart. Source: TradingViewThe bears are currently attempting to pull the price back below the 200-day SMA and challenge the breakout level at $135. This is an important level for the bulls to defend because a break below it could suggest that the recent breakout may have been a bear trap. The ZEC/USDT pair could then drop to the 50-day SMA ($114).If the price rebounds off the current level or $135, it will suggest that the sentiment remains positive and traders are buying on dips. The bulls will then try to drive the pair above $160 and resume the up-move. The target objective of the breakout from the double bottom pattern is $189.ZEC/USDT 4-hour chart. Source: TradingViewThe bears pulled the price below the 20-EMA on the 4-hour chart but they have not been able to sustain the lower levels. This suggests that bulls continue to buy on every minor dip. The bulls will now try to push the price above $160 and resume the uptrend. The rising 20-EMA and the RSI in the positive territory indicate that the path of least resistance is to the upside.Contrary to this assumption, if the price turns down from the overhead resistance and slips below $143, the selling could pick up momentum. The pair could then drop to the critical support at $135.The views and opinions expressed here are solely those of the author and do not necessarily reflect the views of Cointelegraph. Every investment and trading move involves risk, you should conduct your own research when making a decision.
Čítaj viac
Tento príspevok bol pôvodne publikovaný na stránke...
Čítaj viac

