SEC appeal could amplify Ripple win, says Ripple Labs legal chief
Stuart Alderoty says that an appeal by the Securities and Exchange Commission could see Ripple consolidate its victory over the regulator even further.
Čítaj viac
Stuart Alderoty says that an appeal by the Securities and Exchange Commission could see Ripple consolidate its victory over the regulator even further.
Čítaj viac
Brad Garlinghouse has lashed out at the SEC for its “absurd” comments on the Ripple Labs case.
Čítaj viac
XLM has turned most overbought since April 2021, boosting risks of a 30% price decline by September.
Čítaj viac
XRP is currently mirroring a trend from the April-June 2021 that preceded the price falling by 65% in the following months.
Čítaj viac
Bitcoin and select cryptocurrencies are trying to start a rebound following the CPI data release but bulls may find it difficult to continue the recovery at higher levels.
Čítaj viac
Bitcoin and most major altcoins are witnessing aggressive selling at higher levels, indicating that the bears are trying to make a comeback.
Čítaj viac
XLM price is playing catchup to XRP’s March gains, quickly rising 25% versus the U.S. dollar while the XLM/XRP pair bounces from record lows.
Čítaj viac
XRP price rallied by 20% as investors grew optimistic about Ripple winning its case against the SEC.
Čítaj viac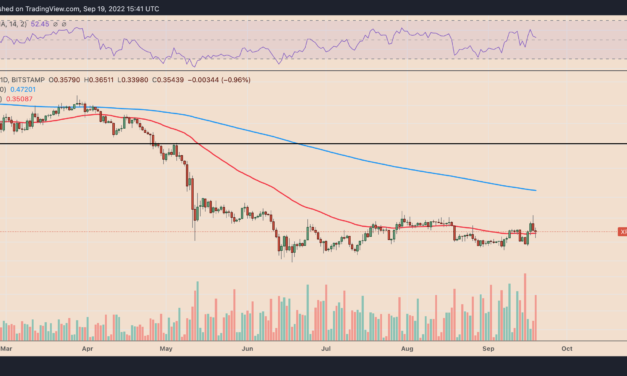
XRP pricewas wobbling between profits and losses on Sep. 19 despite hopes that Ripple would eventually win its long-running legal battle against the U.S. Securities and Exchange Commission (SEC).Ripple and the SEC both agreed to expedite the lawsuit on Friday to get an answer on whether $XRP is a security or not.From the updates of the case, it sounds like it’s in the favor of @Ripple pic.twitter.com/SAyl4VLxdM— Jeff Sekinger (@JeffSekinger) September 19, 2022Fed spoils SEC vs. Ripple euphoriaThe XRP/USD pair dropped by over 1% to $0.35 while forming extremely sharp bullish and bearish wicks on its Sep. 19 daily candlestick. In other words, its intraday performance hinted at a growing bias conflict among traders.XRP/USD daily price chart. Source: TradingViewThe indecisiveness could be due to XRP’s exposure to catalysts other than the SEC vs. Ripple lawsuit. Namely, the Federal Reserve’s potential to increase its benchmark interest rates by another 75 or 100 basis points in their policy meeting on Sep. 20.As Cointelegraph reported, fears of aggressive rate hikes have pressured the crypto market lower throughout the year, including Bitcoin (BTC) and Ether (ETH). XRP is also not immune, given the token’s consistently positive correlation with Bitcoin since October 2021.XRP/USD and BTC/USD daily correlation coefficient. Source: TradingViewFor instance, XRP’s daily correlation coefficient with Bitcoin on Sep. 19 was 0.47. A reading of 1 means that the two assets move in lockstep. XRP price in danger of going under $0.25 in Q4Independent market analyst Cheds highlighted that XRP has been fluctuating inside a rectangular range since June, adding that “there’s nothing to be excited about” at present.The range is defined by $0.38-$0.40 acting as resistance and $0.28-$0.30 acting as support. XRP’s price dropped after testing the resistance and, as of Sep. 19, was heading toward the support area, as shown below.XRP/USD daily price chart featuring head-and-shoulders setup. Source: TradingViewInterestingly, a move toward the rectangular range support could also trigger a classic bearish reversal pattern called the head-and-shoulders, defined by three consecutive peaks forming atop a common support level, with the middle peak (head) higher than the other two (left and right shoulders).Related: Ether staking could trigger securities laws — GenslerA head-and-shoulders pattern resolves after the price breaks below its support line and falls by as much as the maximum distance between the middle peak and the support. Applying this theory to XRP’s daily chart presents $0.242 as the downside target.In other words, XRP price could lose another 30% by the end of this year, driven primarily by macro catalysts.The views and opinions expressed here are solely those of the author and do not necessarily reflect the views of Cointelegraph.com. Every investment and trading move involves risk, you should conduct your own research when making a decision.
Čítaj viac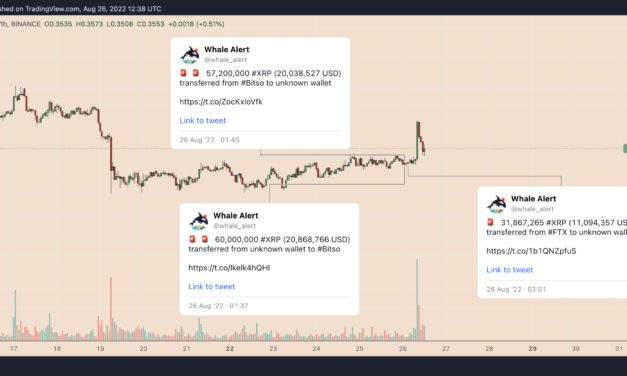
Ripple (XRP) price saw a major spike on Aug. 26, hinting at a possible effect from some big traders.Large XRP transfers, Ripple Swell Global eventNotably, XRP’s price jumped 6% to $0.37, a two-week high, during the early London hours. The token’s upside move occurred hours after its network processed three massive transfers worth $51 million involving crypto exchanges Bitso and FTX, as highlighted by Whale Alert.XRP/USD hourly price chart. Source: TradingViewXRP’s gains also came as a part of a broader upside move that started on Aug. 25, a day after Ripple announced its flagship event, “Ripple Swell Global,” to be held in London in November 2022. The market has seen similar reactions around the Swell event in the past.Bearish reversal setup in playXRP’s intraday spike left behind a “Graveyard Doji,” a bearish reversal candlestick with open, close and low prices near each other with a long upper wick. This candlestick suggests that the price rally witnessed at the beginning of the session was overwhelmed by bears by the end of it.XRP/USD four-hour price chart. Source: TradingViewXRP now trades nearly 4% below its intraday high, testing a support confluence. The confluence comprises the upper trendline of XRP’s previous “ascending triangle” (at $0.35) and the 50-4H exponential moving average (50-4H EMA; the red wave in the chart above) near $0.343.From a technical perspective, a break below the support confluence risks re-triggering the ascending triangle setup, with its profit target at around $0.33. In other words, a 7% price decline by September when measured from today’s price.Related: Ripple CTO lashes back at Vitalik Buterin for his dig at XRPConversely, a rebound after testing the support confluence could have XRP eye a recovery rally toward the $0.36-$0.38 range (marked in red in the chart above). This area served as XRP’s consolidation range in recent months.The views and opinions expressed here are solely those of the author and do not necessarily reflect the views of Cointelegraph.com. Every investment and trading move involves risk, you should conduct your own research when making a decision.
Čítaj viac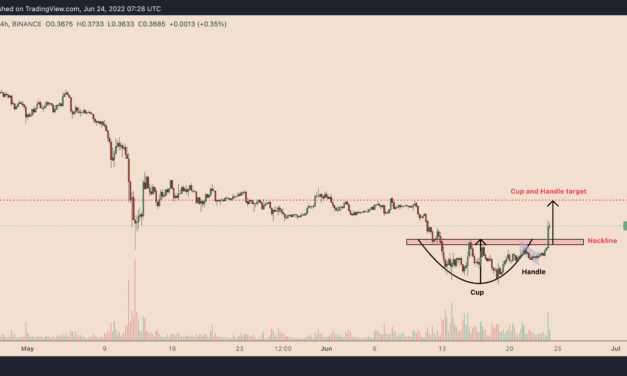
XRP’s ongoing upside retracement risks exhaustion as its price tests a resistance level with a history of triggering a 65% price crash.XRP price rebounds 30% XRP’s price gained nearly 30%, rising to $0.36 on June 24, four days after rebounding from $0.28, its lowest level since January 2021. The token’s retracement rally could extend to $0.41 next, according to its “cup-and-handle” pattern shown in the chart below.XRP/USD four-hour price chart featuring “cup and handle” pattern. Source: TradingViewInterestingly, the indicator’s profit target is the same as XRP’s 50-day exponential moving average (50-day EMA; the red wave).XRP/USD daily price chart featuring 50-day EMA upside target. Source: TradingViewMajor resistance hurdleThe cup-and-handle bullish reversal setup tends to meet its profit target at a 61% success rate, according to veteran analyst Thomas Bulkowski. But it appears XRP’s case falls in the 39% failure spectrum because of a conflicting technical signal presented by its 200-4H exponential moving average (EMA). XRP’s 200-4H EMA (the blue wave in the chart below) has previously served as a strong distribution signal. Notably, in April 2022, the token attempted to break above the said wave resistance multiple times, only to face rejections on each try; it fell 65% to $0.28 later.XRP/USD four-hour price chart featuring 200-4H EMA resistance. Source: TradingViewThe ongoing cup-and-handle breakout has stalled midway after XRP retested the 200-4H EMA as resistance on June 23. Now, the token awaits further bias confirmation while risking a price decline similar to what transpired after April.XRP’s overbought relative strength index (RSI), now above 70, also raises the possibility of an interim price correction.XRP LTF breakdown underwayThe downside scenario on XRP’s shorter-timeframe chart comes in line with giant bearish setups on its longer-timeframe chart. As Cointelegraph covered earlier, XRP has entered a breakdown stage after exiting its “descending triangle” structure in early May. As a rule of technical analysis, its triangle breakdown should have it fall by as much as the structure’s maximum height, which puts its downside target near $1.86.XRP/USD weekly price chart featuring ‘descending triangle’ setup. Source: TradingViewIn other words, another 50% price drop for XRP could happen by the end of July this year. 50,000,000 #XRP (16,249,045 USD) transferred from Ripple to unknown wallethttps://t.co/FalGAzxNxg— Whale Alert (@whale_alert) June 23, 2022Macro risks led by the Federal Reserve’s hawkish policy further strengthen XRP’s bearish bias. The XRP/USD pair has typically traded lower in tandem with riskier assets in 2022, with a correlation coefficient with the Nasdaq Composite sitting at 0.90 as of June 24.XRP/USD weekly correlation with Nasdaq. Source: TradingViewA score of 1 means that the two assets moves in perfect sync.Related: Almost $100M exits US crypto funds in anticipation of hawkish monetary policyConversely, anticipations that Ripple would win the lawsuit filed by the U.S. Securities and Exchange Commission (SEC) for “allegedly” selling unregistered securities could negate the bearish setups. I’ve stated for over a year that many @Ripple and #XRP supporters underestimate the negative impact the SEC lawsuit has had. B/c Ripple has done well outside the U.S. and is hiring, etc., people say otherwise. But XRP must be deemed a non-security in the US to fulfill its promise https://t.co/oBmiTQOWfJ— John E Deaton (203K Followers Beware Imposters) (@JohnEDeaton1) June 22, 2022
That being said, XRP could rebound toward $0.91 by the end of this year if the ongoing retracement continues any further. Interestingly, the token has bounced after testing long-term ascending trendline support, as shown below.XRP/USD weekly price chart. Source: TradingViewThe bounce has also followed XRP’s weekly relative strength index (RSI) decline below 30 — an oversold threshold, which signals a potential buying opportunity. The views and opinions expressed here are solely those of the author and do not necessarily reflect the views of Cointelegraph.com. Every investment and trading move involves risk, you should conduct your own research when making a decision.
Čítaj viac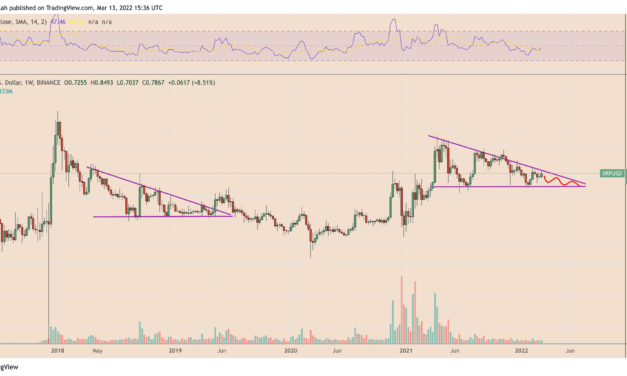
XRP price risks dropping by more than 25% in the coming weeks due to a multi-month bearish setup and fears surrounding excessive XRP supply.XRP descending triangleXRP has been consolidating inside a descending triangle pattern since topping out at its second-highest level to date — near $1.98 — in April 2021. In doing so, the XRP/USD pair has left behind a sequence of lower highs on its upper trendline while finding a solid support level around $0.55, as shown in the chart below.XRP/USD weekly candle price chart. Source: TradingViewIn the week ending March 13, XRP’s price again tested the triangle’s upper trendline as resistance, raising alarms that the coin could undergo another pullback move to the pattern’s support trendline near $0.55, amounting to a drop between 25% and 30%. The downside outlook also takes cues from other bearish catalysts that has emerged around the triangle resistance. For instance, XRP formed a bearish hammer on March 12, a single candlestick pattern with a small body and a long upside wick, suggesting lower buying pressure near the coin’s week-to-date top of around $0.85.XRP/USD daily price chart featuring bearish hammer. Source: TradingViewAdditionally, the price turned lower after testing a confluence of resistances defined by its 20-week exponential moving average (20-week EMA; the green wave) and its 50-week EMA (the red wave), as shown in the attached image below.XRP/USD weekly candle price chart with moving average resistances. Source: TradingViewExcessive supply FUDMore downside cues for XRP come after Ripple Labs locked 800 million XRP in escrow as a part of its programmed schedule for withdrawals.The blockchain payment company moved around 100 million XRP worth nearly $40 million to exchange wallets on March 3. Meanwhile, it kept the other 700 million XRP (worth around $550 million) in an escrow account, raising anticipations that at least 200 million XRP would be flooded into the market to generate funds for Ripple’s operational expenses, as well as to distribute XRP among Ripple’s global clientele.Meanwhile, it kept the other 700 million XRP (worth around $550 million) in an escrow account, raising anticipations that at least 200 million XRP would enter the market to generate funds for Ripple’s operational expenses, as well as to distribute XRP among Ripple’s global clientele.I understood there are some 800 million $XRP that are locked up and ready to be sold…someone should check the increase in circulating supply to verify this— Shyan (@tayshyan) March 12, 2022The selloff fears originated from the XRP price’s earlier response to unexpected supply hikes. For instance, XRP/USD fell by more than 50% to near $0.60 four months after its net supply in circulation increased from 40.46 billion to over 47 billion in just two days.XRP circulating supply. Source: MessariNonetheless, Ripple’s withdrawal of 800 million XRP has not yet been reflected in its net circulating supply.Profit-taking risks mountAnother catalyst that hints XRP’s price could fall 25-30% to reach its descending triangle target is a Santiment indicator that tracks social media trends and their impact on market trends.XRP price versus $XRPNetwork trend. Source: SantimentXRP’s price rose by over 15% week-to-date on March 12, notes Santiment, alongside a large spike in social media searches for the hashtag #XRPNetwork, suggesting that it could follow up with a potential selloff ahead. Excerpts:”Historically, our social trends indicate that profit-taking is justified whenever the crowd makes the #XRPNetwork a top topic.”The views and opinions expressed here are solely those of the author and do not necessarily reflect the views of Cointelegraph.com. Every investment and trading move involves risk, you should conduct your own research when making a decision.
Čítaj viac

