Cointelegraph Markets Pro VORTECS Report Summary — 179% gains from 4 alerts
Cointelegraph Markets Pro’s VORTECS™ Score, NewsQuakes™, Tweet Volume and Most Active On-Chain indicators helped subscribers identify four profitable trades.
Čítaj viac
Cointelegraph Markets Pro’s VORTECS™ Score, NewsQuakes™, Tweet Volume and Most Active On-Chain indicators helped subscribers identify four profitable trades.
Čítaj viac
Before we get into the nitty-gritty of how one simple rule created the kind of insane return on investment noted in the headline — during one of the worst Crypto Winters in recent history — let’s be clear on one thing.You can’t copy this now.But anyone with access to Cointelegraph Markets Pro in 2022 could have. This is not a mere backtested strategy. It’s a real-life strategy — although you’re about to see historical results. This is no longer a thought experiment or proof-of-concept; it is an actual way to make money in crypto trading. For our purposes, it’s also a perfect way to illustrate how a simple strategy can work for real traders in real life — even during extreme market pullbacks. So, let’s dig in. What could you do, right now, today, with this algorithm?What does “Buy 85, Sell 80” mean?Here’s the basic premise. In partnership with data firm The Tie, Cointelegraph Markets Pro has developed the VORTECS™ Score, an algorithmic determination of how bullish or bearish current trading conditions are for a given crypto asset.The score is based on historical data, and it essentially sifts through the whole history of a coin or token looking for conditions that are similar to those it observes right now.It’s looking for a variety of similarities and outliers — for instance, trading volume, recent price action, social sentiment and even the volume of tweets about that asset.If it finds similarities, it looks at what happened next. Did the asset go up or down? How consistent was that movement? How significant was the rise or fall?Combining all of these data points, Markets Pro creates the VORTECS™ Score, a dynamic and constantly evolving evaluation of the current trading conditions for each supported asset. The higher the score, the more bullish the outlook — and the more confident the algorithm is. Conversely, a very low score is bearish (with equal confidence). A neutral score of 50 means the algorithm sees no significant correlation between current conditions and past price performance.The Markets Pro platform offers a whole range of strategies to traders. A “Buy 85, Sell 80” strategy means that a trader can buy an asset that crosses the 85 score, which is considered strongly bullish. And then “sell” the asset once it goes below the score of 80.Of course, this is happening live on an exchange. Or a trader can simply “paper trade” the asset to test the algorithm out. For instance — if Solana’s SOL crossed 85, and was the sole asset with that high score, the trader could place a percentage of their current portfolio into SOL. But if Binance’s BNB then crossed 85 as well, the trader could allocate some other percentage of their portfolio to BNB. Or not. The choice is theirs. So why is this valuable to know?The point here is to evaluate whether the VORTECS™ algorithm is good at its job.When it sees bullish conditions, is it right more often than not? When the score goes up, do prices generally increase? Obviously, the answer is yes.The Buy 85, Sell 80 is only one strategy. There are other strategies that have created a massive return on investment in 2022.For instance, Buy 90, Sell 85. That one is sitting on gains of +96.89% in 2022. Even stronger strategies include:Buy 90, Sell 90 | +159.15%Buy 85, Sell 75 | +102.65%In fact, Bitcoin (BTC) returned -65% since the start of 2022 and Ether (ETH) fared no better with returns of -68% while VORTECS™-based strategies averaged +81.50% across the board beating the pants off BTC and ETH respectively. And that signals that VORTECS™ is working correctly. It is — in general, over time — proving that historical trading conditions for digital assets can be a useful gauge for the current health of that asset.In other words, a high VORTECS™ Score has a proven correlation to price appreciation. Not in every instance, not for every asset… but in general, the results in 2022 have made a compelling case.Warren Buffett (perhaps paraphrasing Georg Wilhelm Friedrich Hegel) once said that “What we learn from history is that people don’t learn from history.”(As a crypto skeptic, he might want to revisit his stance.)That’s what the VORTECS™ Score is all about. Learning from history. And that’s why a real return of 176.31% right in the middle of one of the worst Crypto Winters in the market’s history is important.It tells us we’re looking at the right history.Cointelegraph Markets Pro is available exclusively to members on a monthly basis at $99 per month, or annually with two free months included. It carries a 14-day money-back policy, to ensure that it fits the crypto trading and investing research needs of subscribers, and members can cancel anytime.Cointelegraph is a publisher of financial information, not an investment adviser. We do not provide personalized or individualized investment advice. Cryptocurrencies are volatile investments and carry significant risk including the risk of permanent and total loss. Past performance is not indicative of future results. Figures and charts are correct at the time of writing or as otherwise specified. Live-tested strategies are not recommendations. Consult your financial advisor before making financial decisions.All ROIs quoted are accurate as of 8:00 am UTC on Nov. 17, 2022
Čítaj viac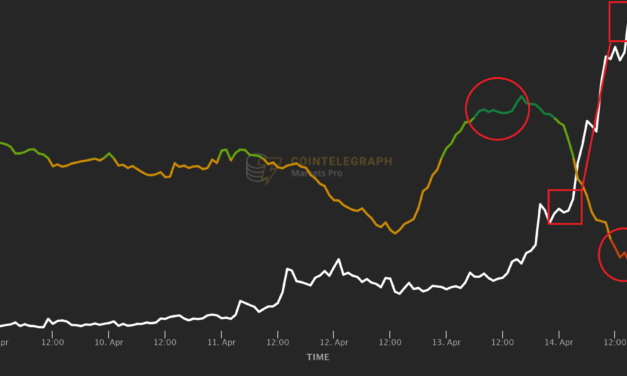
Everybody loves a crypto bull market, but every green wave inevitably gives way to periods of sideways or downward movement.Skilled traders know that these phases of the market cycle can be rife with profit opportunities, too. Anticipating not only a digital asset’s upward price movements, but downturns and corrections can be useful when deciding on when to exit a position and lock in gains, as well helping to add toprofits by shorting crypto assets whose prices decline.In addition to a keen eye and common sense, anticipating price drops can be aided by data intelligence tools. One AI-driven indicator that can help investors see the signs of an upcoming dip early is the VORTECS™ Score, exclusively available to the members of Cointelegraph Markets Pro.Its job is to sift through years’ worth of historical data and identify whether the combination of market and social conditions around each asset looks like those that preceded sharp upward or downward price action in the past.At any given moment, a cryptocurrency token’s high VORTECS™ Score means that its outlook is historically bullish; but low scores below 30 indicate that in the past, the observed patterns were often followed by price drops.Red VORTECS™ Scores are much rarer than dark-green ones. The most common scenario where such scores can be observed is when crypto assets see flash rallies, get overbought, and then see massive corrections.Here are five conspicuous instances of red VORTECS™ Scores flashing on crypto assets before their prices tanked.DOGE: Memecoin gets overheatedVORTECS™ Score (green/red) vs. DOGE price, Apr. 8 – 15. Source: Cointelegraph Markets ProDogecoin (DOGE) presented an instance of very high and very low VORTECS™ Scores following each other closely in the week of Apr. 8.The asset’s score went above 80 on the morning of Apr. 13, when the price curve was still flat at around $0.073 (first red circle). Apparently, the model has sensed a familiar arrangement of celebrity tweets and rising trading volume. Less than 12 hours later, the price line followed suit, pumping all the way to $0.141.Even before the price reached its peak value, however, the algorithm signaled that historically Dogecoin’s rallies were followed by rebounds, as the VORTECS™ Score dipped into the red area below 30. A correction to $0.110 followed in several hours.While the VORTECS™ Score is not designed to tell investors when to go long or short, it can provide a useful indication of historically bullish or bearish conditions for a particular asset — information that can be profitably incorporated into a trading strategy.COTI: Massive spike, hard comedownVORTECS™ Score (green/red) vs. COTI price, Aug. 21 – 27. Source: Cointelegraph Markets ProFollowing a sharp hike from $0.29 to $0.45 within an hour that occurred on Aug. 26, the price of COTI began to succumb to a correction.It quickly dropped to $0.37 and then attempted to gain upside traction again as it rose to $0.42. At this point, the VORTECS™ algorithm recognized similarities between the observed conditions and COTI’s past price corrections, lighting up a red score (red circle in the graph) when the price was still on its way up. The flash was well-placed, within two hours, COTI reversed its course and fell back to around $0.35.NEAR: A dip or second leg up?VORTECS™ Score (green/red) vs. NEAR price, Sept. 5 – 12. Source: Cointelegraph Markets ProBetween Sept. 7 and 9, NEAR Protocol soared from $6.00 to $11.58 within three days. The question on all crypto traders’ minds was: Where will NEAR go next? Several hours after the price peak, the token’s VORTECS™ Score dipped below 30 (red circle in the graph), informing Markets Pro subscribers that historical precedent suggested an imminent decline rather than another leg of the rally.NEAR’s price was at around $11.00 and still going up when its score flashed red; 36 hours later, it was down to $9.00NMR: Red Score at a price peakVORTECS™ Score (green/red) vs. NMR price, Apr. 2 – 8. Source: Cointelegraph Markets ProNumeraire (NMR) was doing great on April 4 and 5, and its price was still headed toward the peak of $78.07 when its VORTECS™ Score dropped below 30 (red circle in the graph). This suggested that in the past NMR’s similar rallies were followed by the price cooling off quickly. Sure enough, the correction kicked in in less than two hours after the lowest Score, NMR’s price sliding back to around $63.00 within the following two days.STX: Green before price rises, red before it dropsVORTECS™ Score (green/red) vs. STX price, Oct. 7 – 14. Source: Cointelegraph Markets ProIn the week of Oct. 8, Stacks (STX) managed to light up both an ultra-low and ultra-high VORTECS™ Scores, all within two consecutive days. On Oct. 9-11, STX had seen a strong rally from $1.44 to $2.29, after which the token’s price began to decline.At that point, the VORTECS™ algorithm recognized a combination of factors that in the past preceded extended corrections, flashing a red score (first circle in the chart). Indeed, STX soon embarked on a downward trajectory for the following 30 hours, dipping all the way back to $1.86.However, in the middle of the pullback, the coin’s VORTECS™ Score went up sharply, reaching a high of 88 against a still-declining price. Apparently, market and social conditions around the coin flipped bullish again as in the past similar massive corrections were followed by even greater upsides.Sure enough, 16 hours after the peak VORTECS™ Score of the week had been registered, STX’s rally resumed toward the week’s high price at $2.39.Cointelegraph Markets Pro’s VORTECS™ Score is available to members here.Disclaimer. Cointelegraph is a publisher of financial information, not an investment adviser. We do not provide personalized or individualized investment advice. Cryptocurrencies are volatile investments and carry significant risk including the risk of permanent and total loss. Past performance is not indicative of future results. Figures and charts are correct at the time of writing or as otherwise specified. Live-tested strategies are not recommendations. Consult your financial advisor before making financial decisions.
Čítaj viac

