Ktoré altcoiny potiahne schválenie spotového ETF? Analytik označil tieto dve
Tento príspevok bol pôvodne publikovaný na stránke...
Čítaj viac
Tento príspevok bol pôvodne publikovaný na stránke...
Čítaj viac
Tento príspevok bol pôvodne publikovaný na stránke...
Čítaj viac
Bitcoin and Ether’s recovery has improved traders’ sentiment, which could trigger buying in ARB, VET, and STX.
Čítaj viac
Tento príspevok bol pôvodne publikovaný na stránke...
Čítaj viac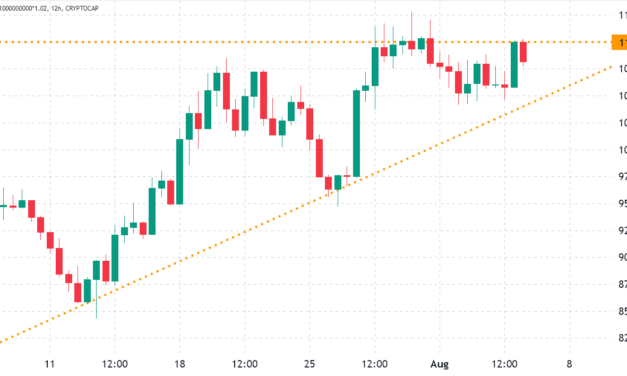
Cryptocurrencies have failed to break the $1.1 trillion market capitalization resistance, which has been holding strong for the past 54 days. The two leading coins held back the market as Bitcoin (BTC) lost 2.5% and Ether (ETH) retraced 1% over the past seven days, but a handful of altcoins presented a robust rally.Crypto markets’ aggregate capitalization declined 1% to $1.07 trillion between July 29 and Aug. 5. The market was negatively impacted by reports on Aug. 4 that the U.S. Securities and Exchange Commission (SEC) is investigating every U.S. crypto exchange after the regulator charged a former Coinbase employee with insider trading.Total crypto market cap, USD billions. Source: TradingViewWhile the two leading cryptoassets were unable to print weekly gains, traders’ appetite for altcoins was not affected. Investors were positively impacted by the Coinbase exchange partnership with BlackRock, the world’s largest financial asset manager, responsible for $10 trillion worth of investments.Coinbase Prime, the service offered to BlackRock’s clients, is an institutional trading solution that provides trading, custody, financing and staking on over 300 digital assets. Consequently, comparing the winners and losers among the top-80 coins provides skewed results, as 10 of those rallied 12% or more over the past seven days:Weekly winners and losers among the top-80 coins. Source: NomicsFLOW rallied 48% after Instagram announced support for the Flow blockchain via Dapper Wallet. The social network controlled by Meta (formerly Facebook) is expanding nonfungible token integration.Filecoin (FIL) gained 38% following the v16 Skyr upgrade on Aug. 2, which hardened the protocol to avoid vulnerabilities.VeChain (VET) gained 16.5% after some news sources incorrectly announced an Amazon Web Services (AWS) partnership. VeChain Foundation explained that the AWS reference was first cited in a May 9 case study.Tether premium deteriorated slightlyThe OKX Tether (USDT) premium is a good gauge of China-based crypto retail trader demand. It measures the difference between China-based peer-to-peer trades and the United States dollar.Excessive buying demand tends to pressure the indicator above fair value at 100%, and during bearish markets, Tether’s market offer is flooded, causing a 4% or higher discount.Tether (USDT) peer-to-peer vs. USD/CNY. Source: OKXCurrently, the Tether premium stands at 98.4%, its lowest level since June 10. While distant from retail panic selling, the indicator showed a modest deterioration over the past week.However, weaker retail demand is not worrisome, as it partially reflects the total cryptocurrency capitalization being down 69% year-to-date.Futures markets show mixed sentimentPerpetual contracts, also known as inverse swaps, have an embedded rate usually charged every eight hours. Exchanges use this fee to avoid exchange risk imbalances.A positive funding rate indicates that longs (buyers) demand more leverage. However, the opposite situation occurs when shorts (sellers) require additional leverage, causing the funding rate to turn negative.Accumulated perpetual futures funding rate on Aug. 5. Source: CoinglassAs depicted above, the accumulated seven-day funding rate is either slightly positive or neutral for the largest cryptocurrencies by open interest. Such data indicates a balanced demand between leverage longs (buyers) and shorts (sellers). Considering the absence of Tether demand in Asia and mixed perpetual contract premiums, there is a lack of confidence from traders as the total crypto capitalization struggles with the $1.1 trillion resistance. So, presently, bears seem to have the upper hand considering the uncertainties caused by the SEC pressing charges against a former Coinbase manager.The views and opinions expressed here are solely those of the author and do not necessarily reflect the views of Cointelegraph. Every investment and trading move involves risk. You should conduct your own research when making a decision.
Čítaj viac
Kali Durgampudi, the CTO of healthcare payments company Zelis, believes that the implementation of blockchain tech is vital for protecting patients’ sensitive data from cybercriminals.Speaking with Health IT News on July 20, Durgampudi noted that some of the biggest issues in healthcare are privacy and data security as the industry works to digitize its “archaic paper-based processes.”“Blockchain technology has the potential to alleviate many of these concerns,” he said, as he highlighted the importance of utilizing a digital ledger that is “impenetrable” to protect sensitive patient and financial data amid the growing rate of cyberattacks across the globe. “Since the information cannot be modified or copied, blockchain technology vastly reduces security risks, giving hospital and healthcare IT organizations a much stronger line of defense against cybercriminals.”Durgampudi went on to note that blockchain tech can also play a key role in healthcare payments, as it can help provide greater transparency and efficiency over current payment models in healthcare. He said the many payers and providers were hesitant to share information via email as emails could go awry and there was no proof of delivery. “Blockchain provides both payers and providers with complete visibility into the entire lifecycle of a claim, from the patient registering at the front desk to disputing a cost to sending an explanation of benefits,” he added. Real world useOne of the major companies that has worked on blockchain-based healthcare solutions is multinational tech giant IBM.The blockchain arm of the company has rolled out several solutions for healthcare such as health credential verification, the ‘Trust Your Supplier’ service to find verified suppliers, and ‘Blockchain Transparent Supply’, which provides supply chain tracking on temperature-controlled pharmaceuticals. In March 2021, Cointelegraph reported that IBM was working on a trial of a COVID-19 vaccination passport dubbed the “Excelsior Pass” in partnership with former New York Governor Andrew Cuomo. The passport was designed to be able to verify an individual’s vaccination or test results by IBM’s blockchain. Related: Blockchain without crypto: Adoption of decentralized techAnother key player in the blockchain-based healthcare space is enterprise blockchain VeChain. In June last year the project teamed up with Shanghai’s Renji Hospital to launch a blockchain-based In-Vitro fertilization (IVF) service application.VeChain also partnered with The Republic of San Marino in July 2021 to launch an NFT-based vaccination passport that was said to be verifiable worldwide by scanning QR codes tied to the certificate. David Jia, who is a blockchain investor and has a Ph.D. in Neuroscience from Oxford University, echoed similar sentiments to Durgampudi this week. In a July 21 blog post on Medium, Jia emphasized that blockchain tech could significantly improve drug traceability and verification, along with the data management of clinical trials, patient info and claiming/billing. “Accuracy in medical records over the long term as well as accessibility is essential, as it is necessary for an individual’s record to be able to be transferred between providers, insurance companies, and specialists with relative ease. If medical records are stored on a blockchain, they may be updated safely in almost real-time,” he wrote.
Čítaj viac
Blockchain logistics firm the VeChain Foundation has signed a multi-year marketing partnership with the Ultimate Fighting Championship (UFC) worth nearly $100 million, becoming the UFC’s first-ever Layer 1 blockchain partner.The UFC is the largest promoter and event organizer for Mixed Martial Arts (MMA) and VeChain’s marketing assets and brand will be integrated across the UFC in live events, in-arena promotion, social media and other areas.The deal is reportedly worth almost $100 million over a minimum five-year partnership according to an anonymous source quoted by Sports Business Journal. The UFC’s Senior Vice President of Global Partnerships Paul Asencio said the UFC’s sponsorship revenues are up 30% from an already record-breaking 2021 as a result of the deal.The partnership kicks off immediately and VeChain’s assets will start appearing this Saturday June 11 during a UFC event held in Singapore.VeChain is a business focused layer 1 ecosystem with an emphasis on supply chain tracking. The partnership sees a big shift from Vechain’s frugal first quarter. A financial report released in May shows the VeChain Foundation only spent around $4 million in Q1 with less than $660,000 spent on marketing but it did amass a huge $1.2 billion “war chest.”VeChain said the partnership is “one of the deepest integrations within premier UFC assets of any sponsor in UFC history,” with the UFC estimating VeChain’s brand will reach 900 million television households in 175 countries.As part of the deal, VeChain will own UFC’s official fighter rankings titleship now called the “UFC Rankings Powered by VeChain” along with a branded presence inside the fighting ring at all events.VeChain will further be promoted in-venue on prominent digital displays and both companies will create content for the UFC’s social media and other digital platforms which the UFC estimates will reach 200 million people.An annual “Brand Ambassador fund” will also offer paid opportunities to UFC athletes participating in marketing activities for VeChain.Related: Blockchain, crypto set to take sports industry beyond NFT collectiblesThe UFC has long partnered blockchain and crypto companies, one of the UFC’s largest partnerships is its $175 million deal with Crypto.com which saw the crypto exchange become the UFC’s “Cryptocurrency Platform Partner” with fighters receiving fan bonuses in Bitcoin (BTC) through the partnership.Crypto.com also released the first authorized UFC non-fungible token (NFT) collection in November 2021 and the UFC has continued to release more licensed NFTs with NFT developer Dapper Labs.In March 2021 the crypto-only casino and sports betting platform Stake become UFC’s “First Official Betting Partner” for its Asia and Latin America markets.
Čítaj viac
Tento príspevok bol pôvodne publikovaný na stránke...
Čítaj viac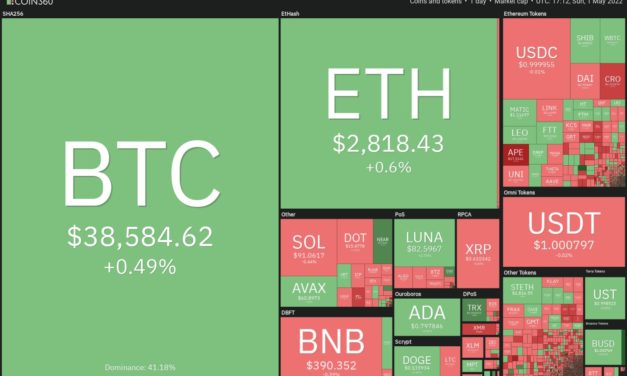
The month of April has been a forgettable one for equities and cryptocurrency investors. Bitcoin (BTC) plummeted 17% in April to record its worst ever performance in the month of April. Similarly, the Nasdaq Composite plunged 13.3% in April, its worst monthly performance since October 2008. However, a major positive for crypto investors is that Bitcoin is still above its year-to-date low near $33,000. In comparison, the Nasdaq 100 has hit a new low for 2022 while the S&P 500 is just a whisker away from making a new year-to-date low. This suggests that Bitcoin has managed to avoid a major sell-off, indicating demand at lower levels. Crypto market data daily view. Source: Coin360Along with Bitcoin, Ether (ETH) has also managed to sustain well above its year-to-date low. According to cryptocurrency intelligence firm Jarvis Labs, both Ether whales and retail fish have been accumulating at lower levels. After surviving the onslaught in April, could Bitcoin start a strong recovery and pull altcoins higher? Let’s study the charts of the top-5 cryptocurrencies that may outperform in the near term.BTC/USDTBitcoin slipped to the support line of the ascending channel on April 30 but the rebound off it today suggests that the bulls are defending the level with all their might.BTC/USDT daily chart. Source: TradingViewAlthough the downsloping 20-day exponential moving average ($39,956) suggests advantage to sellers, the positive divergence on the relative strength index (RSI) indicates that the negative momentum may be weakening.If the rebound sustains, the bulls will attempt to push the price above the 20-day EMA. If they succeed, it will suggest accumulation near the support line. The pair could then rise to the 50-day simple moving average ($41,954).On the contrary, a weak rebound will signal a lack of aggressive buying near the support line. If the price turns down from the current level or the 20-day EMA and breaks below the channel, the BTC/USDT pair could drop to $34,322 and later retest the critical support at $32,917. BTC/USDT 4-hour chart. Source: TradingViewThe 4-hour chart shows that the price has been declining inside a falling wedge pattern. The RSI has formed a positive divergence, indicating that the bearish momentum may be weakening.If the price breaks above the resistance line of the wedge, the pair could pick up momentum and rally to $41,000. This level may again act as a resistance but if bulls clear this hurdle, the next stop could be $43,000.Conversely, if the price turns down from the 20-EMA and breaks below the wedge, the selling could pick up momentum.LUNA/USDTTerra’s LUNA token has been consolidating in an uptrend for the past several days. The price rebounded off the strong support at $75 today, suggesting that the bulls are defending this level aggressively.LUNA/USDT daily chart. Source: TradingViewThe LUNA/USDT pair could now attempt a rally to the 20-day EMA ($88). This level could act as a hurdle where the bears might try to stall the up-move. If the price turns down from the 20-day EMA, it increases the odds of a break below the $75 support.If that happens, the pair will complete a bearish head and shoulders pattern, signaling a potential trend change.Conversely, if bulls propel the price above the 20-day EMA, the pair could again rise to the psychological resistance at $100. The buyers will have to clear this barrier to indicate that the correction may be over.LUNA/USDT 4-hour chart. Source: TradingViewThe price has rebounded off the strong support at $75 and the bulls will now attempt to push the pair above the 20-EMA. If they manage to do that, it will suggest that the selling pressure could be reducing. A break and close above the 50-SMA could indicate that the pair may remain range-bound between $100 and $75 for some time.Contrary to this assumption, if the price turns down sharply from the current level or the 20-EMA, it will suggest that the bears are selling on every minor rally. That could result in a retest of the strong support at $75.NEAR/USDTThe failure of the bulls to push Near Protocol (NEAR) above $18 resulted in a sharp decline in the past few days. The price slipped to the psychological support at $10 on April 30 but the strong rebound today indicates aggressive buying by the bulls.NEAR/USDT daily chart. Source: TradingViewIf buyers thrust the price above the 200-day SMA ($11.94), it will suggest that the decline to $10 may have been a bear trap. The NEAR/USDT pair could then rise to the 20-day EMA ($13.86) where the bears may again try to stall the recovery. The bulls will have to clear this hurdle to signal that the corrective phase may be over. That could start a rally toward the strong overhead resistance at $18.Contrary to this assumption, if the price turns down from the 200-day SMA, the likelihood of a break below $10 increases. If that happens, the pair could extend its correction to $9.30 and later to $8.NEAR/USDT 4-hour chart. Source: TradingViewThe bounce has risen above the 20-EMA which is the first sign of strength. If buyers sustain the price above the 20-EMA, the pair could rally to the 50-SMA. A break and close above this level will suggest that the short-term downtrend could be over.Conversely, if bulls fail to sustain the price above the 20-EMA, it will indicate that bears continue to sell on rallies. The bears will then make one more attempt to pull the pair below the strong support at $10 and resume the decline.Related: ApeCoin slides 40% in three days despite Otherside metaverse land sale — here’s whyVET/USDTVeChain (VET) has been consolidating in a large range between $0.043 and $0.083 for the past many days. The price reached the support of the range which has acted as a strong floor on three previous occasions.VET/USDT daily chart. Source: TradingViewThe bounce off the $0.043 support today suggests that the buyers are defending the level with vigor. If the buying momentum sustains and the price rises above the 20-day EMA ($0.055), it will suggest that the VET/USDT pair may stay in the range for a few more days.Alternatively, if the price turns down from the current level or the 20-day EMA, it will indicate that demand dries up at higher levels. The bears will then attempt to sink the pair below the range. If they can pull it off, the pair may resume its downtrend and decline to $0.034.VET/USDT 4-hour chart. Source: TradingViewThe price has rebounded off the strong support at $0.043 and the bulls will now try to push the pair above the 20-EMA. If they succeed, it will suggest that the bears may be losing their grip. The pair could then rise to the 50-SMA. A break and close above this level could clear the path for a possible rally to $0.065.Conversely, if the price turns down from the 20-EMA, it will suggest that bears are selling on rallies to strong resistance levels. The bears will then attempt to pull the pair below the strong support at $0.043 and extend the decline.GMT/USDTSTEPN (GMT) has been correcting in an uptrend. A positive sign is that the bulls have not allowed the price to break below the 20-day EMA ($3.13). This suggests that the sentiment remains positive and bulls are buying on dips.GMT/USDT daily chart. Source: TradingViewThe buyers will now try to push the price to the overhead resistance at $4.17. If buyers clear this hurdle, the GMT/USDT pair may resume its uptrend. The pair could then attempt a rally to the psychological level at $5.The upsloping 20-day EMA signals advantage to buyers but the RSI has been forming a negative divergence suggesting that the bullish momentum may be weakening.If the price turns down and breaks below the 20-day EMA, the selling could intensify. The pair may then decline to the 50-day SMA ($2.08).GMT/USDT 4-hour chart. Source: TradingViewThe bears tried to sustain the price below the 50-SMA but failed. This suggests strong demand at lower levels. If bulls push the price above the 20-EMA, it will indicate that the selling pressure may be reducing. The pair could then retest the all-time high at $4.17.Conversely, if the price turns down from the 20-EMA, it will suggest that bears are active at higher levels. The sellers will then again try to pull the pair below the 50-SMA. If they manage to do that, the pair may slide to the strong support at $3. The views and opinions expressed here are solely those of the author and do not necessarily reflect the views of Cointelegraph. Every investment and trading move involves risk, you should conduct your own research when making a decision.
Čítaj viac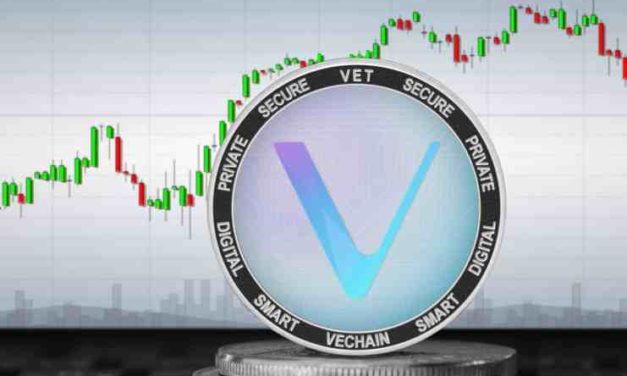
Tento príspevok bol pôvodne publikovaný na stránke...
Čítaj viac
Supply chain blockchain project VeChain has announced a new partnership with crypto payment services, Alchemy Pay that will allow people to use its VET token as payment in over 2 million stores throughout 70 different countries.The news came alongside its inclusion as a supported token on the recently launched Binance Bridge 2.0.Thanks to partner @AlchemyPay, $VET can now be used to buy goods at 2 million+ stores globally!Using our advanced low-#carbon #blockchain, transactions cost fractions of a cent & are processed in seconds from any #VeChain wallet!$ACH #DeFi $VTHO #Web3https://t.co/ceeHRpcbKT— VeChain Foundation (@vechainofficial) April 27, 2022VeChain was included in the first group of tokens to be supported on the new Binance Bridge 2.0. The Binance Bridge 2.0 provides a new way to bridge tokens from Ethereum to be used on the BNB Chain — formerly known as the Binance Smart Chain. The other bridged tokens include SAND, APE, JASMY, MANA, PEOPLE, MBL, LOOKS and ELON. And if that wasn’t enough, VeChain also announced on Thursday that it has joined the Blockchain Infrastructure Alliance (BIA), an organization that links together industry experts and provides funding for blockchain-related research projects.Sunny Lu, CEO of VeChain, spoke warmly about the new affiliation with the BIA.“By working together with this group of leading blockchains we can develop understanding and mutually support each other to lift the industry as a whole.”VeChain is a supply chain tracking system that launched in 2015 and combines physical tracking with blockchain record keeping. VeChain currently works with a diverse range of organizations to provide logistics and supply chain-focused tracking solutions.VeChain leverages a Proof of Authority (PoA) consensus mechanism which has 101 master nodes and functions by verifying identities and reputations, instead of staking or mining. Related: Alchemy Pay Partners with Global Payments Provider Checkout.comThe recent announcements did little to move the price of VET, with the token posting a temporary gain of 4% before falling back to pre-announcement prices and trading sideways from there. VET is currently trading for $0.051 according to TradingView at the time of writing.
Čítaj viac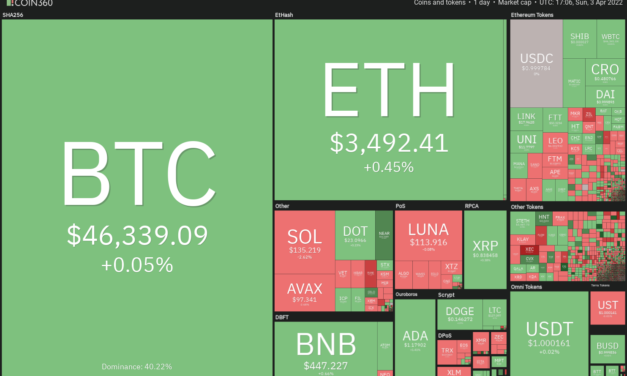
Bitcoin (BTC) is attempting to hold above its closest support level and traders are watching to see if the price can remain strong and close above the 2022 yearly open price at $46,200 for the second week in a row.April has historically been the best performing month of the year for the S&P 500, according to Sam Stovall, chief investment strategist at CFRA. If history repeats itself and the close correlation between the U.S. equity markets and Bitcoin continues, it could bode well for the crypto markets in the near term.Crypto market data daily view. Source: Coin360Another sentiment booster could be that the 19th million Bitcoin entered circulation on April 1. For the remaining 2 million Bitcoin, the crypto markets will have to wait for a long time because the last Bitcoin is expected to be mined by 2140. This could shift focus on how only a small quantity of Bitcoin is left to be mined and its growing demand could lead to scarcity and boost prices higher.Could Bitcoin hold above its critical support and if it does, will altcoins rally? Let’s study the charts of the top-5 cryptocurrencies that may extend their recovery in the short term.BTC/USDTBitcoin is witnessing a tough tussle between the bulls and the bears near the important level at $45,400. The bears tried to pull and sustain the price below this level but the bulls held their ground. This suggests that the bulls are attempting to flip the level into support.BTC/USDT daily chart. Source: TradingViewThe upsloping 20-day exponential moving average ($44,333) and the relative strength index (RSI) in positive territory indicate the path of least resistance is to the upside. The critical level to watch on the upside is the 200-day simple moving average ($48,276). If bulls thrust the price above this barrier, the BTC/USDT pair is likely to pick up momentum. The rally could face minor resistance at the psychological level at $50,000 but if this level is crossed, the next stop could be $52,000.Contrary to this assumption, if the price turns down from the current level or the overhead resistance, the bears will again try to pull the pair below $45,400 and the 20-day EMA. If that happens, the pair could drop to the 50-day SMA ($41,615). BTC/USDT 4-hour chart. Source: TradingViewThe 4-hour chart shows that the price has been correcting since hitting the resistance line of the ascending channel. Recovery attempts by the bulls are facing stiff resistance at the downtrend line. If bulls push and sustain the price above the downtrend line, the pair could rise to the resistance line of the channel.A break and close above the channel could signal the resumption of the uptrend. Alternatively, if the price turns down from the downtrend line, the bears will attempt to sink the pair to $44,000. If this level cracks, the decline may extend to $42,594.VET/USDTVeChain (VET) surged above the overhead resistance at $0.07 on March 27 but the bears stalled the recovery at the 200-day SMA ($0.09). A minor positive is that the bulls have not allowed the price to slide below the breakout level at $0.07.VET/USDT daily chart. Source: TradingViewIf the price turns up from the current level, the bulls will make one more attempt to clear the overhead hurdle at the 200-day SMA. If they manage to do that, it will suggest a possible change in trend. The VET/USDT pair could then rally to $0.10 and later to $0.13.The rising 20-day EMA ($0.06) and the RSI in the positive territory indicate advantage to buyers. This bullish view will invalidate if the price turns down and breaks below the 20-day EMA. Such a move could pull the pair to the 50-day SMA ($0.05).VET/USDT 4-hour chart. Source: TradingViewThe 20-EMA has flattened out and the RSI is near the midpoint on the 4-hour chart, indicating a balance between supply and demand. If the price breaks above $0.08, the bulls will attempt to propel the pair above $0.09. If they do that, the pair could extend its up-move.Conversely, if the price turns down and breaks below the 50-SMA, the pair could drop to the critical level at $0.07. If bulls flip this level into support, the pair will again try to rise above $0.09 but if the support at $0.07 cracks, the bears may be back in the game.THETA/USDTTheta Network’s THETA token has been range-bound between $2.50 and $4.40 for the past several weeks. The bulls attempted to push the price above the overhead resistance but failed. This suggests that the bears continue to defend the level aggressively.THETA/USDT daily chart. Source: TradingViewIf the price does not break below $3.80, it will suggest that traders are not closing their positions in a hurry as they expect the up-move to continue. The upsloping 20-day EMA ($3.54) and the RSI near the overbought zone indicate that the path of least resistance is to the upside.If buyers drive the price above the overhead zone between $4.40 and the 200-day SMA ($4.77), it will signal the start of a possible uptrend. The THETA/USDT pair could then pick up momentum and rally to $6.Contrary to this assumption, if the price slides below the 20-day EMA, the next stop could be the 50-day SMA ($3.17). Such a move will suggest that the pair may remain range-bound for a few more days.THETA/USDT 4-hour chart. Source: TradingViewThe 4-hour chart shows that the bears have repeatedly thwarted attempts by the bulls to thrust the price above the overhead resistance at $4.40. The 20-EMA has flattened out and the RSI is near the midpoint, indicating a balance between supply and demand.If the price slips below the 50-SMA, the short-term advantage could tilt in favor of the sellers. The price could then drop to $3.50. On the other hand, the bulls will gain the upper hand if the price breaks and sustains above the overhead resistance.Related: Trezor investigates potential data breach as users cite phishing attacksRUNE/USDTTHORChain (RUNE) has been trading inside a large descending triangle pattern for several months. The sharp rally of the past few days pushed the price to the downtrend line of the triangle where the bears are mounting a strong resistance.RUNE/USDT daily chart. Source: TradingViewIf the price turns down from the current level, the RUNE/USDT pair could drop to the 20-day EMA ($9.75). This is an important level to watch out for because if the price rebounds off the 20-day EMA, it will suggest that the sentiment remains positive and traders are buying on dips.That may enhance the prospects of a break above the downtrend line. If that happens, the bearish triangle setup will invalidate, which could be a bullish sign. The pair may then rally to $17.This bullish view will be negated in the short term if the price turns down and breaks below the 20-day EMA. That could pull the pair down to the 200-day SMA ($7.88). RUNE/USDT 4-hour chart. Source: TradingViewThe 4-hour chart shows that the pair is facing strong resistance near $13. A minor positive is that the bulls have not allowed the price to dip and sustain below $11. Therefore, this becomes an important level to keep an eye on.If the price breaks below this support, the pair could drop to the next major support at $10. Conversely, if the price rebounds off $11, the buyers will again try to resume the uptrend by driving the pair above the overhead resistance.AAVE/USDTAave (AAVE) broke out of the downtrend line on March 29 which indicated a potential change in trend. The bears tried to stall the recovery at the 200-day EMA ($226) but the bulls did not give up much ground.AAVE/USDT daily chart. Source: TradingViewThe buying resumed on April 1 and the AAVE/USDT pair broke above the 200-day SMA. If the price sustains above the 200-day SMA, it will signal the start of a new up-move. If bulls drive the price above $262, the rally may extend to the psychological level at $300. The bears may mount a stiff resistance at this level but if bulls overcome this barrier, the up-move could reach $350.This bullish view will invalidate in the short term if the price turns down and plummets below the 200-day SMA. The bears could then pull the price to the 20-day EMA ($187).AAVE/USDT 4-hour chart. Source: TradingViewThe 4-hour chart shows that the bulls are buying the dips to the 20-EMA. If bulls push the price above $261.20, the uptrend could resume. This rally could face resistance in the overhead zone between $283 and $300.The RSI is showing signs of a negative divergence, indicating that the bullish momentum may be weakening. If the price turns down and breaks below the 20-EMA, it will suggest that the short-term bulls may be booking profits. That could sink the pair to the 50-SMA.The views and opinions expressed here are solely those of the author and do not necessarily reflect the views of Cointelegraph. Every investment and trading move involves risk, you should conduct your own research when making a decision.
Čítaj viac

