Značka: Trading101

3 ways to trade Bitcoin and altcoins during a bear market

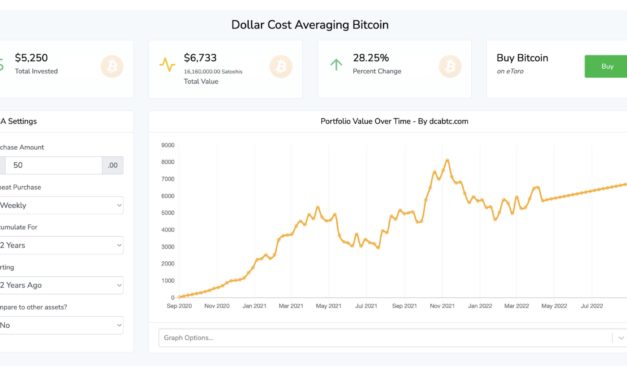
Markets are scary right now, and while the situation is likely to worsen, it doesn’t mean investors need to sit out and watch from the sidelines. In fact, history has proven that one of the best times to buy Bitcoin (BTC) is when no one is talking about Bitcoin.Remember the 2018–2020 crypto winter? I do. Hardly anyone, including mainstream media, was talking about crypto in a positive or negative way. It was during this time of prolonged downtrend and lengthy sideways chop that smart investors were accumulating in preparation for the next bull trend. Of course, nobody knew “when” this parabolic advance would take place, but the example is purely meant to illustrate that crypto might be in a crab market, but there are still great strategies for investing in Bitcoin. Let’s take a look at three. Accumulation via dollar-cost averagingIt’s helpful to be price agnostic when it comes to investing in assets over the long term. A price agnostic investor is immune to fluctuations in value and will identify a few assets that they believe in and continue to add to the positions. If the project has good fundamentals, a strong, active use case and a healthy network, it makes more sense to just dollar-cost average (DCA) into a position.Take, for example, this chart from DCA.BTC. Results of weekly dollar cost averaging into Bitcoin. Source: DCA.BTCInvestors who auto-purchased $50 in BTC weekly over a two-year span are still in profit today, and by DCA, there is no need to make trades, watch charts, or subject oneself to the emotional stress that is associated with trading. Trade the trend and go long off extreme lowsAside from steady, reasonably sized dollar-cost averaging, investors should be building a war chest of dry powder and just sitting on their hands waiting for generational buying opportunities. Entering the market when it’s deeply oversold and all metrics are in extreme is typically a good place to open spot longs but with less than 20% of one’s dry powder. When assets and price indicators are two or more standard deviations away from the norm, it’s time to start looking around. Some traders zoom out to a three-day or weekly time frame to see when assets correct to higher time frame support levels or previous all-time highs as a sign to invest. 200-week moving average heatmap for Bitcoin. Source: LookIntoBitcoinOthers look for price to flip key moving averages like the 118 DMA, 200 WMA and 200 DMA back to support. On-chain fanatics typically follow the Puell Multiple, MVRV Score, Bitcoin Pi indicator or Realized Price indicator to see when extreme multi-year lows are hit as a sign of when to buy. Either way, opening spot longs during extreme sell-offs usually turns out to be a good swing trade or even entry point for a multi-year-long position. Related: Wen moon? Probably not soon: Why Bitcoin traders should make friends with the trendDo nothing, until the trend changesTrading during a bear market is hard, and capital and portfolio preservation are the top priorities. For this reason, it’s best for some investors to just wait for confirmation of a trend change. As the saying goes, “the trend is your friend.” Everyone is a genius and a superb trader during a bull market, so if that was you, then wait for the next bull trend to roll around and go be a happy-go-lucky genius then. Downtrends, consolidation and bear markets are notorious for chopping up traders and reducing one’s portfolio size, so it’s unwise to trade against the trend unless one has a PNL positive method for trading during bear trends and some skill at shorting. For crypto investors, it’s important not to live in a vacuum and keep an eye on the equities markets. Crypto traders have a tendency to only focus on crypto markets, and this is a mistake because equities markets and BTC and Ether (ETH) prices have shown a strong correlation in the past two years. In one’s charting suite of choice, it would be wise to keep the S&P 500, Dow Jones or Nasdaq charts up alongside BTC’s or ETH’s daily chart. Bitcoin correlation to equities markets. Source: TheBlockIn the most recent trend reversal, BTC’s price action was the canary in the coal mine that began to chirp louder and louder as the United States Federal Reserve amplified its intent to raise interest rates. It is easy to be misled by the minuscule moves that occur in Bitcoin’s four-hour and daily price charts, and one could easily be lured into some hefty positions based on the belief that BTC is on the verge of a reversal. Keeping an eye on the market structure and price action of the largest equities indexes will provide crucial insight into the strength and duration of any bullish or bearish trend that Bitcoin might exhibit. This newsletter was written by Big Smokey, the author of The Humble Pontificator Substack and resident newsletter author at Cointelegraph. Each Friday, Big Smokey will write market insights, trending how-tos, analyses and early-bird research on potential emerging trends within the crypto market.Disclaimer. Cointelegraph does not endorse any content of product on this page. While we aim at providing you all important information that we could obtain, readers should do their own research before taking any actions related to the company and carry full responsibility for their decisions, nor this article can be considered as an investment advice.

Čítaj viac

Pro traders may use this ‘risk averse’ Ethereum options strategy to play the Merge

Ether (ETH) is reaching a make-it or break-it point as the network moves away from proof-of-work (PoW) mining. Unfortunately, many novice traders tend to miss the mark when creating strategies to maximize gains on potential positive developments.For example, buying ETH derivatives contracts is a cheap and easy mechanism to maximize gains. The perpetual futures are often used to leverage positions, and one can easily increase profits five-fold.So why not use inverse swaps? The main reason is the threat of forced liquidation. If the price of ETH drops 19% from the entry point, the leveraged buyer loses the entire investment.The main problem is Ether’s volatility and its strong price fluctuations. For example, since July 2021, ETH price crashed 19% from its starting point within 20 days in 118 out of 365 days. This means that any 5x leverage long position will have been forcefully terminated.How pro traders play the “risk reversal” options strategyDespite the consensus that crypto derivatives are mainly used for gambling and excessive leverage, these instruments were initially designed for hedging.Options trading presents opportunities for investors to protect their positions from steep price drops and even profit from increased volatility. These more advanced investment strategies usually involve more than one instrument and are commonly known as “structures.”Investors rely on the “risk reversal” options strategy to hedge losses from unexpected price swings. The holder benefits from being long on the call (buy) options, but the cost for those is covered by selling a put (sell) option. In short, this setup eliminates the risk of ETH trading sideways but it does carry a moderate loss if the asset trades down.Profit and loss estimate. Source: Deribit Position BuilderThe above trade focuses exclusively on the Aug. 26 options, but investors will find similar patterns using different maturities. Ether was trading at $1,729 when the pricing took place.First, the trader needs to buy protection from a downside move by buying 10.2 ETH put (sell) $1,500 options contracts. Then, the trader will sell 9 ETH put (sell) $1,700 options contracts to net the returns above this level. Finally, the trader should buy 10 call (buy) $2,200 options contracts for positive price exposure.It is important to remember that all options have a set expiry date, so the asset’s price appreciation must happen during the defined period.Investors are protected from a price drop below $1,500That options structure results in neither a gain nor a loss between $1,700 and $2,200 (up 27%). Thus, the investor is betting that Ether’s price on Aug. 26 at 8:00 am UTC will be above that range, gaining exposure to unlimited profits and a maximum 1.185 ETH loss.If Ether’s price rallies toward $2,490 (up 44%), this investment would result in a 1.185 ETH net gain—covering the maximum loss. Moreover, a 56% pump to $2,700 would bring an ETH 1.87 net profit. The main benefit for the holder is the limited downside.Even though there is no cost associated with this options structure, the exchange will require a margin deposit of up to 1.185 ETH to cover potential losses.The views and opinions expressed here are solely those of the author and do not necessarily reflect the views of Cointelegraph. Every investment and trading move involves risk. You should conduct your own research when making a decision.

Čítaj viac

Here’s how pro traders use Bitcoin options to profit even during a sideways market

Bitcoin (BTC) price swings might be impossible to predict, but there is a strategy frequently used by pro traders that yields high returns with minimal cost.Typically, retail traders rely on leveraged futures positions which are highly susceptible to forced liquidations. However, trading Bitcoin options provide excellent opportunities for investors aiming to maximize gains while limiting their losses. Using multiple call (buy) options can create a strategy capable of returns six times higher than the potential loss. Moreover, these can be used in bullish and bearish circumstances, depending on the investors’ expectations.The regulatory uncertainty surrounding cryptocurrencies has long been a significant setback for investors and this is another reasons why neutral market strategies have drawn traders’ attention since Bitcoin’s rally stagnated near $47,000 on March 30.How to profit in a sideways marketThe long butterfly strategy allows a trader to profit even if Bitcoin’s price remains flat. However, it’s important to remember that options have a set expiry date. This means the desired price outcome must happen during a specified period.The Bitcoin options were set for the April 29 expiry, but this strategy can also be used on Ether (ETH) options or a different time frame. At the time of writing, Bitcoin was trading at $47,370 and although the costs will vary, their general efficiency should not be affected.Profit / Loss estimate. Source: Deribit Position BuilderThe suggested bullish strategy consists of buying 7.3 BTC call (buy) options with a $46,000 strike to benefit from a price increase. Meanwhile, selling 16 BTC call (buy) options at 50,000 creates a negative exposure above that level. The trader should buy 4.8 BTC worth of $52,000 call options and 3.9 BTC at $55,000, balancing out the risk above this price.The gains can be four times higher than the potential lossAs the estimate above shows, any outcome between $46,700 (down 1.5%) and $53,500 (up 12.9%) yields a net gain. The best possible outcome happens at $50,000 and results in a 0.47 BTC net gain. Meanwhile, this strategy’s maximum loss is 0.11 BTC if the price on April 29 trades below $46,000 or above $55,000.The allure of this butterfly strategy is the trader can secure gains that are 6 times larger than the maximum loss. Overall it yields a much better risk-reward versus leveraged futures trading, considering the limited downside.This options strategy trade provides upside even if Bitcoin’s price remains flat and the only upfront fee required is 0.11 BTC, which also reflects the maximum loss.The views and opinions expressed here are solely those of the author and do not necessarily reflect the views of Cointelegraph. Every investment and trading move involves risk. You should conduct your own research when making a decision.

Čítaj viac

Here’s how traders capitalize on crypto market crashes and liquidations

The first week of the new year saw a vicious pullback across all cryptocurrencies in the market. Ether (ETH) price dropped from its November peak at $4,800 peak to under $3,000 on Jan. 8 and Terra’s LUNA governance token also dropped from $85 on Dec. 31 to $67 on Jan. 8, 2022. These unexpected dramatic moves often cause liquidation cascades in the lending market, but they also create unique buying opportunities in the collateral liquidation markets.Kujira’s Orca protocol is a platform built on the Terra network and it allows investors to bid on bETH (bonded asset of Ether) and bLUNA (bonded asset of LUNA) at a discounted price when the at-risk collateral is liquidated. As a pseudonymous analyst at Kujira pointed out,“Liquidation has for so long been the ‘shady underbelly’ of lending platforms and monopolised by bots so much that the average user barely knows it’s going on, least of all how they could benefit from it”. Kujira allows anyone to participate in the liquidation process by grasping the opportunity to acquire these assets at a discounted price.In the recent crash on Jan. 8, the lowest price one could buy Ether (in its bonded asset bETH form) was $2,833, while the market price of Ether was around $3,000. Similarly, traders could buy bLUNA as low as $58.90 while LUNA’s spot price was around $67.Liquidation stats from Kujira. Source: TwitterLet’s take a closer look at the strategies for acquiring bETH and bLUNA at a discount during a market crash.Market structure provides unique opportunities to buy at a discountIn the Terra ecosystem, participants can borrow Terra USD (UST), the stablecoin of the Terra blockchain, from DeFi protocols such as Anchor to participate in high-yield liquidity pools, IDOs or any other profitable trading activities involving UST. In order to borrow UST, participants need to deposit bonded assets (bETH or bLUNA) as collateral to Anchor. The maximum amount each wallet can borrow is 60% of the collateral value, often referred to by DeFi protocols as the maximum LTV (loan-to-value).In a bull market where Ether and LUNA prices are on the rise, the LTV continues to decrease and no collateral is at risk. When the price of Ether or LUNA goes down, the collateral value decreases and if the LTV exceeds 60%, a liquidation event is triggered. This alerts Anchor to sell the proportion of the collateral that exceeds the maximum LTV at a discounted fire-sale price on Kujira Orca. This is where potential buyers on the other side of the trade can buy the collateral at a discount.How to capitalize on pricing anomalies in ETH and LUNAHere are some simple steps investors can follow if they want to purchase Ether or LUNA at a discount.After connecting the Terra wallet to the platform, an investor chooses the asset they would like to bid (currently only bLUNA and bETH are available), then selects the premium (the percentage of discount from spot) to receive.After clicking “Place My Bid” to submit the bid, the investor will see the “My Bids” window. It takes 10 minutes for the bid to be ready, and afterward, the investor needs to click “Activate” to include the bid in the bidding queue. Once the bid has been filled, the amount will be shown in the “Available for Withdrawal”’ window. The investor then needs to click withdraw and pay a fee to transfer the asset back to their Terra wallet.Kujira Orca home page demo. Source: Kujira LitepaperThere are three important things to remember when placing the bid:1. If the investor is not using KUJI (the native token of Kujira) to pay for the withdrawal fee, they should always place a premium (discount) percentage larger than 1%, as there is a network fee of 2 UST and a 1% commission fee. If using KUJI, the commission is only 0.5%.2. If there are multiple bids at different discounted rates, the investor should activate them all at once to save network fees.3. The bids are filled equally and proportionally between everyone bidding at the same discounted rate. There is no first-come, first-serve advantage or larger bids that get a filled-first advantage. The only sequence in which the bids are filled is based on the discounted rate — i.e., the lower-discount pool gets filled first. The mechanism of evenly distributing liquidation assets among each bidder ensures the fairest allocation to everyone. Ryan Park, co-builder of Anchor Protocol, said in an interview about Orca:“By evenly distributing the proceeds of liquidations amongst a greater majority, collateral isn’t going into a centralised point but back into the hands of other users. The implications are staggering and quite frankly, I don’t think enough attention has been given to just how big this is.”The example below shows that when there is a 100,000 UST liquidation to be executed, the 1% discount pool (61,000 UST in total) is filled first and the pool is fully emptied. The remaining 39,000 UST is subsequently passed onto the 2% discount pool to fill the bids. Each wallet in each pool receives a proportion of the allocated liquidation amount based on the size of their total bidding offer in the pool. It is a completely fair distribution with no priority given to the quickest clicker or the largest bidder.Example of 100,000 UST liquidation in 1% and 2% pools.Identifying the best time to buyFigure1: Number of liquidated borrowers vs. ETH price. Source: Kujira Orca, Flipside CryptoAs shown in Figure 1 and Figure 2, the best time to bid is when there is a dramatic drop in collateral asset price and many borrowers’ LTV goes below the 60% maximum level. This creates an increase in the number of liquidations (blue and purple line in Figure 1) and also the supply of liquidation assets on the platform (blue and purple bar in Figure 2).Figure 2: Liquidated amount in USD vs. LUNA price. Source: Kujira Orca, Flipside CryptoThe worst case scenario — in terms of number of liquidated borrowers — coincides with the time when bLUNA and bETH prices dropped significantly. The liquidation amount also spiked in early December 2021 and early January 2022 when Ether and LUNA prices breached major support levels as shown in Figure 2.These sudden rises in liquidation create unique opportunities for investors to purchase bLUNA and bETH at a great discount. As shown in the chart below (Figure 3), in the December LUNA crash, bidders could purchase bLUNA at a 11% to 12% discount on Kujira Orca at the peak. Figure 3: bLUNA liquidated amount in USD vs. purchase discount. Source: Kujira OrcaSimilarly (shown in Figure 4), when Ether price dropped from the $4,600 level to $4,100 on Nov. 16, bidders were able to purchase bETH at a 11% discount at around $3,700. Figure 4: bETH liquidated amount in USD vs. purchase discount. Source: Kujira OrcaLooking into the average discount bidders received in the past three months, it is very interesting to see most of the liquidations happened in the very high discount group (9 to 10%, or more than 10%) for November and December 2021. In January 2022, the concentration seems to have moved to the 6% to 7% discount bucket. However, January’s data is incomplete and only available until Jan. 10 at the time of writing. This means the concentration in the 6% to 7% bucket is only a reflection of the drop early in the year and could still change for the rest of the month.Discount bucket comparison for the past 3 months — January data is only until Jan.10. Source: Kujira OrcaTraders can earn while they waitThe historical discount data clearly shows that investors can buy bETH and bLUNA at a discount as high as 9% or 10% away from the market price but the bids might take a long time to get filled. Luckily, there will soon be a way to keep earning interest from UST while waiting for the bids.Investors can simply deposit UST to Anchor’s Earn and accrue interests at the current rate of 19% APY; and use the aUST token they receive as the IOU token to bid liquidation assets on Kujira Orca. This way, one keeps accruing interest until the bid is filled on Kujira and the aUST is converted to UST for the liquidation purchase.** Special thanks to Hans from Kujira for providing the data and insights needed to complete the article.The views and opinions expressed here are solely those of the author and do not necessarily reflect the views of Cointelegraph.com. Every investment and trading move involves risk, you should conduct your own research when making a decision.

Čítaj viac

Altcoin Roundup: 3 metrics that traders can use to effectively analyze DeFi tokens

Much to the chagrin of cryptocurrency proponents who call for the immediate mass adoption of blockchain technology, there are many “digital landmines” that exist in the crypto ecosystem such as rug pulls and protocol hacks that can give new users the experience of being lost at sea. There’s more to investing than just technical analysis and gut feelings. Over the past year, a handful of blockchain analysis platforms launched dashboards with metrics that help provide greater insight into the fundamentals supporting — or the lack thereof — a cryptocurrency project. Here are three key factors to take into consideration when evaluating whether an altcoin or decentralized finance (DeFi) project is a sound investment.Check the project’s community and developer activityOne of the basic ways to get a read on a project is to look at the statistics that show the level of activity from the platform’s user base and developer community.Many of the top protocols in the space offer analytics that track the growth in active users over time. On-chain dashboards like Dune Analytics offer more granular insights into this metric such as the following chart showing the daily new users on the Olympus protocol. Olympus daily new users. Source: Dune AnalyticsOther pertinent data points to consider when it comes to evaluating community activity include the average number of active wallets on a daily, weekly and monthly basis. Investors should also look at the number of transactions and volumes transacted on the protocol, as well as social media metrics such as Twitter mentions that can help with gauging investors’ sentiment about a particular project.Alert systems like Cointelegraph Markets Pro provide up-to-date notifications on a project’s Twitter mention volumes and unusual changes in trading volume that can be an early sign that a cryptocurrency is turning bullish or bearish. CT Markets Pro twitter and trading volume dashboard. Source: Cointelegraph Markets ProRegarding project development and developer activity, GitHub has been the go-to place for learning about upcoming upgrades, integrations and where the project is in its roadmap.If a protocol is boasting about “soon to be released” features but showing little ongoing development or commits being submitted, it might be a sign to steer clear until the activity is better aligned with the claims.On the other hand, spotting an under-the-radar project with steady development activity and a committed user base could be a positive sign. Look for steady increases in total value lockedA second metric to look at when assessing the overall strength of a project is the sum of all assets deposited on the protocol, otherwise known as the total value locked (TVL). For example, data from Defi Llama shows that the total value locked on the DeFi protocol DeFiChain (DFI) has been rising lately following a major protocol upgrade, with the TVL hitting new all-time highs on several days so far in December. This signals that momentum and interest in the project are increasing.Total value locked on DeFiChain. Source: Defi LlamaDeFi aggregators like Defi Llama and DappRadar allow users to dive deeper into the data and look at the statistics for different blockchain networks such as the TVL on the Ethereum Network or Binance Smart Chain, as well as by individual projects like Curve and Trader Joe. Protocols with a higher TVL tend to be more secure and trusted by the community, while projects that rank lower on the list generally carry more risk and tend to have less active communities.Related: Point of no return? Crypto investment products could be key to mass adoptionIdentify who the majority token holders areOther factors to take into consideration are the benefits that token hodlers receive for holding and being active in the community. Investors should also look into the manner in which the token was launched and who the dominant token holders currently are. For example, SushiSwap allows users to stake the native token SUSHI on the platform to receive a portion of the exchange fees generated, whereas Uniswap, the top decentralized exchange (DEX) in DeFi, currently offers no such feature. While other factors like trading volume and daily users have made Uniswap a legitimate investment for many holders, some traders prefer to hold SUSHI because of its revenue-sharing model and multichain trading capabilities. On the flip side, caution is warranted when excessive yields are offered for low liquidity, anonymously-run protocols with little community activity because this can be the perfect setup for catastrophic losses. In DeFi, these are called rug pulls, and typically they occur after a large amount of money has been deposited onto smart contracts controlled by a single anonymous party. Examining the token distribution for the protocol, as well as keeping an eye on the percentage of tokens allocated to the developers and founders vs. the tokens held by the community can give some useful signal on whether a platform could fall victim to a rug pull or the whimsy of mercenary capital.If most of the available supply is held by the creators and backers, there is always going to be a chance that these tokens will later be sold at market rate if or when early investors choose to exit their position.Want more information about trading and investing in crypto markets?The views and opinions expressed here are solely those of the author and do not necessarily reflect the views of Cointelegraph.com. Every investment and trading move involves risk, you should conduct your own research when making a decision.

Čítaj viac
Načítava

Získaj BONUS 8 € v Bitcoinoch

nakup bitcoin z karty

Registrácia Binance

Burza Binance

Aktuálne kurzy