Značka: Tapering

Bitcoin derivatives metrics reflect traders’ neutral sentiment, but anything can happen

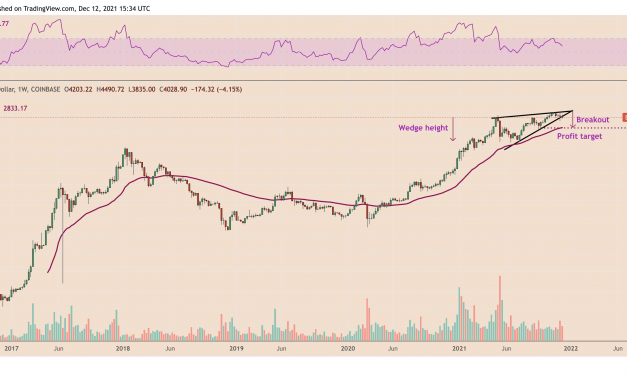
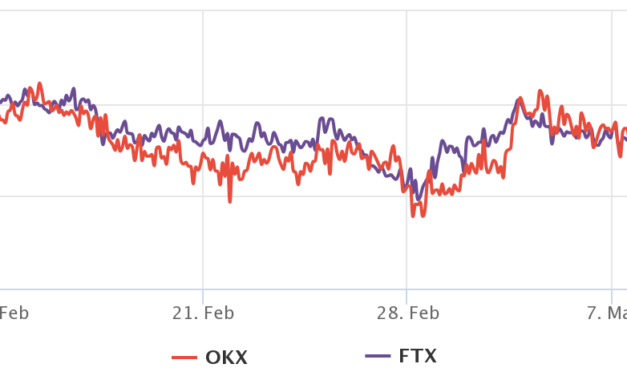
Bitcoin’s (BTC) last daily close above $45,000 was 66 days ago, but more importantly, the current $39,300 level was first seen on Jan. 7, 2021. The 13 months of boom and bust cycles culminated with BTC price hitting $69,000 on Nov. 10, 2021.It all started with the VanEck spot Bitcoin exchange-traded fund being rejected by the United States Securities and Exchange Commission (SEC) on Nov. 12, 2020. Even though the decision was largely expected, the regulator was harsh and direct on the rationale backing the denial.Curiously, nearly one year later, on Nov. 10, 2021, cryptocurrency markets rallied to an all-time high market capitalization at $3.11 trillion right as U.S. inflation as measured by the CPI index hit 6.2%, a 30-year high.Inflation also had negative consequences on risk markets, as the U.S. Federal Reserve acknowledged on Nov. 30, 2021, that inflation is more than just a “transitory” problem and hinted that tapering could occur sooner than expected.More recently, on March 10, the U.S. Senate passed a $1.5 trillion package, which now awaits President Joe Biden’s signature. The new money is the first budget increase since former President Donald Trump left office.Data shows pro traders are not willing to hold leveraged longsTo understand how professional traders are positioned, including whales and market makers, let’s look at Bitcoin’s futures and options market data. The basis indicator measures the difference between longer-term futures contracts and the current spot market levels. The Bitcoin futures annualized premium should run between 5% to 12% to compensate traders for “locking in” the money for two to three months until the contract expiry. Levels below 5% are extremely bearish, while the numbers above 12% indicate bullishness.Bitcoin 3-month futures annualized premium. Source: Laevitas.chThe above chart shows that this metric dipped below 5% on Feb. 11 and hasn’t yet shown signs of confidence from pro traders.Still, one would not be wrong in assessing that an eventual break of the $44,500 resistance would catch those investors off guard, creating a strong buying activity to cover short positions.Options traders are less worried about further downside riskCurrently, Bitcoin seems pretty undecided near $40,000, making it difficult to discern a direction in the market. The 25% delta skew is a telling sign whenever arbitrage desks and market makers overcharge for upside or downside protection.If those traders fear a Bitcoin price crash, the skew indicator will move above 10%. On the other hand, generalized excitement reflects a negative 10% skew. That is precisely why the metric is known as the pro traders’ fear and greed metric.Bitcoin 30-day options 25% delta skew: Source: Laevitas.chAs displayed above, from Feb. 28 until March 8, the skew indicator ranged between 7% and 11%. Albeit not precisely signaling fear, these option traders were overcharging for downside protection by a wide margin.Related: Bitcoin spikes above $40K as Russia sees ‘positive shifts’ in Ukraine war dialogueThe past three days showed a remarkable improvement and currently, the 4% delta skew shows more of a balanced situation. From the BTC options markets perspective, there’s a similar risk for unexpected upward and downward price swings.The mixed data from Bitcoin derivatives offer an interesting opportunity for bulls. The cheap futures premium offers long leverage opportunities at a relatively low cost and the downside protection is running at its lowest level in thirty days.The views and opinions expressed here are solely those of the author and do not necessarily reflect the views of Cointelegraph. Every investment and trading move involves risk. You should conduct your own research when making a decision.

Čítaj viac

Can Ethereum price reach $4K after a triple-support bounce?

Ethereum’s native token Ether (ETH) looks ready to continue its ongoing rebound move toward $4,000, according to a technical setup shared by independent market analyst Wolf.Classic bullish reversal pattern in the works? The pseudonymous chart analyst discussed the role of at least three support levels in pushing the ETH price up by nearly 30% from its local bottom of $2,160. These price floors included a 21-month exponential moving average (EMA), the 0.786 Fib level of a Fibonacci retracement graph drawn from $1,716-swing low to $4,772-swing high and the lower boundary of an ascending triangle pattern.ETH/USD daily price chart featuring the three-supports. Source: TradingViewWolf noted that the triple-support scenario could push Ether price to $3,330. In doing so, the confluence would activate a classic bullish reversal setup, dubbed inverse head-and-shoulders (IH&S). In detail, the IH&S pattern could have Ether form three consecutive troughs, with the middle trough (the head) deeper than the other two (the left and right shoulders). Meanwhile, all the troughs will hang upside down below a common resistance trendline, called the neckline.In a “perfect” scenario, a break above the IH&S neckline may push the Ether price to as high as the maximum distance between the neckline and the head. That puts the ETH price en route to $4,000.ETH/USD daily price chart featuring IH&S setup. Source: Wolf, TradingViewBut if ETH gets rejected in the run-up to $3,000, it would mean a pullback toward the ascending triangle support. ETH bulls ain’t out of the woodsAs Cointelegraph covered earlier this week, Ether’s ongoing price rebound comes as a part of a broader correction that started after ETH reached its record high above $4,850 in November 2021. In doing so, the Ethereum token fell by as much as 55.65% to $2,159 before bouncing upward by 30% to reach its current price levels.The retracement could come out as a temporary respite in Ether’s general downtrend. As a result, its price could still fall lower, according to a “bear flag” setup shown in the attached chart below, with a downside target near $2,000.ETH/USD daily price chart featuring ‘bear flag’ pattern. Source: TradingViewSeveral on-chain indicators agree with the bearish outlook. For instance, Glassnode data shows that the Ethereum balance on all exchanges has been rising since early December 2021, coinciding with the ETH’s price declines.Ethereum balance on all crypto exchanges. Source: GlassnodeA rising number of ETH held by exchanges raises the likelihood of traders selling them for other assets. Notably, a yearlong decline in the number of ETH in exchanges’ reserves had coincided with the Ether price rallying from $730 to over $4,800.Ethereum whales vs. fishesMore downside cues for the Ethereum token come from a clear absence of influential buyers in the market. For instance, some of Glassnode’s metrics show that the number of Ether wallets that hold more than 100 ETH and less than 1,000 ETH has been declining steadily since the beginning of 2021.Ethereum number of addresses with a balance of at least 100 ETH. Source: GlassnodeEther is also not immune to the ongoing macroeconomic trends. For instance, its recent price decline appeared primarily in the wake of the Federal Reserve’s plans to speed up the withdrawal of its $120 billion a month COVID-19 stimulus program by March 2022, followed by at least three rate hikes.The U.S. central bank’s tapering plans have dented investors’ appetite for riskier assets, hurting tech stocks, gold and cryptocurrencies. As a result, Ethereum’s fundamental outlook risks turning extremely bearish.Related: Altcoins rack up 30% gains as Bitcoin price chases after $39,000Nevertheless, retail investors look unfazed by the macroeconomic developments. On Feb. 1, the number of ETH addresses with a non-zero balance reached a new record high of over 74.137 million. Last week, the total amount of wallets with at least 1 ETH had also peaked near 1.414 million.Ethereum number of addresses with balance of at least 1 ETH. Source: GlassnodeEthereum addresses with a balance of at least 10,000 ETH — the real whales — also show a slight improvement. In detail, their numbers increased from 1,157 to 1,163 during the January 2022 price correction, showing that the richest wallet holders had been buying the dip.Easing will returnAccording to Nick, a market analyst from Ecoinometrics, the cryptocurrency market is still in a “danger zone” due to the Fed’s hawkish turn. But there is still hope that the central bank would once again switch to quantitative easing if the stock market falls by another 15%–20%.”It is when there is blood on the streets that you can find good opportunities to make money,” Nick wrote in the latest analysis, adding;”Even though there are some risks of more downside or simply a prolonged period of weak price action until the Fed comes back to its senses, now is probably a good time to build a position and wait for the real pump to begin.”The views and opinions expressed here are solely those of the author and do not necessarily reflect the views of Cointelegraph.com. Every investment and trading move involves risk, you should conduct your own research when making a decision.

Čítaj viac

Fish food? Data shows retail investors are buying Bitcoin, whales are selling

Bitcoin (BTC) staged an impressive recovery after dropping to its three-month low of $42,333 on Dec. 4, rising to as high as $51,000 since. The BTC price retracement primarily surfaced due to increased buying activity among addresses that hold less than 1 BTC. In contrast, the Bitcoin wallets with balances between 1,000 BTC  and 10,000 BTC did little in supporting the upside move, data collected by Ecoinometrics showed.”Bitcoin is still stuck in a situation where small addresses are willing to stack sats [the smallest unit account of Bitcoin], while the whale addresses aren’t really accumulating,” the crypto-focused newsletter noted after assessing the change in Bitcoin amounts across small and rich wallet groups, as shown in the graph below.Bitcoin on-chain data featuring fish and whale BTC wallet clusters. Source: Ecoinometrics Ecoinometrics further asserted that the situation for Bitcoin is “not ideal,” suggesting that the BTC price may end up resuming its decline in the absence of influential buyers.Bitcoin’s downside target sits near $42KEcoinometrics’ bearish outlook appeared as Bitcoin grappled with the Federal Reserve’s policy decision on Wednesday to reduce its bond purchases by $30 billion every month to unwind them down by April next year entirely.The $120 billion a month stimulus program was instrumental in sending the BTC price from below $4,000 in March 2020 to $69,000 in Nov 2021. And now that the liquidity threatens to go away, with lending to become costlier as the Fed prepares for three rate hikes next year, many fear that it would hurt investors’ appetite for risk assets like Bitcoin.Bitcoin price briefly popped above $49,000 after the Fed FOMC meeting confirmed at least three interest rate hikes and some adjustments to the current market supporting practices in 2022. https://t.co/TpTX7tGmYL pic.twitter.com/lXw47icZmB— Cointelegraph Markets (@CointelegraphMT) December 15, 2021Mike Novogratz, chief executive officer of Galaxy Digital Holdings, admitted that Bitcoin might feel “pain ahead” but anticipated that its price would not fall anywhere beyond the $42,000-support.“$42,000 is at a pretty important level, and low 40s should hold,” the crypto billionaire told Bloomberg TV in an interview Tuesday, adding:”So much money is pouring into the space, it would make no sense that the crypto prices would go much below that. If you’re long, it feels painful, but it’s probably healthy.”BTC/USD daily price chart showing $40K-42K support. Source: TradingViewBitcoin accumulation stronger among retailIn reality, unique wallets holding more than or equal to 1,000 BTC have been declining all across 2021, with data from Glassnode showing its number dropping to 2,147 from 2,475 since Feb. 9.The total number of Bitcoin addresses with at least 1,000 BTC balance. Source: GlassnodeIn contrast, the number of unique wallets holding at least 0.01 BTC (around $485 at current exchange rates) rose in 2021, from 8.46 million to 9.39 million year-to-date. Meanwhile, addresses holding at least 0.1 BTC (~$4,855) surged from 3.12 million to 3.30 million in the same period, indicating that “fishes” played a key role in pumping the Bitcoin price from around $30,000 to as high as $69,000 this year.The total number of Bitcoin addresses with at least 0.01 BTC and 0.1 BTC balance. Source: GlassnodeOne more piece of evidence showing that retail investors have been bullish on Bitcoin, came from addresses that hold at least 1 BTC. Related: Analysts expect Bitcoin trend change after Fed lays out its 2022 roadmapThese wallets decreased in quantity in the first half of 2021 as the BTC market grappled with the China ban and other negative news, but started increasing the second half as El Salvador adopted Bitcoin as its legal tender.The total number of Bitcoin addresses with at least 1 BTC balance. Source: GlassnodeThe number of Bitcoin wallets with at least 1 BTC also kept rising during the BTC price correction from $69,000 to $42,333 in the November-December session, signaling accumulation. It reached a seven-month high on Wednesday just as Bitcoin underwent a rebound to $50,000 from its weekly low near $46,000.On-chain analyst Willy Woo also spotted retail accumulation rising to levels seen after the March 2020 crash, which led to Bitcoin’s two-year-long bull run.Accumulation among wallets holding less than 1 BTC. Source: WIlly WooAdditionally, Bitcoin’s momentum indicator that preceeded its price breakout to $69,000 earlier this year is also hinting at a potential BTC price breakout ahead.The views and opinions expressed here are solely those of the author and do not necessarily reflect the views of Cointelegraph.com. Every investment and trading move involves risk, you should conduct your own research when making a decision.

Čítaj viac

Data suggests traders view $46,000 as Bitcoin’s final line in the sand

Dec. 13 will likely be remembered as a “bloody Monday” after Bitcoin (BTC) price lost the $47,000 support, and altcoin prices dropped by as much as 25% within a matter of moments. When the move occurred, analysts quickly reasoned that Bitcoin’s 8.5% correction was directly connected to the Federal Open Market Committee (FOMC) meeting which starts on Dec. 15.Investors are afraid that the Federal Reserve will eventually start tapering, which simply put, is a reduction of the Federal Reserve’s bond repurchasing program. The logic is that a revision of the current monetary policy would negatively impact riskier assets. While there’s no way to ascertain such a hypothesis, Bitcoin had a 67% year-to-date gain until Dec. 12. Therefore, it makes sense for investors to pocket those profits ahead of market uncertainties and this could be connected to the current correction seen in BTC price.Top cryptos weekly performance on Dec. 13. Source: NomicsBitcoin price retraced 8.2% over the past week, but it also outperformed the broader altcoin market. That is in stark contrast to the last 50 days because the leading cryptocurrency’s market share (dominance) dropped from 47.5% to 42%. Investors could have simply fled to Bitcoin due to its relatively smaller risk than altcoins.Tether’s discount bottomed at 4%The OKEx Tether (USDT) premium or discount measures the difference between China-based peer-to-peer (P2P) trades and the official U.S. dollar currency. Figures above 100% indicate an excessive demand for cryptocurrency investing. On the other hand, a 5% discount usually indicates heavy selling activity.OKEx USDT peer-to-peer premium vs. USD. Source: OKExThe Tether indicator bottomed at 96% on Dec. 13, which is slightly bearish but not alarming for a 10% total cryptocurrency market capitalization drop. However, it has been over two months since this metric surpassed 100%, signaling a lack of excitement from China-based traders.To further prove that the Dec. 13 price crash only slightly impacted investor sentiment, the total liquidations over the 24 hours was $400 million.Total derivatives exchange liquidations on Dec. 13. Source: Coinglass.comMore importantly, only $300 million of long leverage contracts were forcefully terminated due to insufficient margin. This figure looks insignificant when compared to the Dec. 3 crash, when $2.1 billion of leveraged buyers had their positions closed.There’s no excessive demand from Bitcoin bears, at the momentTo further prove that the crypto market structure was not strongly affected by the sharp price drop, traders should analyze the perpetual futures. These contracts have an embedded rate and usually charge a fee every eight hours to balance the exchange’s risk. A positive funding rate indicates that longs (buyers) are demanding more leverage. However, the opposite situation occurs when shorts (sellers) require additional leverage, and this causes the funding rate to turn negative.Bitcoin perpetual futures 8-hour funding rate. Source: CoinglassConsidering that most cryptocurrencies suffered considerable losses on Dec. 13, the overall market structure held nicely. Had there been excessive demand for shorts who were betting on a Bitcoin price drop below $46,000, the perpetual futures 8-hour funding would have gone below 0.05%.Tether trading at a 4% discount in the China-based markets, $300 million in long contract liquidations and a neutral funding rate is not a sign of a bear market. Unless these fundamentals change significantly, there is no reason to call for $42,000 or lower Bitcoin prices.The views and opinions expressed here are solely those of the author and do not necessarily reflect the views of Cointelegraph. Every investment and trading move involves risk. You should conduct your own research when making a decision.

Čítaj viac

Cardano: ADA price eyes 30% rally with a potential 'triple bottom' setup

Cardano (ADA) may rally by nearly 30% in the coming days as it hints at forming a classic bullish reversal pattern.Sharp ADA rebound underwayDubbed “triple bottom,” the pattern typically occurs at the end of a downtrend and consists of three consecutive lows printed roughly atop the same level. Meaning, triple bottoms indicate sellers’ inability to break below a specific support level on three back-to-back attempts, which ultimately paves the way for buyers to take over.In a perfect scenario, the return of buyers to the market allows the instrument to retrace sharply towards a higher level, called “neckline,” that connects the highs of the previous two rebounds. The move follows up with another breakout, this time taking the price higher by as much as the distance between the pattern’s bottom and neckline.So far, the ADA price has been able to paint the triple bottom halfway, now rebounding after forming the third low, as shown in the chart below.ADA/USD four-hour price chart featuring triple bottom setup. Source: TradingViewThe point at which the ADA price reversed accompanied a rise in trading volume, suggesting that the rebound had enough backing from the buyers. Therefore, the Cardano token looks poised to at least pursue a run-up towards $1.40.Moreover, if the price further breaks above the neckline level decisively, it would likely continue to rally until it hits $1.63 — as per the triple bottom scenario.Accumulation areaThe potential triple bottom scenario emerged after ADA’s price plunged by more than 60% from its record high of $3.16 achieved on Sept. 2 earlier this year. It also surfaced as the Cardano token became one of the worst performers quarter-to-date, dropping nearly 45.50% compared to its top rival Ether’s (ETH) 15% gains.ADA’s multi-month selloff pushed its daily relative strength index (RSI), a momentum indicator, into oversold territory. In addition, Cardano token’s price drop also led it to what appears like a dependable “accumulation area,” as shown in the chart below. ADA/USD daily price chart featuring accumulation area and oversold RSI. Source: TradingViewBoth RSI and the accumulation area also point to a buying scenario in the ADA market, thus supporting the triple bottom scenario on the four-hour chart.Risks remain for ADA priceIt is important to notice that ADA dropped by more than 5.50% in the past 24 hours, much in sync with other top crypto assets in the space, with Bitcoin (BTC) sinking by over 3% and Ether by almost 5% in the same period.At the core of the crypto market’s uniformed decline was the Federal Reserve’s two-day policy meeting starting Tuesday. In the meetup, the U.S. central bank would likely decide to accelerate the tapering of its $120 billion a month asset purchasing program, one of the key catalysts behind the crypto and stock market rally since March 2020.Other parts of the Fed meeting would see the officials discussing the prospects of rate increases next year from its current near-zero levels. Cheaper lending had also played an important role in pushing the Bitcoin and altcoin market prices higher across 2020 and 2021, including ADA.Related: Bitcoin price dip may end Wednesday as Bitfinex bids hint at Fed ‘buy the news’ plansAs Fed officials initiate their policy meeting, the Cardano token would be testing $1.18 as its weekly support for a potential price rebound. The $1.18-level is the 0.618 Fib line of what appears to be an accurate Fibonacci retracement graph in predicting ADA’s support and resistance levels. ADA/USD weekly price chart. Source: TradingView.comShould ADA fail to rebound and close below $1.18, its next Fib support may come at 0.786 Fib line near $0.674, around 42% below. Nonetheless, ADA/USD may also test $1 as psychological support for an early upside retracement, similar to its multiple rebounds between February and July 2021.The views and opinions expressed here are solely those of the author and do not necessarily reflect the views of Cointelegraph.com. Every investment and trading move involves risk, you should conduct your own research when making a decision.

Čítaj viac

3 reasons why Ethereum price can drop below $3K by the end of 2021

Ethereum’s native token Ether (ETH) reached an all-time high around $4,867 earlier in November, only to plunge by nearly 20% a month later on rising profit-taking sentiment. And now, as the ETH price holds $4,000 as a key support level, risks of further selloffs are emerging in the form of multiple technical and fundamental indicators.ETH price rising wedgeFirst, Ether appears to have been breaking out of “rising wedge,” a bearish reversal pattern that emerges when the price trends upward inside a range defined by two ascending — but converging — trendlines.Simply put, as the Ether price nears the Wedge’s apex point, it risks breaking below the pattern’s lower trendline, a move that many technical chartists see as a cue for more losses ahead. In doing so, their profit target appears at a length equal to the maximum wedge height when measured from the breakout point.ETH/USD weekly price chart featuring Rising Wedge. Source: TradingViewAs a result, Ether’s rising wedge downside target comes out to be near $2,800, also near its 50-week exponential moving average (50-week EMA). Bearish divergenceThe bearish outlook in the Ether market appears despite its ability to bear the massive selling pressures felt elsewhere in the cryptocurrency market in recent weeks.For instance, Bitcoin (BTC), the leading crypto by market cap, fell by 30% almost a month after establishing its record high of $69,000 in early November, much higher than Ether’s decline in the same period. That prompted many analysts to call Ether a “hedge” against the Bitcoin price decline — also as ETH/BTC rallied to its best levels in more than three years.But it does not take away the fact that Ether’s recent price rally has coincided with a decline in its weekly relative strength index (RSI), signaling a growing divergence between price and momentum.ETH/USD weekly price chart featuring divergence between price and RSI. Source: TradingViewAdditionally, the recent ETH price pullback also had the RSI oscillator fall below 70, a classic sell indicator.Fed “dot plot”More downside cues for Ether come ahead of the Federal Reserve two-day policy meeting starting on Dec, 14 when the U.S. central bank will discuss how quickly it may need to taper its $120 billion a month asset purchasing program to gain enough flexibility for potential rate hikes next year.Just last month, the Fed announced that it would scale back its bond-buying at the pace of $15 billion per month, suggesting that the stimulus would eventually cease by June 2022. Nonetheless, a string of recent market reports showing a tightening jobs market and persistently mounting inflationary pressures prompted the Fed officials to end tapering “perhaps a few months sooner.”20 CenBanks hold meetings next week as inflation keeps rising w/final decisions for 2021 due at Fed, ECB, BoJ, BoE which together responsible for half of world econ. CenBank balance sheets have risen in lockstep to ATHs, but now there could be divergence. https://t.co/GgOLGCNbjR pic.twitter.com/mrrhwUVcet— Holger Zschaepitz (@Schuldensuehner) December 12, 2021Market anticipations also adjusted, with a Financial Times survey of 48 economists anticipating the stimulus to end by March 2022 and most respondents favoring a rate hike in the second quarter.The period of loose monetary policies after March 2020 has been instrumental in pushing the ETH price high by over 3,330%. Therefore, the increasing likelihood of tapering can certainly put the brakes on the current rally, if not the bull market as a whole, according to some ana.From there I expect a very aggressive approach from the Fed because they’ll recognize we are in a bubble and something extreme needs to be done.Then we get our multi-year bear market.— K A L E O (@CryptoKaleo) December 10, 2021

Markets anticipate the Fed will update its policy statement and summary of economic projections (SEP) this week. In doing so, more central bank officials would adjust the “dot plot” to favor an earlier-than-anticipated rate hike against rising inflation.The views and opinions expressed here are solely those of the author and do not necessarily reflect the views of Cointelegraph.com. Every investment and trading move involves risk, you should conduct your own research when making a decision.

Čítaj viac
Načítava

Získaj BONUS 8 € v Bitcoinoch

nakup bitcoin z karty

Registrácia Binance

Burza Binance

Aktuálne kurzy