Bitcoin price races toward $27K, but a swift recovery is not confirmed by market data
BTC price recovered quickly from this week’s swing low, but derivatives data hints that a challenging road lies ahead.
Čítaj viac
BTC price recovered quickly from this week’s swing low, but derivatives data hints that a challenging road lies ahead.
Čítaj viac
Traders are still tiptoeing around markets, as multiple risk events remain at the forefront, but BTC margin and futures markets are starting to favor a bullish breakout.
Čítaj viac
BTC price falls below the 55-day support level at $27,000, but futures market resilience sparks hope for a recovery toward $28,000.
Čítaj viac
BTC margin markets and futures’ long-to-short indicator show professional traders unwilling to bet on Bitcoin’s price dropping.
Čítaj viac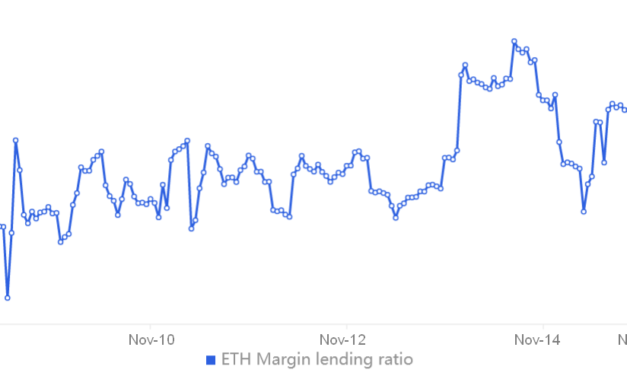
Ether (ETH) has been stuck between $1,170 to $1,350 from Nov. 10 to Nov. 15, which represents a relatively tight 15% range. During this time, investors are continuing to digest the negative impact of the Nov. 11 Chapter 11 bankruptcy filing of FTX exchange. Meanwhile, Ether’s total market volume was 57% higher than the previous week, at $4.04 billion per day. This data is even more relevant considering the collapse of Alameda Research, the arbitrage and market-making firm controlled by FTX’s founder Sam Bankman-Fried.On a monthly basis, Ether’s current $1,250 level presents a modest 4.4% decline, so traders can hardly blame FTX and Alameda Research for the 74% fall from the $4,811 all-time high reached in November 2021.While contagion risks have caused investors to drain centralized exchanges wallets, the movement led to an uptick in decentralized exchanges (DEX) activity. Uniswap, 1inch Network, and SushiSwap saw a 22% increase in the number of active addresses since Nov. 8.Let’s take a look at derivatives metrics to better understand how professional traders are positioned in the current market conditions.Margin markets show no signs of distressMargin trading allows investors to borrow cryptocurrency to leverage their trading position, potentially increasing their returns. For example, one can buy Ether by borrowing Tether (USDT), thus increasing their crypto exposure. On the other hand, borrowing Ether can only be used to short it or bet on a price decrease.Unlike futures contracts, the balance between margin longs and shorts isn’t necessarily matched. When the margin lending ratio is high, it indicates that the market is bullish — the opposite, a low lending ratio, signals that the market is bearish.OKX USDT/ETH margin lending ratio. Source: OKXThe chart above shows investors’ morale topped on Nov. 13 as the ratio reached 5.7, the highest in two months. However, from that point onward, OKX traders presented less demand for bets on the price uptrend as the indicator declined to the current 4.0 level.Still, the current lending ratio leans bullish in absolute terms, favoring stablecoin borrowing by a wide margin. It is worth highlighting that the overall sentiment improved since Nov. 8 as traders increased demand for margin longs using stablecoins.Related: Genesis Global halts withdrawals citing ‘unprecedented market turmoil’Long-to-short data shows reduced demand for leverage longsThe top traders’ long-to-short net ratio excludes externalities that might have solely impacted the margin markets. By aggregating the positions on the spot, perpetual and quarterly futures contracts, analysts can better understand whether professional traders are leaning bullish or bearish.There are occasional methodological discrepancies between different exchanges, so viewers should monitor changes instead of absolute figures.Exchanges’ top traders Ether long-to-short ratio. Source: CoinglassThe long-to-short ratio at Huobi stood at 0.98 between Nov. 8 and Nov. 15, indicating a balanced situation between leverage buyers and sellers. On the other hand, Binance traders initially faced a deep contraction in the demand for longs, but the movement was utterly subdued as buying activity dominated from Nov. 11 onward.At the OKX exchange, the metric plunged from 1.30 on Nov. 8 to the present 0.81, favoring shorts. Therefore, according to the long-to-short indicator, the top traders significantly reduced their longs until Nov. 10, but then proceeded to increase long positions.From a derivatives analysis point of view, neither futures nor margin markets display excess demand for shorts. Had the panic-based sentiment prevailed, one would expect worsening conditions on the Ether lending and long-to-short indicators. Consequently, bulls are in control as traders are not comfortable taking bearish positions with ETH below $1,300.The views and opinions expressed here are solely those of the author and do not necessarily reflect the views of Cointelegraph.com. Every investment and trading move involves risk, you should conduct your own research when making a decision.
Čítaj viac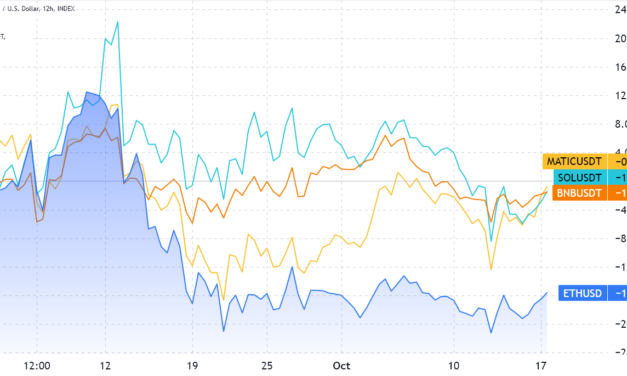
Ether (ETH) price has been unable to close above $1,400 for the past 29 days and it has been trading in a relatively tight $150 range. At the moment, the $1,250 support and the $1,400 resistance seem difficult to break, but two months ago, Ether was trading at $2,000. The current price range for Ether simply reflects how volatile cryptocurrencies can be.From one side, investors are calm as Ether trades 50% above the $880 intraday low on June 18. However, the price is still down 65% year-to-date despite the most exciting upgrade in the network’s sev-year history.More importantly, Ethereum’s biggest rival, BNB Chain, suffered a cross-chain security exploit on Oct. 6. The $568 million exploit caused BNB Chain to temporarily suspend all transactions on the network, which holds $5.4 billion in smart contracts deposits.Ether underperformed competing smart contracts like BNB, Cardano (ADA), and Solana (SOL) by 14% since September, even though its TVL in ETH terms increased by 9% during the period. This suggests that the Ethereum network’s issues, such as the $3 average transaction fees, weighed on the ETH price.Ether vs. MATIC, SOL, BNB: Source: TradingViewTraders should look at Ether’s derivatives markets data to understand how whales and market makers are positioned. Options traders remain moderately risk-averseThe 25% delta skew is a telling sign whenever professional traders overcharge for upside or downside protection. For example, if traders expected an Ether price crash, the options markets skew indicator would move above 12%. On the other hand, generalized excitement reflects a negative 12% skew. Ether 60-day options 25% delta skew: Source: Laevitas.chIn layperson’s terms, the higher the index, the less inclined traders are to offer downside risk protection. The indicator has been signaling fear since Sept. 19, when it last held a value below 10%. That day marked the temporary bottom of a 28% weekly correction, as the $1,250 support strengthened after such a test.Long-to-short data show traders adding longsThe top traders’ long-to-short net ratio excludes externalities that might have solely impacted the options markets. By aggregating the positions on the spot, perpetual and quarterly futures contracts, one can better understand whether professional traders are leaning bullish or bearish.There are occasional methodological discrepancies between different exchanges, so viewers should monitor changes instead of absolute figures.Exchanges’ top traders Ether long-to-short ratio. Source: CoinglassBinance displayed a modest increase in its long-to-short ratio between Oct. 13 and 17, as the indicator moved from 1.04 to 1.07 in those four days. Thus, those traders slightly increased their bullish bets.Huobi data shows a stable pattern as the long-to-short indicator stayed near 0.98 the whole time. Lastly, at OKX exchange, the metric plunged to 0.72 on Oct. 13, largely favoring shorts only to rebound to the current 1.00.On average, according to the long-to-short indicator, the top traders from those three exchanges have been increasing long positions since the $1,200 support test on Oct. 13.Skew and leverage are critical to sustaining the $1,250 supportThere was no significant improvement in pro traders’ derivatives positions despite Ether gaining 12% since the Oct. 13 crash down to $1,185. Moreover, options traders fear that a move below $1,250 remains feasible, considering the skew indicator remains above the 10% threshold.If these whales and market makers had firm convictions of a sharp price correction, that would have been reflected in the exchange top traders’ long-to-short ratio.Investors should closely monitor both metrics. The 25% delta skew should remain at 18%, and the long-to-short ratio above 0.80 to sustain the $1,250 support strength. These indicators are a telling sign of whether the bearish sentiment from top traders is gaining momentum.The views and opinions expressed here are solely those of the author and do not necessarily reflect the views of Cointelegraph.com. Every investment and trading move involves risk, you should conduct your own research when making a decision.
Čítaj viac
Michael J. Burry, the financial wizard who was portrayed in the movie “The Big Short”, is known for predicting crises. For instance, his investment fund made billions from the 2008 housing crash, and Burry liquidated almost all his entire portfolio during the 2Q of 2022.Given that no one seems to know whether traditional markets will bounce before entering a further recessive environment, it might be a good time to consider investing in cryptocurrencies. Below are some examples on how experienced investors sometimes miss incredible rallies.In May 2017, Burry said people should expect a “global financial meltdown” and World War 3. Instead, the S&P 500 rallied 20% over the following 9 months. A couple of years later, the index peaked in December 2021, at a level that was more than 100% above Burry’s suggested short entry price.In December 2020, Burry said that Tesla’s stock price was “ridiculous” as part of his justification for opening his short position. A 47% rally happened in the 35 days following that remark and Tesla shares peaked 10 months later after a 105% total gain from Tesla’s supposedly “ridiculous” price.Indicators point to a major recession, but exactly when remains unknownWithout mistake, traders should not dismiss the fact that the U.S. dollar index has rallied strongly against other major global currencies to reach its highest level in 20 years. This shows that investors are desperately seeking shelter in cash positions, exiting stock markets, foreign currencies and corporate debt.Moreover, the gap between the U.S. Treasury 2y-year and 10-year notes widened to a record-high -0.57% on Sept. 22. Typically, when shorter-term government bonds have higher yields than long-term bonds — an inverted yield curve — it’s interpreted as heightened signs of a recession.Adding to the concerns, on Sept. 22, the U.S. Federal Reserve reported an all-time high of $2.36 trillion in overnight reverse repurchase agreements. In a “reverse repo,” market participants lend cash to the FED in exchange for U.S. Treasuries and agency-backed securities. The excessive cash in investors’ balance sheets indicates a lack of trust in counterparty credit risk, which is a bearish indicator.After laying out the three critical macroeconomic indicators hitting levels not seen in over 2 decades, two important questions are left. First, what is Bitcoin (BTC) and Ether (ETH) relation to traditional markets? More importantly, what impact should investors expect if the S&P 500 drops 20% and the housing market crashes?Regardless of whether a person pays their bills using cryptocurrencies, energy prices, food and healthcare services are heavily dependent on the U.S. dollar. Commodity international transactions are mostly priced in USD, including imports, exports and the actual trading. So even if one pays their expenses using Bitcoin, odds are somewhere along the way, this value will be converted into fiat money.The cost of borrowing USD impacts multiple economiesThe main takeaway from the lack of an effective circular trade exclusively using cryptocurrencies is that everyone’s life depends on the U.S. dollar’s strength and borrowing cost. Unless one lives in a cave, isolated in a self-sufficient land, or on some communist island, when investors hoard cash and interest rates skyrocket, every market is impacted.As for an eventual housing market collapse or another 20% crash in stock markets, the truth is its impact on Bitcoin and Ether are impossible to predict. From one side, there’s the pressure from holders scrambling to reduce their exposure and secure a cash position for an eventual longer-than-estimated crypto-winter. On the other hand, there could be a surge in investors looking for non-confiscatable assets or seeking protection from inflation.That’s why Michael J. Burry’s story becomes relevant right now when every pundit and market analyst claims a near-future market collapse or the potential crash in housing prices. Bitcoin and Ether are facing an imminent global recession for the first time, and judging by March 2020, when a panic selling triggered by the Covid-19 crisis, those that stood for the long run were rewarded.The views and opinions expressed here are solely those of the author and do not necessarily reflect the views of Cointelegraph.com. Every investment and trading move involves risk, you should conduct your own research when making a decision.
Čítaj viac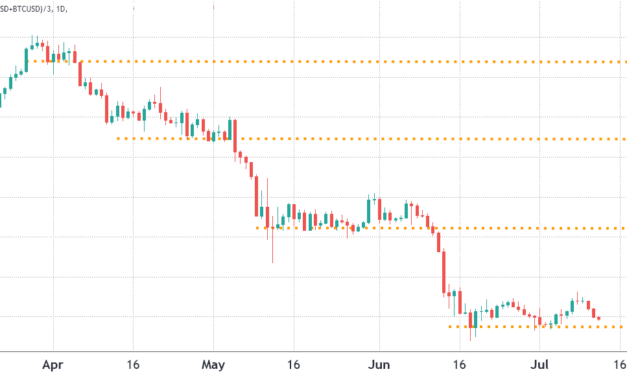
The Bitcoin (BTC) price chart from the past couple of months reflects nothing more than a bearish outlook and it’s no secret that the cryptocurrency has consistently made lower lows since breaching $48,000 in late March.Bitcoin price in USD. Source: TradingViewCuriously, the difference in support levels has been getting wider as the correction continues to drain investor confidence and risk appetite. For example, the latest $19,000 baseline is almost $10,000 away from the previous support. So if the same movement is bound to happen, the next logical price level would be $8,000.Traders are afraid of regulation and contagionOn July 11, the Financial Stability Board (FSB), a global financial regulator including all G20 countries, announced that a framework of recommendations for the crypto sector is expected in October. The FSB added that international regulators need to supervise crypto markets in line with the principle of “same activity, same risk, same regulation.”In a written speech on July 12, Jon Cunliffe, deputy governor for financial stability at the Bank of England, said that crypto is somehow over and it should not be a concern anymore. Cunliffe added: “innovation has to happen within a framework in which risks are managed.”To date, investors still haven’t figured out the total losses from deposits on crypto lenders Celsius and Voyager Digital, and both firms continue to seek either a recovery plan or bankruptcy. According to Voyager, the firm still holds $650 million worth of “claims against Three Arrows Capital,” so the exact numbers of customer assets remain unknown.The negative newsflow is reflected in the CME’s Bitcoin futures contracts premium. This data measures the difference between longer-term futures contracts and the current spot prices in regular markets.Whenever this indicator fades or turns negative, this is an alarming red flag. This situation is also known as backwardation and indicates that bearish sentiment is present.BTC CME 1-month forward contract premium vs. Coinbase/USD. Source: TradingViewThese fixed-month contracts usually trade at a slight premium, indicating that sellers are requesting more money to withhold settlement for longer. As a result, futures should trade at a 0.25%–0.75% premium in healthy markets, a situation known as contango.Notice how the indicator has stood below the “neutral” range since early April, since Bitcoin failed to sustain levels above $45,000. The data shows that institutional traders are unwilling to open leverage long positions, although it is not yet a bearish structure.Macroeconomic fears are preventing investors from trading cryptoExchange-provided data highlights traders’ long-to-short net positioning. By analyzing every client’s position on the spot, perpetual and futures contracts, one can better understand whether professional traders are leaning bullish or bearish.There are occasional discrepancies in the methodologies between different exchanges, so viewers should monitor changes instead of absolute figures.Exchanges top traders Bitcoin long-to-short ratio. Source: CoinglassDespite Bitcoin’s 11% correction from July 9 to 12, top traders have increased their leverage longs. The long-to-short ratio at Binance remained relatively flat at 1.13, while the top traders at Huobi started at 0.95 and finished the period at 0.93. However, this impact was more than compensated by OKX traders increasing their bullish bets from 1.09 to 1.32.Related: The search term ‘Bitcoin Crash’ is trending — Here’s whyThe lack of a premium in the CME futures contract is not concerning because Bitcoin is struggling with the $20,000 resistance. Furthermore, top traders on derivatives exchanges have increased their longs despite the 11% price drop in three days.Regulatory pressure is unlikely to recede in the short term and at the same time, there’s not much that the Federal Reserve can do to suppress inflation without triggering some form of an economic crisis. For this reason, pro traders are not rushing to buy the dip because Bitcoin’s correlation to traditional assets remains high.The views and opinions expressed here are solely those of the author and do not necessarily reflect the views of Cointelegraph. Every investment and trading move involves risk. You should conduct your own research when making a decision.
Čítaj viac
South Korean crypto investment startup platform Uprise reportedly lost around 99% of its assets worth about $20 million when it got liquidated shorting the LUNA token.Uprise’s trading desk Heybit uses an artificial intelligence (AI) trading system that was designed to reduce the risks associated with leveraged trading. Local news outlet Seoul Economic Daily reported on July 6 that Uprise’s AI, which it calls a robo-advisor, made a disastrous misread in May on the LUNA token as it fell precipitously from $60 to fractions of a cent. The system shorted LUNA but got liquidated during the token’s bizarre price pumps along the way, leading to $20 million in customer losses and $3 million of its own losses. In total, Uprise lost about 99% of its assets.Most users of Uprise’s Heybit service are high net worth individuals and corporations who stake their crypto for yield generated by the AI trading on futures markets. The firm has been backed by the Hashed crypto investment firm, Kakao Ventures, and several banks and venture capital firms.The firm has suspended services, but has not issued an official disclosure to its clients about the losses. An Uprise official confirmed to Seoul Economic Daily that: “Due to great unexpected volatility in the market, there has been damage to customer assets. We plan to finalize the report on our virtual asset business soon.”In addition to officially notifying its users, Uprise officials are reportedly working on a compensation plan for its customers so that it can continue to operate. Related: Korea and US agree to share investigation data on TerraWith Uprise in the spotlight, Seoul Economic Daily pointed out that it has not registered as a virtual asset service provider (VASP). It reported that Uprise officials feel that the firm is able to skirt the law requiring it to register as a VASP because it does not collect Korean Won nor directly invest in virtual assets, only futures.Registration helps keep crypto exchanges in compliance with the notorious Travel Rule from the Financial Action Task Force.Uprise is the latest centralized crypto service provider to reveal significant losses stemming from the Terra incident and subsequent contagion. It joins BlockFi, Celsius, and Voyager Digital among the list of firms that have had to take drastic measures to try and stay afloat. FTX US exchange has the option to buy BlockFi, Celsius has been unwinding loans, and Voyager filed for bankruptcy on July 5.
Čítaj viac
Tento príspevok bol pôvodne publikovaný na stránke...
Čítaj viac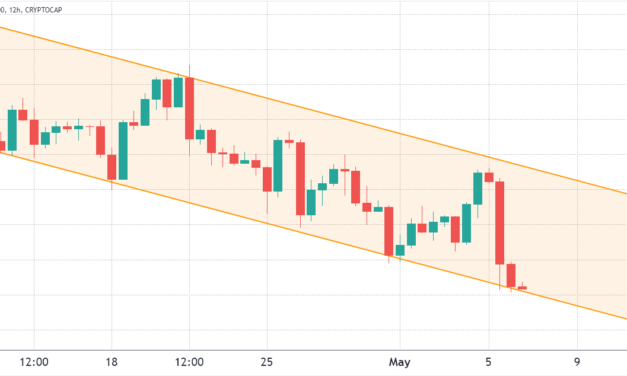
The total crypto market capitalization has been trading within a descending channel for 24 days and the $1.65 trillion support was retested on May 6. The drop to $1.65 trillion was followed by Bitcoin (BTC) reaching $35,550, its lowest price in 70 days.Total crypto market cap, USD billion. Source: TradingViewIn terms of performance, the aggregate market capitalization of all cryptocurrencies dropped 6% over the past seven days, but this modest correction in the overall market does not represent some mid-capitalization altcoins which managed to lose 19% or more in the same time frame.As expected, altcoins suffered the mostIn the last seven days, Bitcoin price dropped 6% and Ether (ETH) declined by 3.5%. Meanwhile, altcoins experienced what can only be described as a bloodbath. Below are the top gainers and losers among the 80 largest cryptocurrencies by market capitalization.Weekly winners and losers among the top 80 coins. Source: NomicsTron (TRX) rallied 26.9% after TRON DAO rolled out a USDD, a decentralized stablecoin, on May 5. The algorithmic stablecoin is connected to the Ethereum and BNB Chain through the BTTC cross-chain protocol.1inch (1INCH) gained 5.6% after the decentralized exchange governance application became Polygon’s network leader by completing 6 million swaps on the network.STEPN (GMT), the native token of the popular move-to-earn lifestyle app, declined 35.7%, adjusting after a 70% rally between April 18 and April 28. A similar movement happened to Apecoin (APE) after the token pumped 94% between April 22 and April 28.The Tether premium flipped negative on May 6The OKX Tether (USDT) premium gauges China-based retail demand and it measures the difference between the China-based peer-to-peer trades and the United States dollar.Excessive buying demand puts the indicator above fair value at 100%. On the other hand, Tether’s market offer is flooded during bearish markets, causing a 4% or higher discount.Tether (USDT) peer-to-peer vs. USD/CNY. Source: OKXThe OKX Tether premium peaked at 1.7% on April 30, indicating some excess demand from retail. However, the metric reverted to a 0% premium over the next 5 days.More recently, in the early hours of May 6, the OKX Tether premium flipped to -1% negative. Data shows retail sentiment worsened as Bitcoin moved below $37,000.Futures markets show mixed sentimentPerpetual contracts, also known as inverse swaps, have an embedded rate that is usually charged every eight hours. Exchanges use this fee to avoid exchange risk imbalances.A positive funding rate indicates that longs (buyers) demand more leverage. However, the opposite situation occurs when shorts (sellers) require additional leverage, causing the funding rate to turn negative.Accumulated 7-day perpetual futures funding rate. Source: CoinglassAs shown above, the accumulated seven-day funding rate is slightly positive for Bitcoin and Ether. Data indicates slightly higher demand from longs (buyers), but nothing that would force traders to close their positions. For instance, a positive 0.15% weekly rate equals 0.6% per month, thus unlikely to cause harm.On the other hand, altcoins’ 7-day perpetual futures funding rate was -0.30%. This rate is equivalent to 1.2% per month and indicates higher demand from shorts (sellers).Signs of weak retail demand as indicated by OKX Tether data and the negative funding rate on altcoins are a signal that traders are unwilling to buy at the critical $1.65 trillion crypto market capitalization. Buyers seem to be waiting for further dips before stepping in, so further price corrections will likely follow.The views and opinions expressed here are solely those of the author and do not necessarily reflect the views of Cointelegraph. Every investment and trading move involves risk. You should conduct your own research when making a decision.
Čítaj viac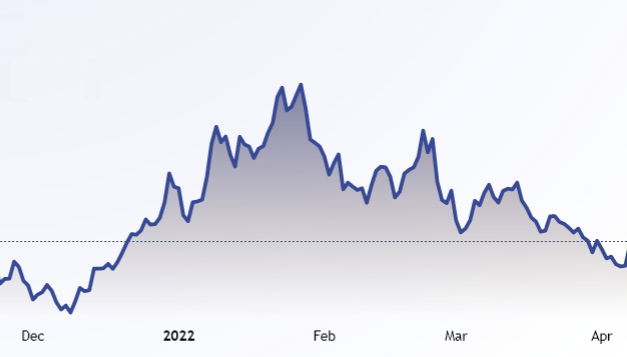
Ether (ETH) lost the critical $3,000 psychological support level on April 11 after a 16% weekly negative performance. Bulls were definitively caught by surprise as $104 million in leveraged long futures got liquidated on April 11. Ether’s downturn also followed a decline in the total value locked (TVL) in Ethereum smart contracts. Ethereum network TVL in ETH. Source: Defi LlamaThe metric peaked at 40.6 million Ether on Jan. 27, and has since dropped by 22%. This indicator could partially explain why Ether could not withstand the adversity brought by Bitcoin’s (BTC) 13% weekly negative move. However, the leading altcoin has catalysts of its own because Ethereum developers implemented the network’s first-ever “shadow fork” on April 11. The testnet update created an area for developers to stress-test their assumptions around the network’s complex shift to proof-of-stake. More importantly, one needs to analyze how professional traders are positioning themselves and there’s no better gauge than derivatives markets.The futures premium is back to bearish levelsTo understand whether the current bearish trend reflects top traders’ sentiment, one should analyze Ether’s futures contracts premium, also known as a “basis.” Unlike a perpetual contract, these fixed-calendar futures do not have a funding rate, so their price will differ vastly from regular spot exchanges.A trader can gauge the market sentiment by measuring the expense gap between futures and the regular spot market. A neutral market should present a 5% to 12% annualized premium (basis) as sellers request more money to withhold settlement longer.Ether 3-month futures premium. Source: laevitas.chThe above chart shows that Ether’s futures premium stood above the 5% neutral threshold between March 25 and April 6, but later weakened to 3%. This level is typically associated with fear or pessimism because futures market traders are reluctant to open leveraged long (buy) positions.Long-to-short data confirms worsening conditionsThe top traders’ long-to-short net ratio excludes externalities that might have impacted the longer-term futures instruments. By analyzing these whale positions on the spot, perpetual and futures contracts, one can better understand whether professionals effectively become bearish.Exchanges’ top traders Ether long-to-short ratio. Source: CoinglassFirstly, one should note the methodological discrepancies between different exchanges, so the absolute figures have lesser importance. Yet, since April 5, there has been a considerable decline in the long-to-short ratio of every major derivatives exchange.Data signals that whales have been increasing their bearish bets over the past week. For instance, the Binance whales held a 1.05 long-to-short ratio on April 5, but gradually reduced it to 0.88. Furthermore, the OKX top traders moved from a 2.11 favoring longs to the current 1.35. Related: Kava turns bullish as Ethereum Co-Chain launch initiates push toward EVM compatibilityAre investors and users abandoning the network?From the perspective of the metrics discussed above, there might not be an indicator pointing to extreme bearishness but the futures basis rate and the top traders’ long-to-short ratio worsened over the past week.Furthermore, the TVL in Ethereum smart contracts signals a decline in use. The constant delays in the proof-of-stake migration could be pulling investors’ attention away and driving decentralized finance (DeFi), gaming, and nonfungible (NFT) projects to competing networks. In turn, traders have been focusing their attention on more promising altcoins and consequently diminishing the demand for Ether.The views and opinions expressed here are solely those of the author and do not necessarily reflect the views of Cointelegraph. Every investment and trading move involves risk. You should conduct your own research when making a decision.
Čítaj viac

