Značka: Relative Strength Index

Can XRP price reach $1 after 25% gains in one week? Watch this key support level

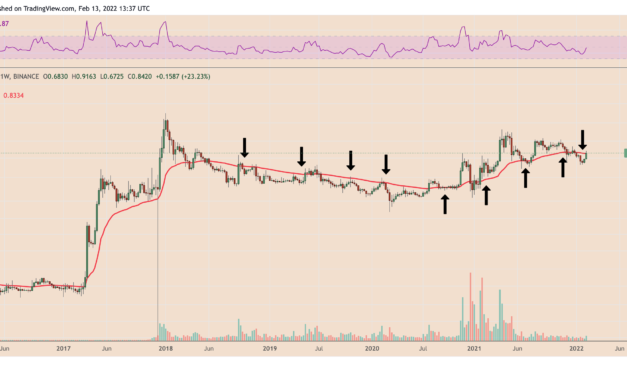
XRP price has continued to bounce back after falling by more than 70% in a correction between April 2021 and January 2022.Why the XRP/USD 50-week EMA is keyOn Feb. 13, XRP/USD reached as high as $0.916, above its 50-week exponential moving average (50-week EMA; the red wave) around $0.833. The upside move, albeit not decisive, opened possibilities for further bullish momentum, mainly owing to a historical buying sentiment around the said wave.XRP/USD weekly price chart featuring 50-week EMA. Source: TradingViewFor instance, traders had successfully reclaimed the 50-week EMA as support in the week ending July 27, 2020, more than a year after flipping the wave as resistance. Later, XRP’s price rallied by more than 820% to $1.98 in April 2021, its best level in more than three years.Conversely, during the bearish cycles between 2018 and 2020, XRP’s 50-week EMA acted as a strong resistance level on multiple occasions. That showed the wave’s ability to withstand bullish recovery sentiments, such as the one witnessed during the current price rebound.Can XRP retake $1? XRP now needs to hold decisively above its 50-week EMA, which could have it reclaim $1 in the sessions ahead.The level, which sits around 25% above the current price levels, coincides with XRP’s two key resistance targets. The first is the multi-month downward sloping trendline that has been capping the token’s upside bias since April 2021XRP/USD weekly price chart featuring upside target. Source: TradingViewMeanwhile, the second target is the 0.382 Fib line of the Fibonacci retracement level drawn between $2.70-swing high and $0.10-swing low, also having a history of limiting XRP’s strong trends by acting as both support and resistance.Still a lower high, the $1-level does not promise to take XRP out of its correction bias. Instead, it may bring opportunities for traders to secure their interim profits, thus exposing XRP to a pullback toward an imminent support target near $0.71, as per the Fibonacci retracement graph. The bears’ case Conversely, failure to obtain a decisive close above the 50-week EMA resistance could have XRP eye a pullback toward its 200-week EMA (the blue wave) near $0.54.This move risks trapping the price inside a range defined by 50-week EMA as resistance and 200-week EMA as support, which may result in a further breakout to the downside. The bearish outlook appears out of a fractal from June 2018-June 2019 session, as shown in the chart below.XRP/USD weekly price chart. Source: TradingViewNotably, XRP’s run-up to its record high of $3.55 in January 2018 coincided with its weekly relative strength index (RSI), forming a lower high, thus confirming a bearish divergence. Later, the price declined below its 50-week EMA but picked support from its 200-week EMA. The RSI’s fall also exhausted near 37, just above its oversold reading of 30.XRP trended sideways inside the said moving average range, while the RSI maintained a reading above 37. Nonetheless, in June 2019, the price broke below the 200-day EMA support, extending its decline to as low as $0.10 as of March 2020.Related: XRP gains 30% after Ripple gets permission to explain ‘fair notice defense’ vs. SECIf the fractal plays out as it did in 2018-2019, XRP would risk breaking below its 200-week EMA support near $0.54 in the coming sessions. Such a move may shift XRP’s interim downside target to the 0.786 Fib line near $0.43, according to the Fibonacci retracement graph painted from $0.14-swing low to $1.52-swing high.XRP/USD weekly price chart featuring downside targets. Source: TradingViewMeanwhile, a further break below $0.43 would put the next downside target at $0.22, a level with a history of high-volume trading activity.The views and opinions expressed here are solely those of the author and do not necessarily reflect the views of Cointelegraph.com. Every investment and trading move involves risk, you should conduct your own research when making a decision.

Čítaj viac

This key trading pattern hints at the continuation of Fantom’s (FTM) 125% rebound

Fantom (FTM) looks poised to hit a new record high in the coming sessions after its 125% price rebound from $1.23 on Dec. 14, 2021, to $2.84 on Jan. 3, 2022 triggered a classic bullish reversal setup. Dubbed inverse head and shoulders (IH&S), the setup appears when an asset forms three troughs below a so-called neckline resistance, with the middle trough (the head) deeper than the left and right shoulder. The price of FTM has recently undergone a similar price trajectory, as shown in the chart below. As a result, FTM has a common resistance in the range defined by $2.55 to $2.74, which encompasses the length of the inverse head and shoulders pattern.FTM/USD daily price chart featuring inverse head and shoulders pattern. Source: TradingViewCould Fantom rally by another 50%?In a perfect world, an IH&S pattern would normally result in a bullish breakout once the price closes decisively above the neckline level. Ideally, the upside target be equal to the maximum distance between the head and the neckline, when measured from the breakout point.On Monday, FTM almost completed its IH&S formation by reaching its neckline. As a result, the Fantom token’s next move could be a bullish breakout above the $2.55 to $2.74 resistance range. In doing so, it would pursue a run-up toward $4.33, based on the setup presented in the chart below.FTM/USD daily price chart featuring the IH&S’s breakout setup. Source: TradingViewA sharp price pullback from the neckline range, accompanied by a spike in volume, would risk invalidating the IH&S setup. In that case, the next ideal support line may come near $2.08. This would be based on FTM’s volume profile visible range (VPVR), a metric that displays trading activity over a specified period at specified price levels.FTM/USD daily price chart featuring volume profile target. Source: TradingViewAre there risks of overvaluation?Downside risks in the Fantom market also appeared in the form of its relative strength index (RSI), a metric that measures the magnitude of the asset’s recent price changes to evaluate its overbought or oversold conditions.Relative Strength Index in a nutshell. Source: InvestopediaIn detail, FTM’s daily RSI entered an overbought territory on Jan. 3 as its reading marginally jumped above 70. The technical indicator suggests FTM is overbought and that it should undergo a certain degree of correction to neutralize its market sentiment. In layman’s terms, an RSI reading above 70 is usually seen as a signal to sell. However, the sell-offs typically do not necessarily come right after RSI jumps into the overbought zone.Related: 5 cryptocurrency projects that made waves in 2021Based on multiple RSI corrections spotted between August and September 2021, the FTM price appears to extend its upside momentum even after the indicator crosses above 70. At its best, the daily RSI had reached almost 89 on Sep. 9, coinciding with the FTM price hitting the then-record high of $1.99.FTM/USD daily price chart featuring RSI-led corrections. Source: TradingViewThat somewhat leaves FTM with the possibility of pursuing its IH&S profit target of $4.33 despite its overvaluation risks. What could follow is a correction towards its 20-day exponential moving average (20-day EMA; the green wave in the chart above) around $2.09.This would bring the price near to the VPVR support at $2.08, as discussed above.The views and opinions expressed here are solely those of the author and do not necessarily reflect the views of Cointelegraph.com. Every investment and trading move involves risk, you should conduct your own research when making a decision.

Čítaj viac

Bitcoin 'death cross' that pushed BTC price to $28.8K reappears

A technical sell signal is about to appear on the Bitcoin (BTC) daily chart.On Dec. 18, the BTC price will experience a death cross, a market indicator that occurs when a short-term moving average slips below a long-term moving average. In this case, Bitcoin’s 20-day exponential moving average (20-day EMA) will close below its 200-day exponential moving average (200-day EMA).The indicator may end up alerting traders and investors about a potential selloff in the coming sessions, given its history of predicting bear trends in advance. For instance, the 20-200 bearish crossover that appeared on May 30, 2021, was instrumental in crashing the BTC price from $36,500 to $28,800 in the next 24 days.BTC/USD daily price chart featuring May 2021 death cross. Source: TradingViewA similar death across also surfaced during March 2020’s pandemic-led market crash, exactly a day before the Bitcoin price dropped from nearly $8,000 to below $4,000.BTC/USD daily price chart featuring March 2020 death cross. Source: TradingViewBitcoin risks correction to $40K-42K rangeBitcoin has been correcting consecutively across the last four weeks and looks poised to close the ongoing weekly session in losses, as well, primarily with the Federal Reserve taking more aggressive action on inflation.In the last 30 days, the BTC price has fallen by nearly 17.50%, including a correction from its record high of $69,000 on Nov. 10. In doing so, the cryptocurrency briefly fell to $42,333, only to rebound sharply later, paring some losses, as shown in the chart below.BTC/USD daily price chart. Source: TradingViewNonetheless, the rebound did not turn into a bullish reversal — the Bitcoin price has been trending lower after finding an interim resistance near $50,000, a psychological level.Bitcoin’s efforts to retest $50,000 for a bullish breakout face opposition from its descending channel’s resistance trendline, combined with additional downside pressure from its 20-day EMA and 200-day EMA waves, which are also sitting near $50,000.Related: Bitcoin bears lack ‘balls’ to continue selling into 2022 — analystAs a result, the path of least resistance for Bitcoin appears to the downside. And with the death cross looming, the cryptocurrency would likely continue trending inside the descending channel to test levels around $42,000 for a strong pullback move.If the decline accelerates, the price may eye $40,000 next as its downside target.The RSI factorAnother leg lower would also push Bitcoin’s daily relative strength index (RSI) into its oversold territory below 30, a buying signal. For now, the momentum indicator has been attempting to break above its downward sloping trendline, a move that has earlier predicted Bitcoin’s local price bottoms.BTC/USD daily price chart featuring RSI breakouts. Source: TradingViewOn a shorter timeframe chart, the RSI has been consolidating sideways, anticipating that it would break out of the rectangle range to the upside. At the core of this optimistic outlook is a fractal from September 2021, shared by Mozzi, an independent crypto-market analyst.BTC/USD four-hour chart comparing RSI trends from Sep. 2021 and Dec. 2021. Source: TradingView”Bitcoin is following a similar structure from the end of September,” the analyst noted on Saturday. “Notice the RSI consolidation. Waiting on a clear break of the upper trendline as confirmation.”The views and opinions expressed here are solely those of the author and do not necessarily reflect the views of Cointelegraph.com. Every investment and trading move involves risk, you should conduct your own research when making a decision.

Čítaj viac
Načítava

Získaj BONUS 8 € v Bitcoinoch

nakup bitcoin z karty

Registrácia Binance

Burza Binance

Aktuálne kurzy