Značka: OKex

Crypto.com’s CRO is in trouble, but a 50% price rebound is in play

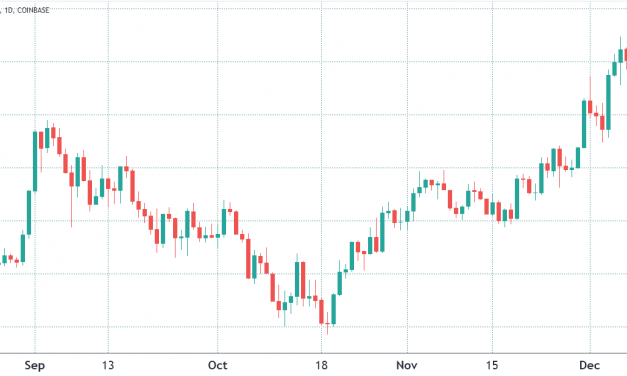
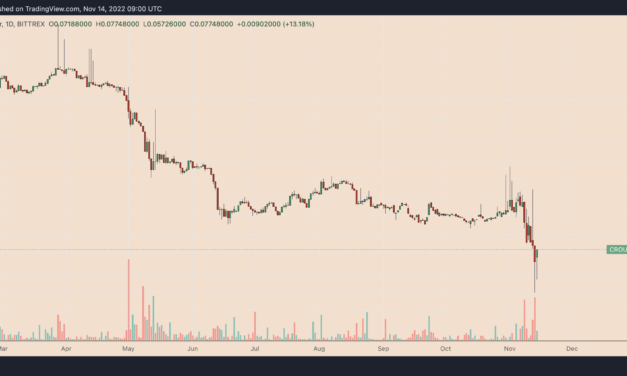
Crypto.com’s native token Cronos (CRO) is showing restraint on Nov. 14 against mounting sell-pressure building in the wake of the FTX’s dramatic collapse last week. Now, the CRO/USD pair is eyeing a watershed price recovery.On Nov. 14, CRO’s price wobbled between profits and losses, trading around $0.069 a day after crashing to $0.05, its lowest level since April 2020 — that’s a 60% price decline from November’s peak of around $0.178.CRO/USD weekly price chart. Source: TradingViewCRO funding rate drops to -3%The period of CRO’s price decline occurred alongside a sharp drop in the token’s perpetual futures funding rates.Funding rates are recurring payments made by traders based on the difference between the prices in the futures and the spot market. A positive funding rate means bullish traders (long positions) pay bearish traders (short positions), representing their confidence about a price rally.Conversely, a negative funding rate means short traders pay long traders to keep their positions open. On Nov. 14, CRO’s funding rates on Huobi and OKX dropped to minus 3%, showing traders are extremely bearish on the token.CRO funding rates history. Source: Coinglass.com“This is literally the exact same dynamic that occurred before Celsius and FTX collapsed,” warned Dylan LeClair, senior analyst at digital asset fund UTXO Management on Nov. 13, when CRO funding rates were near minus 2%.FTX contagion fears spread to Crypto.com The CRO sell-off started from fears of contagion amid the FTX fiasco, particularly concerns that Crypto.com, a Singapore-based crypto exchange, would collapse in the same manner as FTX.At the core of these worries is potential insolvency, with analysts pointing out that Crypto.com is holding low-liquid cryptocurrencies like Shiba Inu (SHIB) and its own token CRO as reserves, which reportedly make up 40% of the exchange’s total assets. 4.https://t.co/INIxikfNzy holds $1.6B worth of BTC/ETH/USDT/USDC/DAI/BUSD assets, accounting for 60%.40% of assets are low liquidity assets.— Lookonchain (@lookonchain) November 13, 2022In addition, Crypto.com also moved $210 million worth of stablecoins from Binance and Circle before demonstrating its reserves to the public. Binance CEO Changpeng Zhao confirmed the move, urging caution, the day before CRO dropped to its April 2020 low.If an exchange have to move large amounts of crypto before or after they demonstrate their wallet addresses, it is a clear sign of problems. Stay away. Stay #SAFU. — CZ Binance (@cz_binance) November 13, 2022

What’s more, Crypto.com also misconducted a $400 million Ether (ETH) transaction, sending it to a Gate.io exchange wallet instead of its cold storage. Later, the exchange did manage to recover the funds, but that also raised a lot of questions. Crypto_com CEO is claiming they “accidentally” sent $400 million of their eth to the wrong wallet.He’s either lying, or incompetent. https://t.co/hWXvPqBime— Coffeezilla (@coffeebreak_YT) November 13, 2022

Overall, Crypto.com saw its users withdraw $14 million in ETH and $39 million in other tokens over the weekend, according to data tracked by Argus Inc.50% Cronos price relief rally ahead?Strictly from a technical perspective, however, CRO’s price could nevertheless see a potential relief rally in the coming weeks.A set of indicators support the said bullish outlook, including CRO’s weekly relative strength index (RSI), which dropped to nearly 30, or nearly “oversold” territory. A similar drop in June earlier this year had preceded a 75% recovery rally from $0.099 to $0.162, as shown below.CRO/USD weekly price chart. Source: TradingViewThe other bullish indicator includes strong historical support of $0.061. In addition, CRO’s current price range of $0.061 and $0.111 has the token’s highest volume profile visible range (VPVR) on record. In other words, CRO price could recover to $0.111, up over 50% from the current price levels, as its next upside target. Related: Exchange outflows hit historic highs as Bitcoin investors self-custodyConversely, CRO/USD falling alongside funding rates suggests that its drop may have been driven by futures markets, which was also the case with Terra’s collapse in May. Thus, the persistent bearish sentiment across the entire cryptocurrency market could dampen CRO’s recovery prospects.The views and opinions expressed here are solely those of the author and do not necessarily reflect the views of Cointelegraph.com. Every investment and trading move involves risk, you should conduct your own research when making a decision.

Čítaj viac

Bitcoin price can’t find its footing, but BTC fundamentals inspire confidence in traders

Bitcoin’s (BTC) sudden crash on Jan. 10 caused the price to trade below $40,000 for the first time in 110 days and this was a wake-up call to leveraged traders. $1.9 billion worth of long (buy) futures contracts were liquidated that week, causing the morale among traders to plunge.The crypto “Fear & Greed” index, which ranges from 0 “extreme fear” to 100 “greed” reached 10 on Jan. 10, the lowest level it has been since the Mar. 2020 crash. The indicator measures traders’ sentiment using historical volatility, market momentum, volume, Bitcoin dominance and social media.As usual, the panic turned out to be a buying opportunity because the total crypto market capitalization rose by 13.5%, going from a $1.85 trillion bottom to $2.1 trillion in less than three days. Currently, investors seem to be digesting this week’s economic data that shows United States December 2021 retail sales going down by 1.9% compared to the previous month.Investors have reason to worry about stagflation, a scenario where inflation accelerates despite the lack of economic growth. However, even if this eventually proves that Bitcoin’s digital scarcity is a positive characteristic, markets will still take shelter with whatever asset is deemed safe. Thus, the first wave will potentially be damaging for cryptocurrencies.Top weekly winners and losers on Jan. 17. Source: NomicsBitcoin price was flat over the past seven days, effectively underperforming the altcoin market’s 7% gain. Part of this unusual movement can be explained by layer-1 decentralized applications platforms showing a positive performance that was driven by Fantom (FTM), Cardano (ADA), Near Protocol (NEAR) and Harmony (ONE).Loopring (LRC), a zkRollup open protocol for decentralized exchanges on Ethereum, presented the worst performance of the week. The DEX volume using the protocol peaked at $30 million per day in early December 2021, but is now near $6 million. Meanwhile, Dfinity (ICP) and Chainlink (LINK) are adjusting after a 40% or higher rally in the first 10 days of 2022.Tether’s premium and the futures premium held up wellThe OKEx Tether (USDT) premium or discount measures the difference between China-based peer-to-peer (P2P) trades and the official U.S. dollar. Figures above 100% indicate excessive demand for cryptocurrency investing. On the other hand, a 5% discount usually indicates heavy selling activity.OKEx USDT peer-to-peer premium vs. USD. Source: OKExThe Tether indicator bottomed at a 3% discount on Dec. 31, which is slightly bearish but not alarming. However, this metric has held a decent 2% discount over the past week, signaling no panic selling from China-based traders.To further prove that the crypto market structure has held, traders should analyze the CME’s Bitcoin futures contracts premium. That metric analyzes the difference between longer-term futures contracts to the current spot price in regular markets.Whenever this indicator fades or turns negative, it is an alarming red flag. This situation is also known as backwardation and indicates that bearish sentiment is present.BTC CME 2-month forward contract premium vs. Bitcoin/USD. Source: TradingViewThese fixed-month contracts usually trade at a slight premium, indicating that sellers request more money to withhold settlements for longer. As a result, futures should trade at a 0.5% to 2% premium in healthy markets, a situation known as contango.Notice how the indicator flipped negative on Dec. 9 as Bitcoin traded below $49,000 but it still managed to sustain a slightly positive number. This shows that institutional traders display a lack of confidence, although it is not yet a bearish structure.Considering that the aggregate cryptocurrency market capitalization is down 9.5% to date, the market structure held rather nicely. The CME futures premium would have gone negative if there had been excessive demand for short-sellers. Unless these fundamentals change significantly, there is not yet sufficient information available that would support calls for a sub-$40,000 Bitcoin price.The views and opinions expressed here are solely those of the author and do not necessarily reflect the views of Cointelegraph. Every investment and trading move involves risk. You should conduct your own research when making a decision.

Čítaj viac

Ether drops below $3,800, but traders are unwilling to short at current levels

Even though Ether (ETH) reached a $4,870 all-time high on Nov. 10, bulls have little reason to celebrate. The 290% gains year-to-date have been overshadowed by Dec.’s 18% price drop. Still, Ethereum’s network value locked in smart contracts (TVL) increased nine-fold to $155 billion.Looking at the past couple of months’ price performance chart doesn’t really tell the whole story, and Ether’s current $450 billion market capitalization makes it one of the world’s top 20 tradable assets, right behind the two-century-old Johnson & Johnson conglomerate.Ether/USD price at FTX. Source: TradingView2021 should be remembered by the decentralized exchanges’ sheer growth, whose daily volume reached $3 billion, a 340% growth versus the last quarter of 2020. Still, crypto traders are notoriously short-sighted, accentuating the impact of the ongoing downtrend channel.Derivatives markets do not reflect panic sellingTo understand whether bearishness has been instilled, one must analyze the futures’ funding rate. Perpetual contracts, also known as inverse swaps, have an embedded rate usually charged every eight hours. Those measures are established to avoid exchange risk imbalances. A positive funding rate indicates that longs (buyers) demand more leverage.However, the opposite situation occurs when shorts (sellers) require additional leverage, and this causes the funding rate to turn negative.Ether perpetual futures 8-hour funding rate. Source: Coinglass.comAs depicted above, the eight-hour fee has been ranging near zero in December, indicating a balanced leverage demand from buyers and sellers. Had there been some panic moments, it would have been reflected on such derivatives indicators.Top traders are increasing their bullish betsExchange-provided data highlights traders’ long-to-short net positioning. By analyzing every client’s position on the spot, perpetual and futures contracts, one can better understand whether professional traders are leaning bullish or bearish.There are occasional discrepancies in the methodologies between different exchanges, so viewers should monitor changes instead of absolute figures.Exchanges top traders Bitcoin long-to-short ratio. Source: CoinglassDespite Ether’s 9% correction since Dec. 24, top traders on Binance, Huobi and OKEx have increased their leverage longs. To be more precise, Binance was the only exchange facing a modest reduction in the top traders’ long-to-short ratio. The figure moved from 0.98 to 0.92. However, this impact was more than compensated by OKEx traders increasing their bullish bets from 1.67 to 3.20 in one week.Currently, there is hardly a sense of bearishness present in the market. According to the data, pro traders are buying the dip while retail investors’ net demand for shorts (sell) hardly changed throughout the past month. Of course, none of that can predict whenever Ether will flip the current descending channel, but one might infer that there’s little interest in betting on the downside from here.The views and opinions expressed here are solely those of the author and do not necessarily reflect the views of Cointelegraph. Every investment and trading move involves risk. You should conduct your own research when making a decision.

Čítaj viac

Data suggests traders view $46,000 as Bitcoin’s final line in the sand

Dec. 13 will likely be remembered as a “bloody Monday” after Bitcoin (BTC) price lost the $47,000 support, and altcoin prices dropped by as much as 25% within a matter of moments. When the move occurred, analysts quickly reasoned that Bitcoin’s 8.5% correction was directly connected to the Federal Open Market Committee (FOMC) meeting which starts on Dec. 15.Investors are afraid that the Federal Reserve will eventually start tapering, which simply put, is a reduction of the Federal Reserve’s bond repurchasing program. The logic is that a revision of the current monetary policy would negatively impact riskier assets. While there’s no way to ascertain such a hypothesis, Bitcoin had a 67% year-to-date gain until Dec. 12. Therefore, it makes sense for investors to pocket those profits ahead of market uncertainties and this could be connected to the current correction seen in BTC price.Top cryptos weekly performance on Dec. 13. Source: NomicsBitcoin price retraced 8.2% over the past week, but it also outperformed the broader altcoin market. That is in stark contrast to the last 50 days because the leading cryptocurrency’s market share (dominance) dropped from 47.5% to 42%. Investors could have simply fled to Bitcoin due to its relatively smaller risk than altcoins.Tether’s discount bottomed at 4%The OKEx Tether (USDT) premium or discount measures the difference between China-based peer-to-peer (P2P) trades and the official U.S. dollar currency. Figures above 100% indicate an excessive demand for cryptocurrency investing. On the other hand, a 5% discount usually indicates heavy selling activity.OKEx USDT peer-to-peer premium vs. USD. Source: OKExThe Tether indicator bottomed at 96% on Dec. 13, which is slightly bearish but not alarming for a 10% total cryptocurrency market capitalization drop. However, it has been over two months since this metric surpassed 100%, signaling a lack of excitement from China-based traders.To further prove that the Dec. 13 price crash only slightly impacted investor sentiment, the total liquidations over the 24 hours was $400 million.Total derivatives exchange liquidations on Dec. 13. Source: Coinglass.comMore importantly, only $300 million of long leverage contracts were forcefully terminated due to insufficient margin. This figure looks insignificant when compared to the Dec. 3 crash, when $2.1 billion of leveraged buyers had their positions closed.There’s no excessive demand from Bitcoin bears, at the momentTo further prove that the crypto market structure was not strongly affected by the sharp price drop, traders should analyze the perpetual futures. These contracts have an embedded rate and usually charge a fee every eight hours to balance the exchange’s risk. A positive funding rate indicates that longs (buyers) are demanding more leverage. However, the opposite situation occurs when shorts (sellers) require additional leverage, and this causes the funding rate to turn negative.Bitcoin perpetual futures 8-hour funding rate. Source: CoinglassConsidering that most cryptocurrencies suffered considerable losses on Dec. 13, the overall market structure held nicely. Had there been excessive demand for shorts who were betting on a Bitcoin price drop below $46,000, the perpetual futures 8-hour funding would have gone below 0.05%.Tether trading at a 4% discount in the China-based markets, $300 million in long contract liquidations and a neutral funding rate is not a sign of a bear market. Unless these fundamentals change significantly, there is no reason to call for $42,000 or lower Bitcoin prices.The views and opinions expressed here are solely those of the author and do not necessarily reflect the views of Cointelegraph. Every investment and trading move involves risk. You should conduct your own research when making a decision.

Čítaj viac

2 key Bitcoin trading metrics suggest BTC price has bottomed

Bitcoin (BTC) has been struggling to sustain the $47,500 support since the Dec. 4 crash, a movement that wiped out over $840 million in leveraged long futures contracts. The downside move came after the emergence of the Omicron variant of the Coronavirus and recent data showing U.S. inflation hitting a 40-year high. Bitcoin/USD price at FTX. Source: TradingViewWhile newcomers might have been scared by the 26% price correction over the past month, whales and avid investors like MicroStrategy added to their positions. On Dec. 9, MicroStrategy announced that they had acquired 1,434 Bitcoin, which increased their stake to 122,478 BTC.According to some analysts, the rationale behind Bitcoin’s weakness was the contagion fear that Evergrande, a leading Chinese property developer, defaulted on its US dollar debt on Dec. 9. The $1.1 Bitcoin billion options expiry on Dec. 10 also could have played an important factor because bears pocketed a $300 million profit.Margin traders are still extremely bullishMargin trading allows investors to leverage their positions by borrowing stablecoins and using the proceeds to buy more cryptocurrency. When those savvy traders borrow Bitcoin, they use the coins as collateral for shorts, meaning they are betting on a price decrease. That is why some analysts monitor the total lending amounts of Bitcoin and stablecoins to gain insight into whether investors are leaning bullish or bearish. Interestingly, Bitfinex margin traders slightly reduced their longs ahead of the Dec. 4 price crash. Bitfinex BTC margin long/total percentage. Source: CoinglassNotice that the indicator held a decent 90% favoring longs, meaning stablecoin borrowing was only 10% of the Bitfinex total. Furthermore, the margin longs recovered by 94% less than 24 hours after the price crash. This suggests that even if those investors were caught by surprise, most held their positions throughout the movement.To confirm whether this movement was specific to the instrument, one should also analyze options markets. The 25% delta skew compares similar call (buy) and put (sell) options. The indicator will turn positive when “fear” is prevalent as the protective put options premium is higher than similar risk call options.The opposite holds when market makers are bullish, causing the 25% delta skew to shift to the negative area. Readings between negative 8% and positive 8% are usually deemed neutral.Deribit Bitcoin options 25% delta skew. Source: laevitas.chThe 25% delta skew ranged near 6% ahead of the Dec. 4 Bitcoin crash, which is considered neutral. Over the next 3 days the options market makers and whales displayed moderate fear as the indicator peaked at 10%, but currently it stands at 3%.The Bitfinex margin long metric and the options main risk metric show few signs of stress in derivatives markets. Considering that these markets are more often used by pro traders, one can begin to believe in the narrative that Bitcoin will claim a new all-time high in early 2022.The views and opinions expressed here are solely those of the author and do not necessarily reflect the views of Cointelegraph. Every investment and trading move involves risk. You should conduct your own research when making a decision.

Čítaj viac

Data shows pro traders are currently more bullish on Ethereum than Bitcoin

Most traders have noticed that Ether (ETH) price has seriously outperformed Bitcoin (BTC) for months now and the ETH/BTC ratio has rallied more than 230% in 2021 and recently hit a new high at 0.089 BTC on Dec. 9. ETH/BTC pair at Coinbase. Source: TradingViewTo put things in perspective, Ether’s $490 billion market capitalization currently represents 54% of Bitcoin’s $903 billion. This ratio finished 2020 at a mere 15%, so it is safe to conclude that some ‘flippening’ has occurred. It might still be far from what Ethereum-maximalists imagined, but it is still quite a respectable run.Instead of analyzing the rationale for the move or, even worse, predicting the outcome based on some loose expectations, analysts should explore the market structure of each coin individually. For example, is the futures’ market premium facing a similar trend on both coins and how does the pro traders’ long-to-short ratio compare? These are the most relevant metrics to determine whether a movement has the strength to continue.The futures premium favors EtherQuarterly futures are the whales and arbitrage desks’ preferred instruments but because of their settlement date and the price difference from spot markets, they might seem complicated for retail traders. However, these quarterly contracts’ most notable advantage is the lack of a fluctuating funding rate.These fixed-month instruments usually trade slightly above spot market prices, indicating that sellers are requesting more money to withhold settlement longer. Consequently, futures should trade at a 5% to 15% annualized premium in healthy markets. This situation is known as “contango” and is not exclusive to crypto markets.Bitcoin and Ether futures basis. Source: Laevitas.chAfter comparing both charts, we can see that Bitcoin futures trade at an average 2.6% annualized premium for March 2022 and 4.4% for June 2022. This compares to Ether’s 2.9% and 5%, respectively. As a result, it becomes clear that whales and arbitrage desks are demanding a larger premium on Ether and this is a bullish indicator.Bitcoin’s long-to-short ratio declinedTo effectively measure how professional traders are positioned, investors should monitor the top traders’ long-to-short ratio at leading crypto exchanges. This metric provides a broader view of traders’ effective net position by gathering data from multiple markets.It is worth noting that exchanges gather data on top traders differently because there are multiple ways to measure clients’ net exposure. Therefore, any comparison between different providers should be made on percentage changes instead of absolute numbers.Bitcoin top traders long-to-short ratio. Source: CoinglassThe long-to-short ratio for top Bitcoin traders currently stands at a 1.21 ratio average, down from the 1.39 on Dec. 5. Compared to the 1.59 figure from two weeks ago, this signals that buyers (longs) reduced their exposure by 24%. Once again, the absolute number has less importance than the overall change in the time frame.Ether top traders long-to-short ratio. Source: CoinglassMeanwhile, Ether whales and arbitrage desks showed a positive sentiment change from Dec. 5 after the long-to-short moved to 1.16 from 1.0. When comparing the average data from Nov. 25, top Ether traders’ long-to-short have been cut by 20% from 1.43.Data shows Ether traders are more confident than Bitcoin tradersCurrent derivatives data favors Ether because the asset currently shows a higher futures basis rate. Furthermore, the improvement on the top traders’ long-to-short since Oct. 5 signals confidence at a delicate period when ETH price is down 16% from its $4,870 all-time high.Bitcoin investors may be lacking confidence as its price stands 31% below the $69,000 all-time high on Nov. 10. There’s no way to know whether this is a cause or consequence. Still, judging by the futures premium and long-to-short data Ether seems to have enough momentum to keep outperforming.The views and opinions expressed here are solely those of the author and do not necessarily reflect the views of Cointelegraph. Every investment and trading move involves risk. You should conduct your own research when making a decision.

Čítaj viac
Načítava

Získaj BONUS 8 € v Bitcoinoch

nakup bitcoin z karty

Registrácia Binance

Burza Binance

Aktuálne kurzy