Značka: Markets

Did Dogecoin bottom first? DOGE price poised for 20% gains as whales return

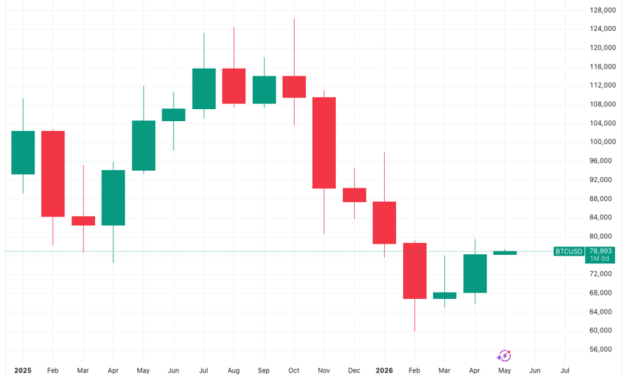
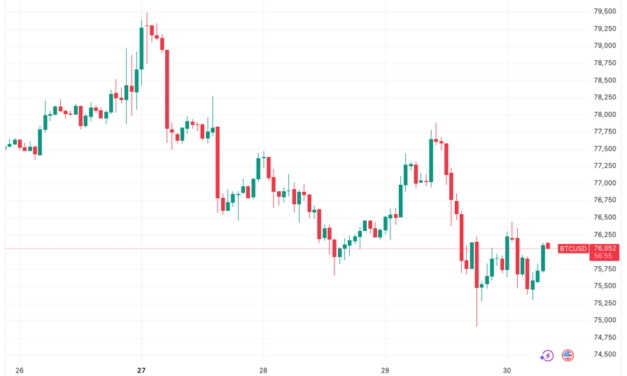
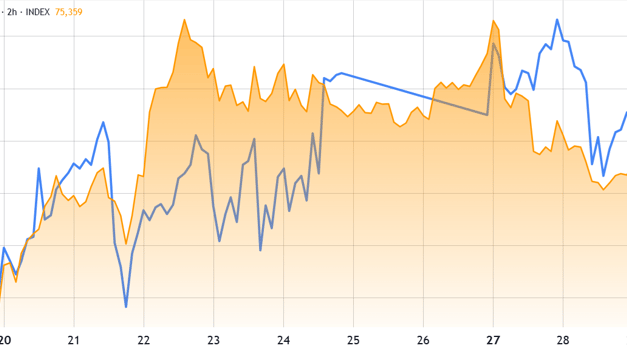
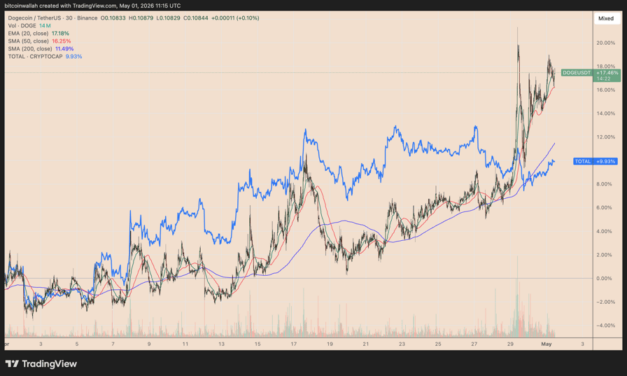
Dogecoin (DOGE) has outpaced the broader crypto market over the past month, rising roughly 18% versus the market’s 10% gain, as whale accumulation and a bullish chart setup hint at a potential bottom.DOGE/USDT vs. TOTAL crypto market cap 30-day returns. Source: TradingViewKey takeaways:DOGE whale holdings hit a record high as large transactions reached a six-month peak.DOGE’s triangle breakout targets $0.131, with $0.088 as the key invalidation level.DOGE whale holdings hit new high amid April price rallyDogecoin wallets holding at least 100 million DOGE controlled a record 108.52 billion DOGE, worth roughly $11.6 billion, as of late April, compared to under 107.95 billion DOGE in mid-April, according to data resource Santiment.Dogecoin whale transaction count and holdings. Source: SantimentThe accumulation coincided with DOGE’s 23.50% price rebound, suggesting large holders helped support the move.DOGE/USDT weekly chart. Source: TradingViewWhale activity also spiked. On April 28, Santiment recorded 739 Dogecoin transfers worth more than $100,000 in a single day, the highest count in six months. The surge came alongside the launch of 1Shares’ physically backed Dogecoin ETP on Xetra, Germany’s leading electronic trading platform.DOGE triangle breakout points to 20% upsideFrom a technical standpoint, the DOGE price has entered the breakout stage of what appears to be a descending triangle pattern.DOGE/USDT weekly chart. Source: TradingViewIn classical technical analysis, descending triangles signal persistent selling pressure. These structures usually resolve to the downside, but upside breakouts do occur, especially in broader accumulation trends.For instance, BTC formed a multi-month descending triangle in 2021 after the China mining crackdown.BTC/USD three-day price chart. Source: TradingViewThe structure leaned bearish, but price broke above the descending trendline near $35,0000, triggering a squeeze that led to a rally over $52,000 in the following weeks.Applying the same technical rule to DOGE charts puts its upside target for May at around $0.131, up about 20% from the current price. The level aligns with DOGE’s 200-week simple moving average (200-week SMA, the blue line).DOGE/USDT weekly chart. Source: TradingViewSuch a move would push Dogecoin above the average acquisition cost of large DOGE wallets holding more than 10,000 DOGE (green), currently near $0.115. It would also clear DOGE’s aggregate cost basis (black) around $0.132.Historically, reclaiming these cost-basis levels has preceded extended bullish phases, as more holders return to profit and selling pressure eases. DOGE realized price by wallet size. Source: GlassnodeConversely, a rejection near current levels, around the 20-week EMA (green) resistance, would weaken the bullish breakout case. Such a pullback could put DOGE at risk of revisiting its local low near $0.088 in May.This article is produced in accordance with Cointelegraph’s Editorial Policy and is intended for informational purposes only. It does not constitute investment advice or recommendations. All investments and trades carry risk; readers are encouraged to conduct independent research.

Čítaj viac

Bitcoin seals best monthly gain in a year as S&P 500 hits fresh all-time high

Bitcoin (BTC) eyed $77,500 on Friday after US stocks posted fresh record highs on strong tech earnings.Key points:Bitcoin continues a rebound after the monthly close as stocks hit record highs.Strong tech earnings propel the S&P 500 over 7,200 points for the first time in history.PCE inflation data nears its highest levels in three years, prompting speculation about next month’s numbers.Bitcoin creeps higher while S&P 500 makes historyData from TradingView showed near 12% April BTC price gains as risk assets ignored rising US inflation signs.BTC/USD one-month chart. Source: Cointelegraph/TradingViewThe S&P 500 reached nearly 7,220 points before closing ten points lower, propelled by stronger-than-expected earnings from Google and Apple.Reacting on X, trading resource The Kobeissi Letter noted that the S&P had added over $8 trillion in market cap since hitting local lows at the end of March.“A year ago it was at 5,600. 5 years ago it was at 4,200. 10 years ago it was at 2,100,” Charlie Bilello, chief market strategist at wealth manager Creative Planning, added.S&P 500 one-day chart. Source: Cointelegraph/TradingViewWhile Bitcoin’s gains were less pronounced, markets en masse appeared uninterested in US inflation warnings.The March print of the Personal Consumption Expenditures (PCE) came in at 3.5%, per data from the US Bureau of Economic Analysis (BEA), marking its highest since August 2023.Known as the Federal Reserve’s “preferred” inflation gauge, PCE had previously conformed to market estimates.“In the first month of the Iran War, US inflation hit a 3-year high,” Kobeissi commented. “April’s data will be interesting.”US PCE Indexes. Source: BEABTC price still struggling with support reclaimBitcoin thus closed out April’s monthly candle with mixed messages.Related: Bitcoin Coinbase Premium threatens bear flag repeat with BTC price at $76KAt 11.9%, BTC/USD saw its highest monthly gains in a year, CoinGlass data confirmed, but the monthly candle fell short of reclaiming key support lines.BTC/USD monthly returns (screenshot). Source: CoinGlassAs Cointelegraph reported, these included the 21-week exponential moving average (EMA), with only a single weekly close above it since last October.“The Bitcoin pullback continues and this is looking more and more like an EMA rejection, especially if BTC isn’t able to Weekly Close above the EMA by end of week,” trader and analyst Rekt Capital warned X followers on Wednesday.He added that a retest of the mid-$60,000 zone on weekly time frames was “technically necessary to achieve full breakout confirmation.”BTC/USD one-week chart. Source: Rekt Capital/XThis article is produced in accordance with Cointelegraph’s Editorial Policy and is intended for informational purposes only. It does not constitute investment advice or recommendations. All investments and trades carry risk; readers are encouraged to conduct independent research.

Čítaj viac

Bitcoin’s surge to $77K pressures shorts, but absent spot and long leverage caps rallies

Bitcoin (BTC) traders pushed the price to $77,400, but data suggests profit-taking may thwart the bull’s goal of turning the $77,000 to $80,000 zone into support. Orderbook data from TRDR shows over $130 million in asks extending from $76,700 to $79,300. BTC/USDT Binance perps orderbook. Source. TRDR.ioGiven Bitcoin’s negative futures funding rate and the small negative long-short delta (-$1.47 million at the time of writing), bulls have a slight edge in the short-term. The situation could shift further in their favor if the BTC price pushes into short liquidity starting at $76,800, where there is a -$66.5 million to -$189 million negative delta, meaning short positions face a significantly higher risk of forced closure.BTC/USDT long-short-delta. 7-day lookback. Source: HyblockFrom a technical analysis perspective, the current price action saw Bitcoin lock in $75,000 as support through a confirmed support-resistance flip, and it also traded back above the 20-day moving average ($76,067) after falling below it on Wednesday and Thursday. Related: Repeat Bitcoin profit taking near $77K suggests rally is losing steamIn the short-term, the most desirable outcome for bulls would be a repeat of this week’s price action, where, in this case, BTC rallies through the channel trendline resistance at $79,000, followed by another SR-flip to confirm $80,000 as support. BTC/USDT 1-day chart. Source: TradingViewBeyond the expected profit-taking kicking in at $77,000, a volume spike in either spot or perpetual futures markets is the missing ingredient to absorb the selling and extend BTC’s breakouts. As shown in the TRDR chart below, the bulk of BTC’s intraday moves stem from liquidations and the absence of sustained spot volume and long leverage, resulting in rallies that lack duration.  BTC/USDT perps (Binance), 4-hour chart. Source: TRDR.io This article is produced in accordance with Cointelegraph’s Editorial Policy and is intended for informational purposes only. It does not constitute investment advice or recommendations. All investments and trades carry risk; readers are encouraged to conduct independent research.

Čítaj viac

Spot Bitcoin ETF outflows top $490M: Is BTC’s rally losing momentum?

Key takeaways:Spot Bitcoin ETFs saw $490 million in net outflows over three days, signaling a recent dip in institutional demand.Rising inflation is eroding real yields on fixed income, likely fueling long-term demand for scarce assets like BTC.Bitcoin (BTC) faced three consecutive days of outflows from US-listed spot exchange-traded funds (ETFs). The outflows coincided with a failed attempt to reclaim $78,000. Traders fear more downside, but heightened US inflation will likely act as a catalyst for further bullish momentum.US-listed Bitcoin spot ETFs daily net flows, USD. Source: SoSoValueThe US-listed spot Bitcoin ETFs saw $490 million net outflows between Monday and Wednesday, reversing the trend from the prior two weeks, which indicates a decline in institutional demand. Still, a longer-term perspective shows $3.3 billion net inflows since March.S&P 500 futures (left) vs. Bitcoin/USD (right). Source: TradingViewPart of the lack of confidence among traders can be attributed to the 14% year-to-date decline in Bitcoin’s price, while the S&P 500 soared to an all-time high. However, the tech sector came under scrutiny as quarterly earnings releases failed to impress investors. Meta (META US) faced a 9% correction on Thursday, while Microsoft (MSFT US) shares dropped 4%.Brent crude oil (left) vs. US 5-year Treasury yield (right). Source: TradingViewSince the war in Iran started in late February, oil prices have been a major driver for risk appetite. The latest Brent crude oil rally to $126 coincided with yields on the US 5-year Treasuries jumping to 4.02%, up from 3.51% two months prior. Traders demanded higher yields on government-backed bonds amid upward pressure on inflation, triggering risk-off sentiment.Higher inflation favors Bitcoin’s bullish momentumBitcoin’s lack of bullish momentum near $78,000 can also be pinned to worsening economic conditions. The US Commerce Department reported that gross domestic product grew at a 2% seasonally adjusted annualized rate in the first quarter, slightly below the 2.3% rate economists projected, according to CNN.Related: Most crypto investors believe Bitcoin is undervalued–Coinbase surveyStrategy (MSTR US) latest Bitcoin acquisitions. Source: StrategyStrategy, the company led by Executive Chairman Michael Saylor, announced the acquisition of 56,235 BTC in the first four weeks of April, driving its average cost to $75,537. Traders fear that the Bitcoin price could suffer if the Strategy accumulation pace does not hold up, even if only temporarily.US President Donald Trump’s family’s activities in the cryptocurrency market have also hurt the industry’s appeal. Three US Senators demanded an inquiry into Trump and his family’s profits from their cryptocurrency ventures.The risks of higher inflation and lower economic growth are unlikely to dissipate in the near term, but the mere three-day sequence of net outflows from Bitcoin ETFs should not be a source of concern. Ultimately, reduced returns on fixed income, when adjusted for inflation, will likely drive demand for scarce alternative assets. Thus, the Bitcoin path to $80,000 remains intact.This article is produced in accordance with Cointelegraph’s Editorial Policy and is intended for informational purposes only. It does not constitute investment advice or recommendations. All investments and trades carry risk; readers are encouraged to conduct independent research.

Čítaj viac

Repeated Bitcoin profit taking near $77K suggests rally is losing steam

Bitcoin’s (BTC) attempt to trade above $77,000 have failed multiple times over the past week, despite traders managing a one-day breakout to $79,500. Data show short-term holders taking profits as the rally peaked, sending 150,000 BTC to exchanges since April 15. Crypto analyst Darkfost noted the continued fragility among short-term holders (STHs), or wallets holding BTC for less than 155 days. As the price rose over the past two weeks, BTC transfers from these wallets to exchanges increased.Three consecutive sessions saw 65,000 BTC, 54,600 BTC and 39,000 BTC sent to exchanges and these flows may have prevented Bitcoin from overtaking the resistance level at $80,000.BTC short-term holder supply to exchanges. Source: CryptoQuantSpot volumes also declined sharply. BTC activity has dropped to levels last seen in September 2023, near the end of the previous bear phase. Binance recorded a monthly decline of about $25 billion in volume. Gate.io also saw a $13 billion drop, while OKX volumes fell by roughly $6 billion.This indicates weaker investor conviction to build spot exposure at current price levels. Darkfost explained, “This contraction in volumes therefore reflects a temporary loss of interest in Bitcoin. While declining spot volumes can suggest negative short-term momentum, these phases of apathy are also often where new opportunities begin to emerge.”BTC spot trading volume. Source: CryptoQuantRelated: Bitcoin Coinbase Premium threatens bear flag repeat with BTC price at $76KBitcoin needs fresh demand from leveraged tradersBitcoin researcher Axel Adler Jr. highlighted a shift in liquidation pressure, with the seven-day oscillator turning positive and reaching +28.7 by April 30. Both the long and short positions have been squeezed more frequently, with total crypto liquidations reaching $604 million over the past 24 hours.  Bitcoin futures long-short liquidations dominance. Source: CryptoQuantThe shift supports the price in the near term. The 30-day average remains slightly negative, keeping the broader bias tied to prior long liquidations.Open interest shows where traders’ urgency may be lacking. The seven-day average dropped to about 292,000 BTC from above 300,000 BTC. Around 8,000–9,000 BTC in leverage has been removed over the past 10 days, with daily changes still negative.The price continues to press against $77,000, with no rise in participation. A stronger move higher would likely require open interest to increase and spot volumes to expand, signaling new capital entering the market rather than futures positions being forced to close.Related: Bitcoin analysts explain why BTC price can’t take out $80KThis article is produced in accordance with Cointelegraph’s Editorial Policy and is intended for informational purposes only. It does not constitute investment advice or recommendations. All investments and trades carry risk; readers are encouraged to conduct independent research.

Čítaj viac

Bitcoin’s $75K cost basis emerges as key support zone for current bull trend

Bitcoin (BTC) is trading at $76,350, which is above several key investors’ cost-basis levels. The one-to-three-month holder average sits at $75,620, placing a large share of recent buyers near breakeven, while the price sits just below the US spot exchange-traded fund (ETF) cost basis of $76,700. The short-term holder (STH) cost basis and the adjusted realized price extend on either side of this range, increasing the importance of the $75,000 level as a near-term support pivot. BTC cost basis cluster tightens near $75,000The one-to three-month holder cohorts share an average cost basis of $75,620. That level capped the price earlier in March when BTC fell to $62,000 from $75,600 in two weeks, but now it aligns as a potential support pivot.BTC realized price excluding more than a seven-year supply. Source: CryptoQuantBitcoin has also closed above the adjusted realized price at $72,300. This metric tracks the average acquisition cost of circulating supply, excluding coins held for more than seven years. A move above it places a large share of investors above the break-even level. Crypto analyst Darkfost noted that a weekly close above the adjusted realized price on April 19 signaled stronger long-term investor conviction in Bitcoin. The analyst added, “A truly bullish signal would be for Bitcoin to start building a standard deviation above this average cost basis, pushing more investors into profit and encouraging them to hold due to increased conviction.”US spot ETF positioning adds an institutional cost basis level. The weighted average cost basis of US spot Bitcoin ETFs sits near $76,700, placing the price close to a key area of recent institutional accumulation. The short-term holder’s cost basis is near $81,800, a level at which investors could build more conviction if the price holds above it. Bitcoin cost basis for STH, US ETF, and LTH. Source: CryptoQuantTogether, these overlapping cost bases compress around $75,000, concentrating both realized and unrealized positioning in a narrow price range. This clustering increases price sensitivity to flows near this level, making it a key support zone.Related: Bitcoin eyes $75K after ‘most hawkish’ FOMC as oil hits highest since 2022BTC liquidity bands outline the near-term rangeWith the support level established at $75,000, the derivatives data outlines a tight liquidity corridor. Cumulative long liquidation risk nears $74,000, with roughly $2.69 billion at risk, while short liquidations near $80,000 total about $4.48 billion. Bitcoin exchange liquidation map. Source: CoinGlassA recent swing between $77,873 and $74,868 on Wednesday cleared $494 million in positions, including $347 million in longs.Crypto analyst CW said the high-leverage longs have been reduced, while a larger pool of short liquidations sits above $80,000. The $74,000 to $80,000 band continues to anchor positioning, with both sides clustering around key cost-basis levels.Related: Most crypto investors believe Bitcoin is undervalued: Coinbase surveyThis article is produced in accordance with Cointelegraph’s Editorial Policy and is intended for informational purposes only. It does not constitute investment advice or recommendations. All investments and trades carry risk; readers are encouraged to conduct independent research.

Čítaj viac

Bitcoin Coinbase Premium threatens bear flag repeat with BTC price at $76K

Bitcoin (BTC) rebounded above $76,000 at Thursday’s Wall Street open while traders stayed bearish on the short-term BTC price outlook.Key points:Bitcoin’s Coinbase Premium Index flips negative as analysis warned the January breakdown could repeat.BTC price action is already at risk of repeating a bear flag breakdown to new macro lows.The April monthly close should still offer Bitcoin’s best gains in a year.Bitcoin Coinbase Premium risks repeating bearish historyData from TradingView showed 1% daily gains after initial pressure over high oil prices and a hawkish US Federal Reserve meeting the day prior.BTC/USD one-hour chart. Source: Cointelegraph/TradingViewWith US stocks treading water, Bitcoin market participants saw little reason to flip bullish on shorter time frames. Among the concerns was the Coinbase Premium — the difference in price between Coinbase’s BTC/USD and Binance’s BTC/USDT pairs.“Bitcoin’s ripping higher… but the selling on Coinbase is getting DEEPER by the minute,” X user Against Wall Street wrote. A negative Coinbase Premium implies insufficient demand for Bitcoin during US trading hours, with price action normally suffering as a result. In January, a relief bounce on BTC/USD combined with a steepening negative Premium, and the pair ultimately broke to new macro lows.Bitcoin Coinbase Premium Index. Source: CryptoQuant“We’ve seen this exact movie before, and spoiler alert: everybody already knows how it ends,” Against Wall Street continued, referring to January’s events.As Cointelegraph reported, then, as now, price formed a so-called “bear flag” construction on the daily chart — a warning to buyers that a breakdown could occur.BTC teases best monthly price gains since April 2025Other traders also felt the need for caution, with trader CJ seeing little sign of a long-term floor already being in place. Related: Bitcoin, stocks risk ‘months’ of losses as Kevin Warsh Becomes Fed chairA chart uploaded to X on the day included a potential target of $65,000.“I think even if we are putting in a bottom here, we *at least* see something like this,” they commented. “This would be my bullish outlook. I’m ultimately waiting on April close to refine.”BTC/USD one-day chart. Source: CJ/XThe monthly close was set to offer 11.6% gains for April at the time of writing — still Bitcoin’s best performance in a year, per data from CoinGlass.BTC/USD monthly returns (screenshot). Source: CoinGlassThis article is produced in accordance with Cointelegraph’s Editorial Policy and is intended for informational purposes only. It does not constitute investment advice or recommendations. All investments and trades carry risk; readers are encouraged to conduct independent research.

Čítaj viac

Bitcoin analysts explain why BTC price can’t take out $80K

Bitcoin (BTC) rebounded 32% to a 10-week high of $79,500 on April 22 from its sub-60,000 multi-year low. But recent buyers took advantage of the rally to exit as the price has since corrected to $76,000 on Thursday, with $80,000 proving a tough barrier to break.Key takeaways:Bitcoin sell pressure risk exists around $80,000, a resistance level that may delay the bulls.Short-term holders and Bitcoin ETF investors keep selling, frustrating recovery attempts.Bitcoin price can’t crack $80,000As Cointelegraph reported, Bitcoin failed to break above $80,000 as its rebound fell short of a bull market comeback.This is due to the resistance zone between the True Market Mean at $78,000 and the Short-Term Holder (STH) cost basis at $79,000, which continues to cap upward momentum, as recent buyers used this range to exit near breakeven.“This behavior is a textbook pattern in bear markets, where price approaches the breakeven level of the most price-sensitive cohort, the incentive to exit positions overwhelms incoming demand, exhausting upside momentum,” Glassnode said in its latest Week Onchain newsletter, adding:“With this rejection confirming overhead resistance, the mid-term bias tilts toward further downward pressure.”Bitcoin STH cost basis model. Source: GlassnodeBitcoin’s cost basis distribution data shows that investors hold about 475,301 BTC at an average cost of $77,800-$80,880, reinforcing the significance of this resistance zone.Traders say the BTC/USD pair must flip the resistance at $80,000 into support to target higher highs toward $84,000.After reclaiming the 50-day and 100-day simple moving averages, BTC/USD has sent “one bottoming signal after another firing on higher timeframes,” technical analyst SuperBitcoinBro said in a Wednesday post on X, adding:“But I agree it needs to get past 80K.”Daan Crypto Trades said the $80,000 level remains the “main level for the bulls in the short/mid term.”BTC/USD daily chart. Source: X/Daan Crypto TradesAs Cointelegraph reported, Bitcoin breaking $80,000 would signal that the bulls are still in control, paving the way for the next big resistance at $84,000.BTC selling by short-term holders halts rally Additional onchain data shows “heavy distribution” by short-term holders, as these investors booked profits on Bitcoin’s recent rally to $80,000.The 24-hour SMA of STH Realized Profit shows that as the price approached the $80,000 level, recent buyers realized profits at a rate of $4 million per hour. The 24-hour SMA of STH Realized Profit is a real-time measure of how aggressively recent buyers are realizing gains.The metric spiked as high as $7.2 million per hour on April 15, about roughly “four times the base level that had established itself since mid-April, confirming that short-term holders seized the rally as a distribution opportunity,” Glassnode said, adding:“The buy side simply lacked sufficient liquidity to absorb this wave of profit realization, capping momentum and triggering the subsequent rejection.”Bitcoin Entity-Adjusted STH realized profit. Source: GlassnodeMore selling pressure came from US spot Bitcoin exchange-traded funds, which have recorded outflows for three consecutive days, totaling $390 million.This marked the longest outflow streak since March 20, when a three-day outflow streak accompanied an 11.5% BTC price drop after rejection at $76,000. Spot BTC ETF flows chart. Source: SoSoValueAnalysts at Wise Advise said that the return to spot BTC ETF outflows after a nine-day inflow streak is the first sign that “the local top may be in.”This article is produced in accordance with Cointelegraph’s Editorial Policy and is intended for informational purposes only. It does not constitute investment advice or recommendations. All investments and trades carry risk; readers are encouraged to conduct independent research.

Čítaj viac

Did Bitcoin bottom versus gold? BTC price will reach $167K in 2027 if history repeats

Bitcoin (BTC) may undergo a massive rally, based on a recurring gold chart pattern, with gains of up to 180% over the next 12 months.Key takeaways:BTC is up nearly 40% versus gold since March after falling for seven months in a row.Similar BTC/XAU recoveries have historically coincided with Bitcoin bottoms in US dollar terms.BTC may hit $167,250 within a yearThe bullish signal comes from the Bitcoin-to-gold ratio (BTC/XAU), which tracks BTC’s performance relative to gold in US dollar terms. Historically, sharp rebounds in this ratio have aligned with major Bitcoin cycle bottoms, often preceding strong upside.In 2015, a BTC/XAU bottom preceded a roughly 250% Bitcoin rally within a year. Similar reversals in 2019 and 2022 came before gains of around 140% each. Excluding 2020’s 1,460% liquidity-driven boom, the pattern points to an average one-year BTC gain of about 180% after BTC/XAU bottoms.BTC/XAU monthly chart. Source: TradingViewAs of 2026, the BTC/XAU ratio has climbed about 40% since February’s lows. The BTC/USD rate has jumped 32.65% in the same period.”Bitcoin versus gold is about to close a second month in the green after 7 red candles in a row,” said Nik Bhatia, founder of macro research firm The Bitcoin Layer, adding that “the bounce is in.”Macro strategist Gert van Lagen spotted a “hidden bullish divergence” pattern that appeared following the 2014, 2018, and 2022 bear market bottoms.Source: XIn its April report, meanwhile, Fidelity Investments said Bitcoin has entered “an accumulation phase” while outperforming gold.A 180% repeat of past cycles puts the BTC price target at $167,250 by April 2027, if the BTC/USD and BTC/XAU February lows are confirmed as bottoms.Multiple analysts, including Bernstein’s Gautam Chhugani, have projected BTC’s price to reach the $150,000 mark in 2026, driven largely by a potential capital rotation from gold.In April, Matt Hougan, chief investment officer of crypto asset manager Bitwise, said Bitcoin can become bigger than the gold market’s $30 trillion capitalization.Key trend line puts bullish outlook in doubt BTC/XAU remains below its 100-month exponential moving average (100-month EMA, the purple line), a level that previously marked major bottoms in March 2020 and December 2022. BTC/XAU monthly chart. Source: TradingViewIts January breakdown was the first clear loss of this support. Staying below it risks trapping bulls and delaying Bitcoin’s relative recovery against gold.In the short term, BTC/XAU also faces resistance from a rising wedge on the daily chart. BTC/XAU daily chart. Source: TradingViewThe bearish reversal setup points to a potential 20% drop in Bitcoin’s gold-denominated value, based on the wedge’s measured move.Related: Bitcoin eyes $75K after ‘most hawkish’ FOMC as oil hits highest since 2022Macro conditions, such as elevated US bond yields and rising oil prices, may also disrupt historical patterns. As Cointelegraph reported, Bitcoin derivatives show traders are cautious as the Fed holds interest rates and BTC price consolidates. This article is produced in accordance with Cointelegraph’s Editorial Policy and is intended for informational purposes only. It does not constitute investment advice or recommendations. All investments and trades carry risk; readers are encouraged to conduct independent research.

Čítaj viac

Ethereum to $60K? It's a 'generational play' for ETH bull Tom Lee, says analyst

Fundstrat co-founder Tom Lee shared a “generational play” thesis for Ethereum that predicts 3,000% upside in Ether (ETH) price to $60,000.Key takeaways:ETH is testing a key long-term support trend line that preceded 5,000% gains in the past.Tom Lee amplified the fractal setup, which projects ETH toward $60,000 by 2030.ETH price chart: Giant ascending channel targets $60,000 On Wednesday, Lee reposted a bullish outlook shared by analyst Crypto Patel that predicted ETH’s price reaching $60,000 in the coming years.The setup showed a long-term ascending channel that has framed ETH’s price action since 2017, with its upper and lower trend lines repeatedly acting as resistance and support across multiple market cycles.ETH/USD two-week chart. TradingView/CryptoPatelIn 2020, for example, ETH rebounded from the channel’s lower trend line before rallying roughly 5,200% toward the upper boundary, where the cycle eventually topped.Again, as of late April, ETH’s price stabilized around the lower trend line, an “accumulation zone” spanning $1,300–$2,000. Patel highlighted a potential multi-year price rebound in the making, calling it a “generational play” for “patient holders.” His chart projected a 1,000% rise in ETH to around $15,800 by 2028 and 3,150% to $60,000 by 2030.Related: These 3 Ethereum metrics favor an ETH price rally to $6KLee reposted Patel’s bullish outlook after BitMine, the Ethereum treasury firm he chairs, purchased $235 million worth of Ether, lifting its net Ether reserves above 5 million ETH, or roughly 4% of the current Ethereum supply.BitMine’s Ethereum holdings chart. Source: CoinGeckoThe buying spree underscores BitMine’s aggressive ETH accumulation strategy, even as the company remains exposed to sharp market swings. As of late April, its unrealized losses on the investments stood at around $6.5 billion.Ethereum bears will have other plansSince 2021, Ether has traded inside a giant symmetrical triangle, a neutral pattern that can break in either direction. It briefly moved above the structure in July 2025, but the breakout failed, sending the price back inside the range. ETH/USD weekly chart. Source: TradingViewA decisive breakdown below the lower trend line, now near the 0.786 Fibonacci retracement around $1,834, would weaken the bullish case. Losing this support could open the door to a deeper decline toward the 1.0 Fib line at around $1,000, aligning with downside targets flagged by several bearish analysts earlier this year.In this case, BitMine could see its unrealized loss swell to roughly $13.2 billion, based on an estimated average ETH acquisition cost of around $3,600 across its holdings until April.Still, longer-term Ethereum forecasts remain optimistic, with VanEck and Standard Chartered projecting upside targets of up to $22,000 and $40,000, respectively, in their more bullish scenarios.This article is produced in accordance with Cointelegraph’s Editorial Policy and is intended for informational purposes only. It does not constitute investment advice or recommendations. All investments and trades carry risk; readers are encouraged to conduct independent research.

Čítaj viac

Bitcoin eyes $75K after 'most hawkish' FOMC as oil hits highest since 2022

Bitcoin (BTC) failed to recover new support on Thursday as oil hit its highest levels in nearly four years.Key points:Bitcoin struggles to recoup recent lost ground as geopolitical factors weigh on momentum.UK Brent crude oil spot markets record their highest levels since June 2022.The Federal Reserve’s interest-rate decision is called Chair Jerome Powell’s “most hawkish in years.”Bitcoin falls on “most hawkish” Fed meetingData from TradingView showed BTC/USD circling $76,000, down around 2% from the previous day’s high.BTC/USD one-hour chart. Source: Cointelegraph/TradingViewA combination of high oil prices and the US Federal Reserve’s “most hawkish” meeting in years kept risk-asset optimism low.Both were a result of the ongoing US-Iran war, which showed no sign of resolution.“Iran can’t get their act together. They don’t know how to sign a nonnuclear deal. They better get smart soon!” US President Donald Trump wrote in one of his latest posts on Truth Social.Source: Truth SocialAmid the tensions, spot Brent crude oil passed $120 per barrel for the first time since June 2022.“Asia is facing its worst even crisis in history and Europe has just weeks worth of jet fuel left. The US is exporting record amounts of oil as a result,” trading resource The Kobeissi Letter responded in a post on X. “Inflation is back.”Spot Brent crude oil one-month chart. Source: Cointelegraph/TradingViewInflation worries were among the guiding factors for Fed officials at Wednesday’s Federal Open Market Committee (FOMC) meeting, where they left interest rates unchanged.While markets expected that outcome, commentators noted a worsening outlook for risk appetite due to changing Fed policy.Nic Puckrin, CEO and cofounder of crypto education platform Coin Bureau, described the FOMC meeting — the last with Jerome Powell as Chair — as his “most hawkish in years.”“For the first time since 1992, 4 Federal Reserve members dissented the decision,” he noted.US two-year Treasury yield versus Fed funds rate futures. Source: Nic Puckrin/XPuckrin suggested that the Fed’s “soft landing” policy on inflation had also gone. “Rates held for the third straight meeting, but the direction of travel just changed,” he summarized.Source: Truth SocialTrump repeated attacks on Powell after the decision, calling him “too late” in cutting rates ahead of the likely takeover by Kevin Warsh.As Cointelegraph reported, Trump said that he “would” be disappointed if Warsh did not cut rates at his first FOMC meeting in June.BTC price 21-day trend line hangs in the balanceBTC price action still managed to respect the 21-day simple moving average (SMA) near $75,500 overnight.Related: First 21-week trend line reclaim since October 2025: Five things to know in Bitcoin this weekThat support line was the key question for trading resource Material Indicators on low time frames.“Will support hold?” it queried in an X post alongside order-book liquidity data for Binance.The data showed whale order classes broadly buying the dip, while smaller order classes reduced exposure.BTC/USDT order-book data (Binance) with whale orders. Source: Material Indicators/XThis article is produced in accordance with Cointelegraph’s Editorial Policy and is intended for informational purposes only. It does not constitute investment advice or recommendations. All investments and trades carry risk; readers are encouraged to conduct independent research.

Čítaj viac

Bitcoin futures signal caution as long-to-short ratio signals positioning shift

Key takeaways:Negative Bitcoin funding rates indicate bearishness, yet whales maintain steady long-to-short ratios at major exchanges.Inflation concerns and tech corporate earnings remain the biggest drivers for Bitcoin traders’ sentiment.Bitcoin (BTC) faced rejection at $77,800 on Wednesday, then retested the $76,000 level. This movement followed a correction in the S&P 500 Index as the war in Iran reached its 60-day mark, driving crude oil prices toward $118. While demand for leveraged bearish Bitcoin futures positions increased, the long-to-short ratio of whales at major exchanges indicates a different trend.S&P 500 Index futures (left) vs. Bitcoin/USD (right). Source: TradingViewBitcoin’s lack of bullish momentum above $78,000 mirrors the S&P 500 Index’s struggle near 7,200. Trader skepticism stems in part from the inflationary impact of high energy prices, which diminishes consumer spending and corporate earnings through higher logistics costs. Additionally, investors are questioning the profitability of technology companies’ investments in AI, according to Yahoo Finance.Bitcoin futures show bulls lacking confidenceSetting aside the specific reasons for investor caution, the Bitcoin perpetual futures funding rate turned negative on Wednesday. This followed a brief neutral-to-bullish period on Tuesday. In a healthy market, this rate usually stays between 6% and 12% to cover capital costs, which means buyers typically pay a fee to maintain their positions. A negative rate suggests a shift toward sellers.Bitcoin perpetual futures annualized funding rate. Source: LaevitasThe Bitcoin perpetual futures funding rate has remained mostly negative over the past two weeks, indicating increased demand for leveraged short positions. While this data initially suggests a lack of confidence among buyers, a closer examination of whale positioning is necessary. The top traders’ long-to-short ratio across exchanges includes spot, margin, and futures data, offering a more comprehensive perspective.Top traders’ long-to-short ratio and Binance and OKX. Source: CoinglassThe long-to-short ratio for professional traders on Binance was 0.80, showing a minor improvement from the 0.75 level recorded on Tuesday, though it remains slightly bearish. At OKX, top traders have briefly signaled bullish sentiment several times since Friday, but these shifts have been temporary. Nevertheless, there is no evidence that whales are turning increasingly bearish, as the long-to-short ratio has held steady throughout the past week.The latest US Federal Reserve statement after Wednesday’s meeting observed that “inflation is elevated, in part reflecting the recent increase in global energy prices.” The FOMC chose to keep interest rates at their late 2025 levels, even though four members supported a 0.25% cut. According to CNBC, this marks the first time four FOMC members have dissented since October 1992.Related: Bitcoin’s recent rally is largely fueled by Strategy purchases: Bitwise’s HouganBitcoin bulls’ lack of conviction should not be mistaken for bearishness, particularly as Strategy (MSTR US) continues its accumulation. Over the last four weeks, Strategy acquired 56,235 BTC, a move supported by the issuance of its perpetual preferred security, STRC. The company currently holds 818,334 BTC, exceeding the position of BlackRock’s IBIT exchange-traded fund (ETF).Professional traders remained unmoved by Bitcoin’s decline to $75,000 on Wednesday, as indicated by exchange long-to-short ratios. However, the persistent negative funding rate in Bitcoin futures suggests that sentiment remains cautious. Macroeconomic and tech corporate earnings remain the biggest driver for Bitcoin traders’ sentiment.This article is produced in accordance with Cointelegraph’s Editorial Policy and is intended for informational purposes only. It does not constitute investment advice or recommendations. All investments and trades carry risk; readers are encouraged to conduct independent research.

Čítaj viac
Načítava

Získaj BONUS 8 € v Bitcoinoch

nakup bitcoin z karty

Registrácia Binance

Burza Binance

Aktuálne kurzy