Značka: Markets

Most crypto investors believe Bitcoin is undervalued: Coinbase survey

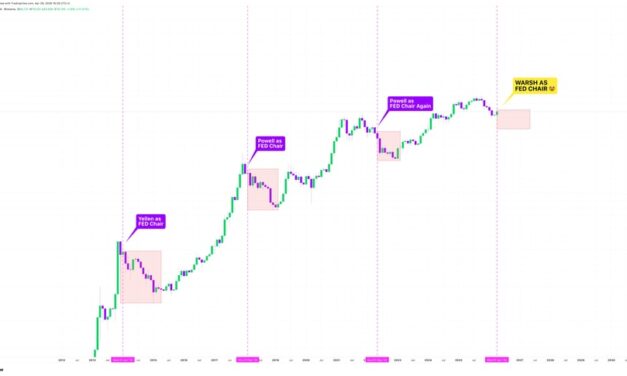
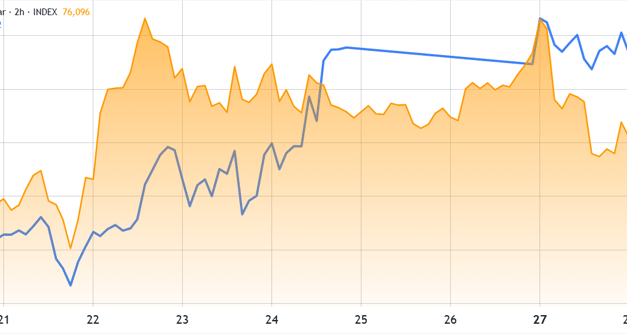
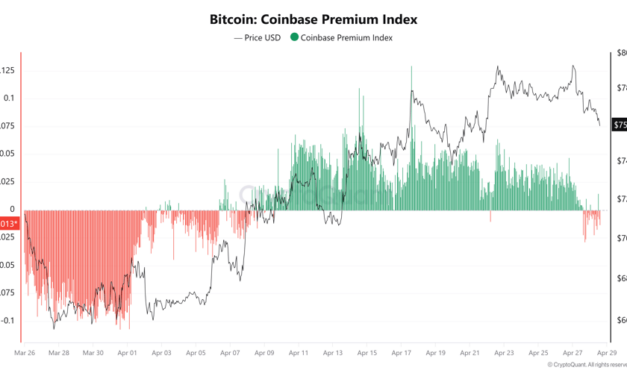
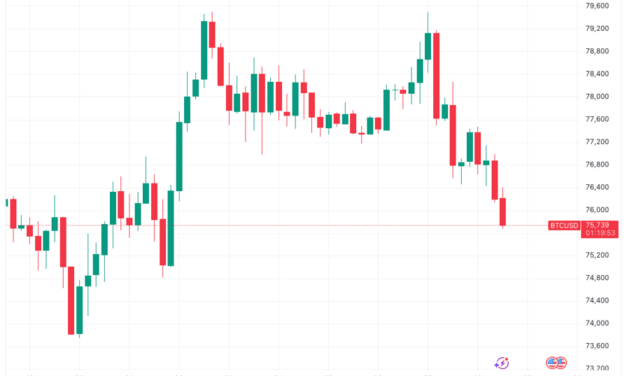
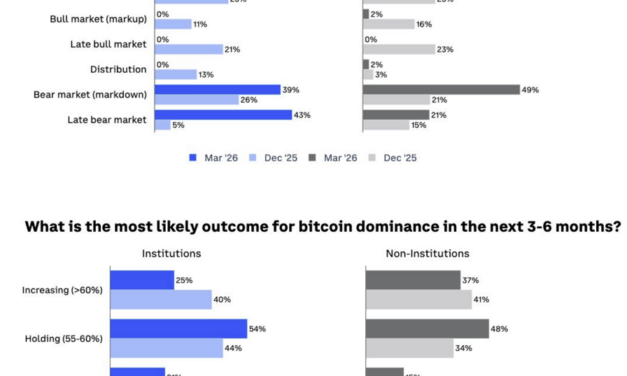
More than 70% of crypto investors believe that Bitcoin (BTC) is undervalued, according to a recent Global Investor Survey conducted by Coinbase and Glassnode.The survey found that 82% of institutions and 70% of non-institutions classify the market as a late bear cycle markdown phase, while onchain indicators suggest BTC is entering a “value-accumulation zone.” Bitcoin is in a late bear phase as undervaluation persistsCoinbase Institutional Research surveyed 91 global investors between March 16 and April 7, including 29 institutions and 62 non-institutions. The responses show a sharp shift in perceptions for the current BTC market. Around 82% of institutions and 70% of non-institutions now classify the market as a late bear or a markdown phase, up from roughly one-third in December.Bitcoin investor survey data. Source: CoinbaseAt the same time, the valuation views held steady. About 75% of institutions and 61% of non-institutions consider Bitcoin undervalued. Only a small share flagged it as overpriced.The survey also noted a shift in expectations for Bitcoin dominance. The share of institutions expecting dominance to rise dropped to 25% from 40%. About 54% now expect it to remain near the current level of 58.1%, while 21% expect a decline. Related: Bitcoin, stocks risk ‘months’ of losses as Kevin Warsh Becomes Fed chairOnchain signals flag value zone for BitcoinOnchain data echo the valuation stance for Bitcoin. Crypto analyst Woominkyu’s Bitcoin Combined Market Index (BCMI) aggregates MVRV, NUPL, SOPR, and investor sentiment into a single reading. The index recently jumped to 0.37 from 0.26, a level historically linked with deep undervaluation phases.Bitcoin Combined Market Index. Source: CryptoQuantThe MVRV compares market value to realized value, while NUPL tracks net unrealized profit and loss across holders. The SOPR measures whether coins are sold at a profit or a loss. Combined, the indicators frame both the pricing and investor behavior from a single viewpoint. The BCMI’s 90-day average continues to trend downward, suggesting ongoing selling pressure. However, earlier this month, Woominkyu said,“We are entering a “Value-Accumulation Zone.” The data suggests the downside is becoming limited compared to the long-term upside.”The short-term holder activity adds context. The realized cap UTXO age bands for one-week to one-month holders fell to 3.91%, matching October 2023 levels when BTC traded near $27,000. This metric tracks the share of recently moved coins, acting as a proxy for short-term liquidity and price speculation.Historically, Bitcoin has formed cycle lows within three to six months of similar readings since 2021. Market analyst Crypto Dan noted in March that the indicator has dropped significantly, placing the BTC market near undervalued territory without confirming a final bottom. Bitcoin realized cap: UTXO age bands (1 week to 1 month). Source: CryptoQuantRelated: Bitcoin’s recent rally is largely fueled by Strategy purchases: Bitwise’s HouganThis article is produced in accordance with Cointelegraph’s Editorial Policy and is intended for informational purposes only. It does not constitute investment advice or recommendations. All investments and trades carry risk; readers are encouraged to conduct independent research.

Čítaj viac

Dogecoin leads pre-FOMC rally with 12% gains: Is DOGE price headed to $0.33?

Dogecoin (DOGE) gained as much as 12% on Wednesday, leading gains in a broader relief rally across global risk markets ahead of the US Federal Reserve decision on interest rate cuts. Key takeaways:Dogecoin rallied up to 14% to $0.112 on Wednesday, outperforming the wider crypto market.Dogecoin open interest jumped 25% in 24 hours to $1.74B, signaling growing derivatives interest and institutional participation.A 2023-style fractal suggests DOGE price could rally 300% in the coming weeks.Dogecoin open interest surges 25%DOGE rose as much as 14% to an intraday high of $0.112 on Wednesday from a low of $0.097, outperforming the broader crypto market.Related: Price predictions 4/24: BTC, ETH, XRP, BNB, SOL, DOGE, HYPE, ADA, BCH, XMRDogecoin’s rally was fueled by several factors, including the launch of 21Shares’ physically-backed Dogecoin exchange-traded product (ETP) on Xetra, Germany’s leading electronic trading platform.Source: X/21SharesThe memecoin’s open interest (OI) surged 25% over the last 24 hours and 46% over the last two weeks to $1.74 billion on Wednesday, signaling the return of derivatives traders. Futures OI increasing alongside the price indicates a growing interest from institutional investors, which is generally seen as bullish, as it tends to increase liquidity and attract more trading capital.DOGE OI across all exchanges. Source: GlassnodeDogecoin’s rally also comes ahead of Federal Open Market Committee (FOMC) meeting on Wednesday, with market participants pricing in a 100% chance that interest rates will be left unchanged at 3.50%-3.75%.DOGE’s reaction to FOMC rate cut decisions in 2025 and 2026 shows a clear pattern. The price often moved higher in the days leading up to the meeting, followed by mostly negative returns thereafter, as illustrated in the chart.DOGE/USD daily chart. Source: Cointelegraph/TradingViewPrevious FOMC-linked corrections have coincided with sharp deleveraging phases, last seen in March, when a 15% DOGE price drop was accompanied by a $890 million decline in futures OI and $30 million in total Dogecoin liquidations.DOGE’s 2023 fractal projects 300% price rallyThe DOGE/USD pair is currently displaying a technical pattern that follows a 2023 fractal, in which Dogecoin gained 300%. The weekly chart shows the price bouncing off an ascending trend line that has supported it since mid-2022.A bullish cross from the moving average convergence divergence (MACD) indicator also confirmed the price bottom.DOGE/USD weekly chart. Source: Cointelegraph/TradingViewDogecoin’s current price action is following a similar pattern, again bouncing off the same structural support and a confirmed bullish MACD crossover.Dogecoin’s “weekly chart looks clean: bottom looks in, structure is holding,” analyst Trader Tardigrade said in a recent post on X, adding that the “next leg could send” the DOGE/USD pair to $1.If history repeats itself, DOGE price may rally by more than 300% toward $0.33 over the next few weeks. As Cointelegraph reported, further confirmation of a trend reversal now hinges on the DOGE/USD pair crossing the key $0.10-$0.11 resistance zone.This article is produced in accordance with Cointelegraph’s Editorial Policy and is intended for informational purposes only. It does not constitute investment advice or recommendations. All investments and trades carry risk; readers are encouraged to conduct independent research.

Čítaj viac

XRP set for ‘strongest’ 2026 monthly ETF inflows as bulls target $2

XRP (XRP) price was up 1.2% over the last 24 hours to trade at $1.40 on Wednesday. Several market and technical factors suggest that the XRP/USD pair may climb further as long as key support levels hold.Key takeaways:Spot XRP ETFs are set to record their strongest monthly inflows since December 2025, signaling renewed institutional demand.A symmetrical triangle setup sees XRP price rising roughly 53% as long as support at $1.40 holds.Ripple CEO on XRP: “Lock in”Ripple CEO Brad Garlinghouse is urging the XRP community to “lock in” as massive marketing campaigns take over the Las Vegas Strip ahead of the XRP Las Vegas 2026 (XRPLV26) conference. Related: Bitcoin, stocks risk ‘months’ of losses as Kevin Warsh Becomes Fed chairThe event, which is scheduled for Thursday and Friday will focus on the expanding XRP ecosystem, next-generation applications on the XRP Ledger and community building.On Tuesday, OKX, a major crypto exchange, posted an image of the Las Vegas Sphere lit with the XRP logo, which Ripple CEO Brad Garlinghouse reposted with a simple directive to his followers: “Lock in.”Source: X/OKX/Brad GarlinghouseRipple has heavily promoted the event with massive “Raise the Standard” XRP billboards across the Las Vegas Strip, timed with the ongoing Bitcoin 2026 conference. This has sparked renewed hype and social media buzz around the event.However, historical patterns show Ripple/XRP events rarely trigger sustained price rallies. For instance, XRP price gained 16% over the week following Ripple’s Swell 2025. But this was followed by a 30% drop from $2.56 to $1.81 between Nov. 11 and Nov. 21 of that year.Therefore, without major concrete announcements emerging from the stage, any upside may quickly fade amid broader market forces.XRP ETF demand is “still alive”XRP spot ETFs are gaining steady momentum again, with the latest inflows showing that investor demand is not just returning but holding firm at elevated levels. These investment products posted inflows in 11 of the last 13 days, totaling $82.42 million, according to data from SoSoValue. XRP ETFs have already pulled in $83.9 million in net inflows in April, marking a strong rebound from March’s $31.16 million outflow. This reversal makes April the “strongest monthly inflow since December 2025,” signaling a notable shift in momentum, analyst Xfinancebull said in a Monday post on X, adding:“That does not guarantee instant price fireworks, but it absolutely tells me the bid for regulated $XRP exposure is still alive and building.”Spot XRP ETF flows chart. Source: SoSoValueMeanwhile, global XRP exchange-traded products (ETPs) posted inflows totaling $25 million during the week ending Friday. XRP ETPs have now recorded $148 million in net inflows so far in 2026, bringing the total assets under management (AUM) to roughly $2.6 billion.Crypto funds net flows data. Source: CoinSharesThis indicates a sustained institutional appetite for XRP products, adding to XRP’s tailwinds.As Cointelegraph reported, exchange outflows, positive flows into whale addresses and strong ETF demand improve XRP’s chances of a sustained price recovery.XRP price technicals put 50% rally in playThe XRP/USD pair has spent nearly three months inside a symmetrical triangle, defined by two converging trend lines. Its rebound from the lower trend line support on Wednesday now raises the odds of a move toward the upper boundary.A daily candlestick close above the upper line of the triangle at $1.45 would open the way for a rally toward its measured target at $2.15, about 53% above the current price.However, bulls must overcome resistance from the 100-day exponential moving average (EMA) at $1.52 and the 200-day EMA at $1.75, before reaching this target.XRP/USD daily chart. Source: Cointelegraph/TradingViewNotably, XRP’s chances hinge on bulls defending support at $1.40, which is also the 200-week EMA and the 20-day EMA, making this a key level. A decisive break below it risks invalidating the bullish narrative altogether.It may instead raise the odds of the price declining toward the $0.98 mark, aligning with the triangle’s bearish target.As Cointelegraph reported, a break below the moving averages around $1.38-$1.40 could see XRP price drop toward $1.12 over the next few days.This article is produced in accordance with Cointelegraph’s Editorial Policy and is intended for informational purposes only. It does not constitute investment advice or recommendations. All investments and trades carry risk; readers are encouraged to conduct independent research.

Čítaj viac

Bitcoin, stocks risk 'months' of losses as Kevin Warsh Becomes Fed chair

Bitcoin (BTC) may face “a few months” of downside as the new US Federal Reserve chair takes over next month.Key points:Bitcoin may follow risk assets downhill after Kevin Warsh takes over as chair of the US Federal Reserve.President Donald Trump has said that he “would” be disappointed if an interest-rate cut did not occur in June.Wednesday marks current Chair Jerome Powell’s last rate decision.Bitcoin price tends to fall after new Fed chair entersIn its latest market coverage on X, crypto trading account CRYPTOWZRD warned that fresh downward BTC price pressure could return in June.The Fed’s new chair, Kevin Warsh, is due to take over from Jerome Powell — and the stakes are high when it comes to crypto and risk-asset performance.“Every time a new FED Chair takes over $BTC has corrected for a few months before the real fun began,” CRYPTOWZRD noted.“Can it break the curse or a final dip?”BTC/USD one-month chart with Fed chair appointments. Source: CRYPTOWZRD/XHistory shows that a change of management at the Fed pressures stocks as well — but this year, the S&P 500 is at all-time highs as it happens.The picture is complicated by politics. Powell avoided cutting interest rates — a would-be bullish catalyst for crypto — even as US President Donald Trump publicly shamed him for not doing so.In an interview with CNBC last week, Trump said that he “would” be disappointed if Warsh did not cut rates at his first Federal Open Market Committee (FOMC) meeting in June. Powell’s last FOMC meeting is due on Wednesday, with markets unanimously seeing rates being held at current levels, per data from CME Group’s FedWatch Tool.Fed target rate probabilities for April 29 FOMC meeting (screenshot). Source: CME GroupWarsh gives traders mixed signals on policyContinuing, crypto market participants see potential tailwinds for Bitcoin and altcoins thanks to US macro trends.Related: Bitcoin Bull Score hits six-month high as 2022 bear-market fears lingerThe Fed has begun adding to its balance sheet this year — a form of liquidity catalyst that traditionally benefits markets.“That’s right, the Fed has added ~$200B of US Treasuries back onto its balance sheet in the last few months,” Bitcoin Opportunity Fund partner James Lavish wrote on the day. “So much for tightening the money supply. QT is officially over. QE-light is in the house.”Fed balance-sheet data. Source: James Lavish/XIn recent YouTube content, meanwhile, Charlie Bilello, chief market strategist at wealth manager Creative Planning, revealed what he called a “contradiction” in Warsh’s plans.While “building the case” for rate cuts, he said, Warsh has been critical of the Fed keeping rates low during the post-COVID-19 inflation surge in 2021 and 2022.“It was a ‘fatal policy error’ that was what he was saying back then, and I would agree with that,” Bilello said.Warsh has also criticized balance-sheet expansion, raising questions over the fate of the 2026 uptrend.This article is produced in accordance with Cointelegraph’s Editorial Policy and is intended for informational purposes only. It does not constitute investment advice or recommendations. All investments and trades carry risk; readers are encouraged to conduct independent research.

Čítaj viac

Bitcoin rally falters as AI industry weakens and CLARITY Act approval odds fall

Key takeaways:Stalled progress on the CLARITY Act and hiccups in AI industry revenue weighed heavily on Bitcoin traders’ sentiment.Global instability and US economic concerns may add further downside pressure on Bitcoin price.Bitcoin (BTC) retreated below $76,000 on Tuesday, erasing gains from the prior week. This movement followed a 1% decline in the tech-heavy Nasdaq 100 Index after OpenAI reported a shortfall in its revenue and user growth targets. While the AI industry may be a factor in Bitcoin’s decline, crypto market regulations and macroeconomic indicators are also contributing.Nasdaq 100 futures (left) vs. Bitcoin/USD (right). Source: TradingViewThe Nasdaq 100 Index traded down 1% on Tuesday as AI infrastructure companies displayed weakness following a Wall Street Journal report that ChatGPT developer OpenAI announced lackluster sales and user metrics for 2025. Shares of Nvidia (NVDA US), Oracle (ORCL US), and CoreWeave (CRWV US) fell more than 2%.The downturn in technology stocks can also be attributed to routine profit-taking, as the Nasdaq 100 Index reached an all-time high on Monday. Traders adopted a more cautious approach ahead of quarterly earnings reports from Microsoft (MSFT US), Google (GOOGL US), Amazon (AMZN US), and Meta (META US) on Wednesday, with Apple (AAPL US) following on Thursday.Tech valuations, oil prices and shaky real estate marketsBrent crude oil spiked to $110 as US-Iran negotiations stalled over nuclear enrichment, threatening traffic through the Strait of Hormuz. Meanwhile, China’s major cities experienced significant declines in real estate, with existing home prices dropping 7.4%. In the US, although the S&P Case-Shiller Index rose 0.3%, over half the country saw price decreases. In addition to the current macroeconomic factors, Bitcoin traders are skeptical about stalled progress on the CLARITY Act. Despite the pro-crypto stance from the Trump administration, the expected advancements have not fully materialized. If the market perception of crypto regulation improves, it could serve as the necessary catalyst to drive institutional demand back into Bitcoin.Related: Acting AG Todd Blanche confirms ‘code is not a crime’ in DOJ pivotOdds of crypto market structure legislation approval by 2027. Source: KalshiTraders are currently pricing in lower odds of the CLARITY Act’s approval. This crypto market structure bill cleared the House of Representatives in July 2025 but has since stalled in the Senate Banking Committee. While it is impossible to pinpoint the exact drivers behind the Bitcoin price correction to $76,000, the lack of momentum in US-Iran negotiations, weakness in real estate markets, and negative regulatory pressure have likely undermined investor confidence. These factors, alongside the downturn in technology stocks on Tuesday, have created a challenging environment for Bitcoin.This article is produced in accordance with Cointelegraph’s Editorial Policy and is intended for informational purposes only. It does not constitute investment advice or recommendations. All investments and trades carry risk; readers are encouraged to conduct independent research.

Čítaj viac

Bitcoin Coinbase Premium turns negative as BTC price drops, weekly losses top $829M

Bitcoin’s (BTC) Coinbase Premium Index has turned negative at -0.008 for the first time in three weeks, signaling a sharp reduction in US spot market demand and aligning with BTC’s current price drop. The signal held across hourly readings through the next 48 hours, showing consistent selling pressure from US-based buyers. The shift comes as the net weekly average of BTC realized losses climbed to $829 million, suggesting reduced investor conviction. Bitcoin Coinbase Premium Index. Source: CryptoQuantCrypto trader Ardi highlighted a break in both trendline support and the $77,300 liquidity zone. The trader linked the move to weakening spot demand, noting that the premium has posted consecutive red readings for the first time since BTC was near $67,000. Ardi said that price action during the Federal Open Market Committee (FOMC) meeting window could remain volatile, with rapid moves in either direction. Traders could place focus on the $74,500–$75,500 range as a key downside area tied to demand exhaustion.Onchain data adds to this view. Crypto analyst Darkfost noted that the weekly realized losses reached $829 million on a seven-day average, compared to $566 million in realized profits. The net realized profit briefly turned positive on April 9, then reversed within two weeks. Bitcoin net realized profit/loss [USD] 7DMA. Source: CryptoQuantThe share of supply in profit stands at 64%, a level that has not historically supported sustained upside. This indicates weaker conviction among holders despite the recent rebound.Related: Bitcoin price hits one-week low as $100 oil sparks fresh Asia crisis fearsBitcoin sell volumes at Binance reach $828 millionDerivatives data shows strong sell-side activity on Binance. Crypto analyst Amr Taha noted that the 24-hour cumulative net taker volume dropped by $828 million on April 27, the lowest reading since late March. BTC cumulative net taker volume on Binance. Source: CryptoQuantNegative net taker volume indicates that the market’s sell orders exceed its buy orders. The Binance taker buy/sell ratio has also fallen to 0.89, a level last recorded on March 29.That earlier reading aligned with a local pivot when Bitcoin tested $66,000, then recovered by 15% over the past 30 days.The current readings place both metrics back near prior exhaustion zones. Taha described the setup as closer to a short-term capitulation than a larger trend breakdown.Related: Can Bitcoin hit $250K this year? Traders say it may be time to ‘sell in May’This article is produced in accordance with Cointelegraph’s Editorial Policy and is intended for informational purposes only. It does not constitute investment advice or recommendations. All investments and trades carry risk; readers are encouraged to conduct independent research.

Čítaj viac

Bitcoin price hits one-week low as $100 oil sparks fresh Asia crisis fears

Bitcoin (BTC) headed to weekly lows after Tuesday’s Wall Street open as oil-supply woes panicked global markets.Key points:Bitcoin continues its come down from recent highs as new oil fears worsen already shaky market sentiment.US President Donald Trump avoids hints of lifting the Strait of Hormuz blockade.BTC price action falls below $76,000 as a week’s gains evaporate.Bitcoin, stocks extend losses on Hormuz oil nervesData from TradingView showed BTC/USD dipping under $76,000 as US stocks also opened lower.BTC/USD four-hour chart. Source: Cointelegraph/TradingViewThe US-Iran war lay behind risk assets’ cold feet, with oil taking center stage amid the ongoing blockade of the Strait of Hormuz.WTI crude oil returned to $100 per barrel on the day, as US President Donald Trump continued to keep markets guessing on the outcome of the Hormuz impasse.“Iran has just informed us that they are in a ‘State of Collapse,’” he wrote in a post on Truth Social. “They want us to ‘Open the Hormuz Strait,’ as soon as possible, as they try to figure out their leadership situation (Which I believe they will be able to do!).”Source: Truth SocialCommenting, trading resource The Kobeissi Letter noted the ongoing impact on Asian countries, with Iran rapidly running out of oil storage capacity.“Asia’s energy crisis will soon intensify even further,” it predicted in a post on X.Crypto sources also drew attention to the impact of oil on market mood, among them onchain analytics platform Glassnode.“Disruptions in the Strait of Hormuz persist due to stalled US-Iran talks, tightening supply and spooking markets across the board,” it told X followers on the back of the WTI jump.CFDs on US WTI crude oil four-hour chart. Source: Cointelegraph/TradingViewBTC price breakout hopes fade into monthly closeBTC price action thus continued to shy away from attacking $80,000 after sealing a weekly candle close above a key resistance trend line.Related: Bitcoin price set for best gains since Q4 2024 with $77.5K monthly closeInstead, the two recent visits to $73,000 made market participants wary of calling a “double bottom” formation too early.“So far, $BTC bulls aren’t showing much enthusiasm for a robust double bottom bounce. Expecting to see volatility increase as we move to and through the monthly close,” trading resource Material Indicators commented.An accompanying chart showed exchange order-book liquidity and whale orders, with only the largest class of investors stepping in to buy.BTC/USDT order-book liquidity data with whale orders. Source: Material Indicators/XOthers also demanded more proof that bulls could crush the multiple resistance levels immediately above spot price, including the bear market support band.“We’ll need to see follow up to actually confirm a proper breakout though. But at least the bulls are putting in an effort for now,” trader Daan Crypto Trades wrote on X.BTC/USD one-week chart with bull market support band, moving averages. Source: Daan Crypto Trades/XThis article is produced in accordance with Cointelegraph’s Editorial Policy and is intended for informational purposes only. It does not constitute investment advice or recommendations. All investments and trades carry risk; readers are encouraged to conduct independent research.

Čítaj viac

Bitcoin price drops below $76K as onchain data sends mixed signals

Bitcoin (BTC) fell below $76,000 on Tuesday after failing to break $80,000 as uncertainties surrounding the reopening of the Strait of Hormuz and macroeconomic conditions unnerved the market. Meanwhile, technicals and onchain data sent mixed signals on BTC’s ability to sustain the recovery.Key takeawaysBitcoin is trapped in a tight range with strong technical support at $75,500 and heavy resistance near $80,000.Bitcoin’s onchain metrics are mixed, with buy pressure rising but spot volume and active addresses declining.Bitcoin price is sandwiched between two key levelsBitcoin’s 30% recovery from sub-$60,000 lows reached on Feb. 6 was stopped by selling around the $78,000-$80,000 supply zone.Related: Three Bitcoin charts say BTC price may rally toward $82KNote that this is where the 20-week exponential moving average (EMA) sits currently, reinforcing the importance of this resistance level.MN Capital founder Michael van de Poppe said the ongoing retracement was “typical behavior” ahead of the FOMC meeting. “Bitcoin touched the resistance zone at $79,000 and is consolidating,” van de Poppe said, adding:“I think we’re still in for a strong period on the markets.”BTC/USD daily chart. Source: Cointelegraph/TradingViewOn the downside, Bitcoin retested support at $75,500, which is also the 20-day EMA, the 100-day EMA and the lower trend line of an ascending channel, as shown in the chart above.Glassnode’s UTXO realized price distribution (URPD), which shows the average prices at which ETH holders bought their coins, reveals that immediate resistance is around $78,000 where investors acquired 335,650 BTC. Investors acquired roughly 298,560 BTC at an average price of $75,500, marking it as a key support level.Bitcoin URPD all-time high partitioned. Source: GlassnodeThe chart above also shows a larger supply overhang around $82,000-$84,000, which could stall price rallies, while a significant support zone sits between $65,500 and $67,000.  Notably, this is the price range defined by the ascending parallel channel in the TradingView chart above.Meanwhile, Bitcoin’s liquidation heatmap shows BTC in a classic liquidation sandwich with heavy ask orders around $78,600 and dense bid positions below the spot price, as shown in the figure below. This highlights the relative tightness of the current market structure.Bitcoin liquidation heatmap. Source: CoinGlassAs Cointelegraph reported, buyers are expected to fiercely defend the $75,500-$76,000 support level, while bears are mounting a defense at the $80,000 psychological level.Bitcoin’s onchain “fundamentals remain weak”Bitcoin market data is showing a “mix of bullish momentum and cautious sentiment,” contributing to the uncertainty in the market, data from Glassnode shows.Spot CVD (cumulative volume delta, a metric measuring the difference between buying and selling volume over time) has increased to $54.8 million million from $18.3 million, marking a near 200% increase over the last week.“This reflects strong bullish sentiment among market participants, suggesting heightened confidence in Bitcoin’s short-term direction,” the onchain data provider said in its latest Market Pulse report.Spot volume has decreased by 13.8% to $5.99 billion from $6.95 billion a week ago, “suggesting reduced market activity,” Glassnode added.Bitcoin spot CVD and spot volume charts. Source: GlassnodeMeanwhile, the number of daily active addresses dropped by 1.6% over the same period, “reflecting a more subdued state of network participation and reduced speculative interest,” Glassnode said, adding:“While buying pressure remains firm, reduced speculative activity suggests a more measured approach, with investors balancing risk and capital rotation.”Swissblock’s Bitcoin Fundamental index, which measures network health, growth, demand, activity, and capital flows, echoes this outlook.The index rose toward neutral with BTC’s recovery from macro lows below $60,000, and picked up again as the price reclaimed the $70,000 level.“Bitcoin’s price structure points higher, but fundamentals remain weak,” the private wealth manager said in an X post on Monday, adding:“Price can still rise here. But for a medium-term trend shift, Bitcoin needs neutral-to-strong fundamentals to confirm.”Bitcoin fundamental index. Source: SwissblockInstitutional demand for Bitcoin is also in neutral territory. While Strategy, the largest corporate Bitcoin holder, continues to buy BTC, flows into US-based spot Bitcoin ETFs turned negative, recording $273 million in net outflows on Monday.This article is produced in accordance with Cointelegraph’s Editorial Policy and is intended for informational purposes only. It does not constitute investment advice or recommendations. All investments and trades carry risk; readers are encouraged to conduct independent research.

Čítaj viac

Can Bitcoin hit $250K this year? Traders say it may be time to ‘sell in May’

Bitcoin (BTC) is trading roughly 40% below its October 2025 record high near $126,000 despite its ongoing recovery.BTC/USD daily chart. Source: TradingViewStill, some of the cryptocurrency’s loudest bulls, including billionaire investor Tim Draper and Fundstrat’s co-founder Tom Lee, have not backed down from their $250,000 year-end prediction, a target that would require more than a threefold rally from current levels.Is that realistic, or is Bitcoin’s latest drawdown a warning that the cycle has already peaked?Key takeaways:Bitcoin’s selloff may resume due to a bearish continuation setup.Halving and midterm election fractals appear bearish for the BTC price in 2026.Veteran trader warns of more BTC price declinePeter Brandt, a veteran futures market trader, highlighted a maturing bear flag channel on the Bitcoin daily chart, which could keep BTC’s odds of rising toward $250,000 this year low.As of Tuesday, BTC was showing signs of a pullback after testing the flag’s upper boundary near $79,500 as resistance. The cryptocurrency risks declining toward the flag’s lower boundary around the $69,000 level by May if the correction persists.Those of you predicting $250,000 in 2026 need to stop with the mushroomsThis is called a channel While it does not preclude further price gains, it is NOT a bullish bottoming patternSource: XA bear flag fully resolves when the price decisively breaks below the lower boundary and drops to a level at length equal to the height of the previous downtrend.A break below the flag’s lower trend line may push the BTC price under $50,000 if the technical setup plays out as intended.BTC/USD daily chart. Source: TradingViewBitcoin halving fractals show the bear market is midwayBTC’s price cycles have historically followed a clear pattern tied to its halvings every four years. Cycle peaks have consistently occurred 12 to 18 months after the event. In 2012, the peak arrived in 12 months. The 2016 halving saw its top in 17 months, while the 2020 halving peaked after 18 months. The April 2024 halving fits this timeline. Bitcoin hit its all-time high of $126,000 in October 2025, roughly 17–18 months later. Bitcoin price performance since halvingNow, in late April 2026 (over 24 months post-halving), BTC trades around $77,000, down 38%–40% from that peak. This alignment suggests the 2025 high may represent the cycle top, casting doubt on new highs for the remainder of 2026.Bitcoin sell-off may resume in MayA chart by analyst Merlijn The Trader is adding to the cautious narrative, pointing to a recurring “Sell in May” pattern in US mid-term election years. For instance, BTC dropped 61% in 2014, 65% in 2018, and 66% in 2022, each beginning around May of the election years. BTC/USD one-month chart. Source: TradingView/Merlijn The TraderApplying a similar framework to 2026, Merlijn projected a potential decline of over 60%, which would place BTC near the $30,000 level.In a February report, Capital Group analysts Matt Miller and Chris Buchbinder said midterm elections often raise uncertainty over congressional control and policy direction. As campaign rhetoric heats up in the spring, investors tend to cut risk, slow buying, and brace for volatility.That backdrop weakens the case for Bitcoin reaching $250,000 by year-end, even though several analysts, including those from Bernstein, see room for a more modest rebound toward the $100,000–$150,000 range. This article is produced in accordance with Cointelegraph’s Editorial Policy and is intended for informational purposes only. It does not constitute investment advice or recommendations. All investments and trades carry risk; readers are encouraged to conduct independent research.

Čítaj viac

Is Ethereum safe above $2K? Traders are watching these ETH price levels

Ether (ETH) analysts have mapped out key ETH price levels to watch over the next few weeks, with a focus on the $2,000 psychological level.Key takeaways:Dropping below the 200-day simple moving average at $2,220 could confirm more downside for Ether.ETH faces stiff resistance at $2,400, a level that must be reclaimed by the bulls. Ether price stuck between two key levelsData from TradingView showed the ETH/USD pair trading below $2,300, down 5% over the last two days and erasing all gains made over the weekend. This meant that the price remained wedged between the 100-day exponential moving average at $2,350 and the 100-day simple moving average (SMA) at $2,220, as shown in the chart below.This suggested that Ether could consolidate within these trend lines for a few more days before a decisive move.Telegram trading resource Technical Crypto Analyst said that after losing the support trendline at $2,300, “we can probably expect Ethereum to drop, and it might even hit the lower support level in the next few days,” adding: “A solid breakdown with good volume would confirm this.”ETH/USD daily chart. Source: Cointelegraph/TradingViewThe analyst was referring to two immediate support zones: the $2,200 area, where the 50-day and 100-day SMAs converge, and the psychological level at $2,000.“ETH has dropped below the $2,300 level,” said fellow analyst Ted Pillows in a Tuesday post on X, adding:“The next crucial support zone is $2,200 which could be a level for a short-term bounceback.”A key buy zone to watch below that is the $1,800-$1,750 area, which aligns with the multi-year low reached on Feb. 6.In a recent post on X, trader Daan Crypto Trades said that the key levels to watch were $2,100 as support and the resistance at $2,800, which ETH price has “respected” well over the past few years.ETH/USD daily chart. Source: X/Daan Crypto TradesAs Cointelegraph reported, a daily close below the moving averages around $2,200 would bring the next line of defense at $2,000 into focus.Ethereum price must reclaim $2,400 to continue recoveryAs Cointelegraph also reported, Ether’s bullish case hinges on flipping the resistance at $2,400 into support, where the realized price currently is.“This is a very important psychological factor,” CryptoQuant analyst CW8900 said in a recent X post, adding:“Breaking through that line signifies that whales are transitioning to a profitable position.”ETH realized price. Source: CryptoQuantWith whales back in a profitable position, it would “provide grounds for their buying power to become stronger,” the analyst added.Related: Ethereum’s EEZ could pull other blockchains into its orbitMeanwhile, Ether’s liquidation map reveals that a break above $2,400 would trigger over $1.94 billion in short liquidations across all exchanges.ETH exchange liquidation map. Source: CoinGlassThis means a significant amount of bearish bets risk liquidation on a move higher, opening the way to a sharper upward cascade if the recovery resumes.This article is produced in accordance with Cointelegraph’s Editorial Policy and is intended for informational purposes only. It does not constitute investment advice or recommendations. All investments and trades carry risk; readers are encouraged to conduct independent research.

Čítaj viac

Bitcoin support resistance flip in play as longs to shorts delta highlights bullish bias

Bitcoin bulls fell $515 short of their $80,000 target after BTC (BTC) topped out at $79,485 on Monday, but a potential upside is that the brief pullback provides a necessary retest of key underlying levels. In technical analysis, a break of structure is generally followed by a support-resistance retest as swing traders take profits at preset levels that align with metrics such as the Fibonacci retracement, exponential moving averages, Bollinger Bands, order book structure, and more. The support-resistance flip is also a feature traders look for to confirm that a longer-term resistance (in this case) has turned into support. When confirmed, it gives some traders the confidence to open new positions at the S/R level as they believe the break of structure and retest marks either the completion or the start of a trend reversal. After managing the first decisive breakout from the 3-month-old channel, Bitcoin retested the channel resistance (at $76,688) that had pinned down every BTC rally since Feb. 8. A deeper retest could see the price drop to the 20-day moving average at $75,250, and then confirmation of the S/R flip would entail daily candle closes above the former trendline resistance. BTC/USDT 1-day chart. Source: TradingViewOutside of the naked price action from the candlestick chart, the long-to-short delta (heatmap below) shows longs currently with the advantage, with a -$38.6 million delta, and the figure widens to -$153 million if BTC rises to $77,500. BTC/USD long-short delta. Source: HyblockEssentially, the SR flip from the Monday US morning session liquidated long positions down to $76,500, potentially confirming the trendline resistance as support. As the price rebounds, the chart shows shorts having significantly more leveraged exposure at risk.Related: Bitcoin shorts create $1.4B liquidation risk: Is a price squeeze to $80K next?Bulls may succeed in pushing the price through the most immediate overhead shorts and returning BTC to its range highs below $80,000, but the aggregate orderbook set at 2.5% to 5% shows a wall of asks stacked from $79,700 to $80,000. This suggests that clearing the $80,000 level could remain a challenge in the short-term.BTC/USDT orderbook bids and asks. Source: TRDR.ioThis article is produced in accordance with Cointelegraph’s Editorial Policy and is intended for informational purposes only. It does not constitute investment advice or recommendations. All investments and trades carry risk; readers are encouraged to conduct independent research.

Čítaj viac

Price predictions 4/27: SPX, DXY, BTC, ETH, XRP, BNB, SOL, DOGE, HYPE, ADA

Key points:Bitcoin continues to face resistance near $79,500, but the trajectory remains up as long as the price holds above $76,000.Most major altcoins are not showing any directional bias, suggesting a near-term consolidation.Bitcoin (BTC) attempted to rise above $79,500, but the bears held their ground. BTC investor and author Michael Terpin told Cointelegraph that BTC risks falling to $57,000 in October 2026, based on a study of the “historical average” drawdown of about 1 year from a market-cycle top. Terpin added that BTC will have to rise above $100,000 for the bull market to resume.Another negative view came from Bitcoin analyst Matthew Hyland, who said in a post on X that the “larger expected consensus outcome for BTC is another leg lower by October.” Veteran trader Peter Brandt also opined in an X post that BTC may form “an investable low” in September or October.Crypto market data daily view. Source: TradingViewWhile several analysts expect a fall in BTC, crypto sentiment platform Santiment has a different view. Santiment said in a post on X that BTC wallets holding between 10 and 10,000 BTC have added 40,967 BTC since April 10, while retail investors holding less than 0.1 BTC have accumulated 46 BTC during the same period. If whales continue to buy and retail investors book profits, that may signal a long-term bull run.Could BTC and the major altcoins rebound off the support? Let’s analyze the charts of the top 10 cryptocurrencies to find out. S&P 500 Index price predictionThe S&P 500 Index (SPX) rose to a new all-time high on Friday, indicating that the bulls are in command.SPX daily chart. Source: Cointelegraph/TradingViewThe upsloping 20-day exponential moving average (6,948) and the relative strength index (RSI) near the overbought zone suggest the up move may continue. The next levels to watch on the upside are 7,500 and then 7,877.Sellers will have to swiftly yank the price back below the 20-day EMA to weaken the bullish momentum. If they manage to do that, the index may tumble to the 50-day simple moving average (6,795).US Dollar Index price predictionThe US Dollar Index (DXY) reached the moving averages, where the bears are posing a stiff challenge.DXY daily chart. Source: Cointelegraph/TradingViewThe bears will attempt to push the price toward the 97.74 level, where buyers are expected to step in. However, if the bears push the price below the 97.74 level, the index may sink toward the 96.21-95.55 support zone.On the upside, the bulls will need to sustain prices above the moving averages to increase the likelihood of a rally toward the 100.54 level. The bears will attempt to keep the index inside the 95.55 to 100.54 range by selling near the overhead resistance.Bitcoin price predictionBTC has been sustaining above the breakout level of $76,000, indicating that the bulls are not hurrying to book profits.BTC/USDT daily chart. Source: Cointelegraph/TradingViewThe upsloping moving averages and the RSI in the positive zone signal that the path of least resistance is upward. If buyers thrust the price above $80,000, the BTC/USDT pair may skyrocket to $84,000. Time is running out for the bears. They will have to quickly pull the BTC price below the 20-day EMA to gain the upper hand. The pair may then decline to the 50-day SMA ($71,820), signaling that the bears are active at higher levels.Ether price predictionEther (ETH) remains above the 20-day EMA ($2,295), but bulls have failed to push it above the $2,465 resistance.ETH/USDT daily chart. Source: Cointelegraph/TradingViewSellers will attempt to strengthen their position by pulling the ETH price below the 20-day EMA. If they succeed, it suggests the ETH/USDT pair may remain within the ascending channel for a while longer.Buyers will have to thrust the price above the resistance line to seize control. The pair may then soar to $3,050. Sellers will be back in the driver’s seat on a close below the support line.XRP price predictionXRP (XRP) remains stuck inside the $1.27 to $1.61 range, indicating buying on dips and selling on rallies.XRP/USDT daily chart. Source: Cointelegraph/TradingViewThe 20-day EMA ($1.40) has started to turn up gradually, and the RSI is near the midpoint, indicating that the bulls have a slight edge. There is minor resistance at $1.51, but if it is crossed, the XRP/USDT pair may reach the downtrend line. A break and close above the downtrend line signals a potential trend change. The pair may then rally to $2.Sellers are likely to have other plans. They will attempt to pull the XRP price back below the moving averages, retaining the pair inside the range.BNB price predictionBNB (BNB) is finding support at the moving averages, but the bulls have failed to trigger a strong bounce off them.BNB/USDT daily chart. Source: Cointelegraph/TradingViewBuyers will need to drive the BNB price above $654 to signal strength. The BNB/USDT pair may then test the $687 resistance level, a critical level to watch. If buyers pierce the $687 level, the pair may jump to $730 and then to $790.Instead, if the price turns down from the current level or the overhead resistance and breaks below the moving averages, it suggests the pair may remain within the $570 to $687 range for a few more days.Solana price predictionSolana (SOL) continues to trade near the moving averages, indicating a balance between supply and demand.SOL/USDT daily chart. Source: Cointelegraph/TradingViewThere is a minor obstacle at $90.73, but if that level is broken, the SOL/USDT pair may reach the $98 resistance. Sellers are expected to defend the $98 level with all their might, as a close above it opens the doors for a rally to $117.Alternatively, if the SOL price turns down from the current level or the overhead resistance and breaks below $82.94, it suggests that the bears are attempting to take charge. The pair may then collapse to the $76 support.Related: First 21-week trend line reclaim since October 2025: Five things to know in Bitcoin this weekDogecoin price predictionDogecoin (DOGE) has been gradually moving higher but is expected to face selling in the $0.10 to $0.11 zone.DOGE/USDT daily chart. Source: Cointelegraph/TradingViewIf the DOGE price turns down from the overhead resistance zone, it is expected to find support at the moving averages. A sharp bounce off the moving averages increases the possibility of a rally to the $0.12 level.Contrarily, if the price turns down and breaks below the moving averages, it signals that the bears remain sellers on rallies. The DOGE/USDT pair risks resuming the downtrend if the $0.09 support breaks down. Hyperliquid price predictionHyperliquid (HYPE) resumed its northward march after breaking above the $41.88 resistance on Sunday.HYPE/USDT daily chart. Source: Cointelegraph/TradingViewThe uptrend is facing selling pressure in the $43.76 to $45.77 zone, as seen in the long wick on the candlestick. Sellers will attempt to sink the HYPE price below the 20-day EMA ($41.25), opening the door to a drop toward the 50-day SMA ($39.50). Conversely, if the price rises above the current level or the 20-day EMA and breaks above $45.77, it signals that the bulls remain in control. That may propel the HYPE/USDT pair toward the $50-$51.43 resistance zone.Cardano price predictionCardano (ADA) has been clinging to the moving averages for several days, improving the prospects of an upside breakout.ADA/USDT daily chart. Source: Cointelegraph/TradingViewThe downtrend line is the crucial resistance to watch out for as a close above it signals a potential short-term trend change. The ADA/USDT pair may surge to $0.32, then to $0.37.On the contrary, if the ADA price turns down sharply from the downtrend line, it suggests that the bears are aggressively defending the level. The pair may then slump to the $0.22 support.

Čítaj viac
Načítava

Získaj BONUS 8 € v Bitcoinoch

nakup bitcoin z karty

Registrácia Binance

Burza Binance

Aktuálne kurzy