Značka: Markets

Bitcoin price eyes $66K as US stocks rise on Iran-strike pause

Bitcoin (BTC) sought to build on local highs at Monday’s Wall Street open as US stocks opened in the green.Key points:Bitcoin approached new local highs with the start of the week’s first US trading session.Stocks also opened higher amid relief over a hiatus in the US-Iran war and potential progress on reopening the Strait of Hormuz.BTC price action defended two daily moving averages on Sunday’s weekly close.Bitcoin follows stocks higher as Iran news offers risk-asset tailwindData from TradingView showed BTC/USD spiking to near $66,000 as markets reacted to a pause in strikes between the US and Iran. BTC/USD one-hour chart. Source: Cointelegraph/TradingViewAdditional reports cited an Iranian foreign ministry spokesman announcing that Tehran and Oman were “trying to establish mechanisms regarding maritime traffic” through the Strait of Hormuz, a key global oil route currently closed.US WTI crude oil fell toward $82 per barrel on Monday before a modest rebound. The S&P 500 and Nasdaq Composite Index were both up by around 0.3% at the time of writing.CFDs on US WTI crude oil one-hour chart. Source: Cointelegraph/TradingViewAcknowledging a potential stumbling block in the form of higher US bond yields, trading company QCP Capital voiced that they were anticipating tailwinds for the crypto market going forward. “Digital assets have generally outperformed equities in July despite a more challenging macro backdrop,” the firm wrote in its latest Market Color analysis. “BTC and ETH are up approximately 11.6% and 24.6% month-to-date, respectively, even as higher Treasury yields and periodic risk-off sentiment have weighed on broader markets.”QCP referenced developments around the CLARITY Act, a key piece of proposed crypto legislation still under consideration.“Market attention also remains on developments surrounding the proposed CLARITY Act, which continues to be closely followed by digital asset participants given its potential implications for the US regulatory framework,” it continued.BTC price support holds but remains fragileAmong Bitcoin traders, caution mixed with quiet optimism over BTC price action on shorter time frames.Related: Rate path still divides investors: Five things to know in Bitcoin this weekCrypto trader and analyst Michaël Van de Poppe highlighted that BTC was holding the 21-day and 50-day simple moving averages (SMAs) as support. These stood at $64,289 and $63,261, respectively.“This is a strong signal for the markets to be betting on the long side of this asset, however, it’s still a little fragile,” he wrote in ongoing updates on X. “I’d much prefer to see a strong move to $66,000-67,000 over the next 1-3 days to see a continuous bid coming in.”BTC/USDT one-day chart. Source: Michaël Van de Poppe on X.comData from CoinGlass showed crypto short liquidations spiking as the market rose, with these nearing $250 million over a 24-hour period.BTC/USD vs. crypto liquidations (screenshot). Source: CoinGlass

Čítaj viac

Rate path still divides investors: Five things to know in Bitcoin this week

Bitcoin (BTC) heads into the end of July juggling volatility catalysts as the Federal Reserve reacts to US inflation.Key points:The Fed will deliver its latest decision on interest rates as US bond yields spike, with markets seeing a September hike as likely. June PCE inflation is due on Thursday after hitting a three-year high of 4.1% last monthSigns of a shift in the equities uptrend places the focus on Bitcoin’s macro correlation.Whales exchange inflows cool by 44% since June Markets remain split on rate outlookAttention turns once more to the US Federal Reserve this week, with the Federal Open Market Committee (FOMC), chaired by Kevin Warsh, set to announce its latest interest rate decision on Wednesday, July 29.A combination of geopolitical tensions and persistent inflation pressures has reshaped expectations for Fed policy and put the possibility of further rate hikes back on the table as the US 2-year Treasury yield climbed to 4.3% last week. The latest data from the CME Group’s FedWatch Tool currently sees a 31% chance of a hike this week, with a hike at the September meeting having odds as high as 50%.Fed target rate probabilities (screenshot). Source: CME GroupThese rate hike expectations were tempered slightly as oil prices dropped 8% in the early hours of Monday as the US and Iran paused strikes. Rate hike odds therefore shifted from 37.4% to 33.7%. Ongoing developments in the Middle East thus continue to introduce volatility into the macroeconomic outlook, even as PPI inflation data released earlier in the month came in below expectations.Fed target rate probability comparison for July FOMC meeting (screenshot). Source: CME GroupCommenting, trading resource Mosaic Asset Company also noted a pending upward breakout in 30-year bonds. Although the long end of the bond curve now plays a diminished role in funding the US government, this could notionally add to pressure on Warsh as he shapes his language at the post-FOMC press conference.“The 30-year Treasury yield is also testing a key breakout level once again. In May, the 30-year yield saw a false break above the 5% level which has served as resistance since late 2023,” it summarized in the latest edition of its regular newsletter, The Market Mosaic.US 30-year bond-yield data. Source: Mosaic Asset CompanyEven before the latest turmoil, new Fed chair Warsh had steered clear of dovish language on the economy and kept his post-FOMC statement and press conference notably brief.“Inflation remains elevated relative to the Committee’s 2 percent goal, in part reflecting supply shocks that have driven price increases in certain sectors, including energy,” he said at the time.PCE inflation seen falling from three-year highBeyond the FOMC, markets will be watching the Personal Consumption Expenditures (PCE) index on Thursday for fresh signals over the impact of the US-Iran war on inflation trends. The June print of the index, currently sits at three-year highs.PCE volatility can have a snap impact on risk-asset performance as traders reprice potential Fed reactions. June’s release coincided with Bitcoin dropping to macro lows around $58,000.Prefacing its latest analysis, the International Monetary Economics Network (IMEN) predicted that PCE would be moderately lower compared to May’s 4.1% year-on-year tally. “U.S. inflation: We currently expect June PCE inflation to be 3.7% year‑over‑year,” it wrote on X. US PCE inflation data (screenshot). Source: Bureau of Economic AnalysisCorrelation between Bitcoin and equities remains absentOn higher timeframes, correlations between Bitcoin and major equity indices have largely disappeared. Data from TradingView currently puts the daily correlation between BTC/USD and the S&P 500 with a 20-week loopback window as practically absent, at its lowest levels since March. Against the tech-heavy Nasdaq Composite Index, meanwhile, its current correlation coefficient of 0.11 was last observed in mid-February. While correlations on the weekly timeframe move slowly, bearish geopolitical and macro events have the potential to make the two asset classes move in lockstep again. BTC/USD one-week chart with rolling 20-week stocks correlation. Source: Cointelegraph/TradingViewFor now, corporate earnings in the US have continued to surpass expectations. However, given the historically high valuations, this is unlikely to shield the market from potential pullbacks. Several major US tech stocks saw significant drawdowns last week. The Magnificent 7 falling by an aggregate 5.3% through Friday after $GOOGL and $TSLA had already suffered sell-offs earlier in the week.In spite of this, “Alphabet, $GOOGL , is the single largest margin contributor after significantly beating earnings estimates,” the Kobeissi Letter commented on the topic at the weekend. “Meanwhile, 86% of reporting S&P 500 firms have so far beaten EPS estimates, while 80% have exceeded revenue expectations. AI is driving historic earnings growth.”S&P 500 net profit-margin data. Source: The Kobeissi Letter on X.comMosaic Asset Company highlighted the risks that the rate environment may exert on US equities.  “Rising rates across the yield curve could keep pressuring stock prices, where indexes like the S&P 500 and Nasdaq peaked in early June and are now losing key support levels. At the same time, market breadth is deteriorating while the backdrop for seasonality is transitioning from a bullish tailwind to bearish headwind. Seasonality during mid-term election years also tends to produce lower average returns and larger drawdowns.”With these emerging hurdles, the S&P 500 is at risk of losing its bullish setup altogether, Mosaic warns.“The S&P already lost one key support level with the 50-day moving average (MA – black line). If trendline support in the triangle gives way, that could set up a test of the 200-day MA (green line) that’s currently near the 7,000 level (or 5% downside from current levels),” it added alongside an explanatory chart.S&P 500 data. Source: Mosaic Asset CompanyOn shorter time frames, the picture remains fluid, with a pause in hostilities between the US and Iran providing a bullish impulse across risk assets. US WTI crude oil dropped as low as $83 per barrel to start the week, having previously eyed $95.“The market is beginning to price-in a peace deal again,” Kobeissi responded.CFDs on US WTI crude oil one-hour chart. Source: Cointelegraph/TradingView“Boring” BTC price range tests 50-month trend lineBitcoin went on to seal new local highs after Sunday’s weekly close, reaching $65,680 on Bitstamp. Still in a familiar range, BTC/USD battled its 50-month exponential moving average (EMA) trend line, having previously flipped it to resistance in a copycat move from the 2022 bear market.BTC/USD one-day chart with 50-month EMA. Source: Cointelegraph/TradingViewCommenting on the current market setup, trader and analyst Rekt Capital flagged resurgent sell-side pressure.“The more seller-dominant the volume becomes while Bitcoin is at resistance, the greater the chances for a rejection from here,” he warned X followers on Sunday.Rekt Capital brought the 200-week simple moving average (SMA) into the equation, describing price as “sandwiched” between it and its 50-month counterpart.“Continued price compression here is unsustainable and will eventually force major volatility,” he forecast. “And if the seller volume keeps coming in at this rate, then there’ll likely be a breakout on seller volume to precede a rejection from this local resistance area.”BTC/USD one-week chart. Source: Rekt Capital on X.comBinance whale inflows nearly halve since mid-JuneCommenting on the FOMC meeting and its impact on crypto markets, onchain analytics platform CryptoQuant sees a potential knock-on effect for sell-side pressure on major exchanges.Related: BTC supply in profit eyes 60%, but analysis hints recovery may ‘roll back over’According to their data, BTC inflows from whales to Binance, have dropped by up to 44% since June 12, while retail inflows fell 22%.“This leaves retail inflows at roughly twice the level of whale inflows, with a gap of $3.9 billion,” contributor Amr Taha wrote in a blog post on Monday. “The divergence suggests that the composition of BTC transfers into Binance has shifted: retail participants are currently significantly more active than whales in sending BTC to the exchange.”Bitcoin whale inflows to Binance (screenshot). Source: CryptoQuantTaha described the FOMC meeting as a “major macro catalyst” that could reshape the approach of all investor cohorts to the market.“With retail inflows now running at 2x whale inflows, Wednesday’s Fed decision could provide an important test of whether the current divergence between the two BTC cohorts persists or begins to converge,” he concluded.As Cointelegraph reported, Binance saw single-day withdrawals of over 9,000 BTC last week.

Čítaj viac

Ethereum ETFs close week in red, end 5-day inflow streak

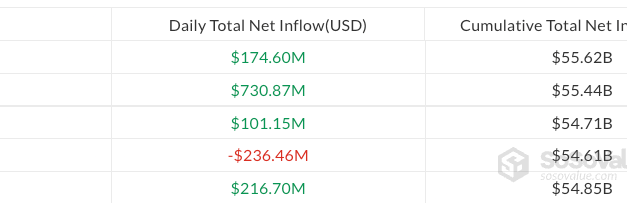
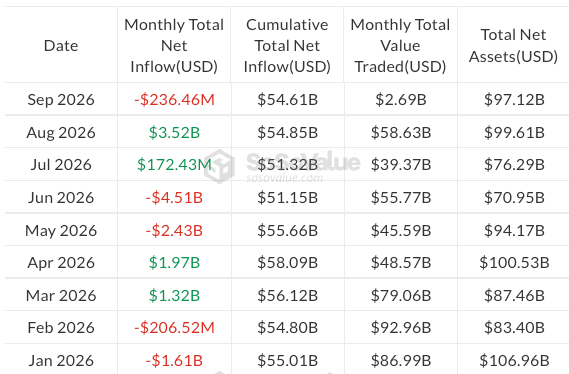
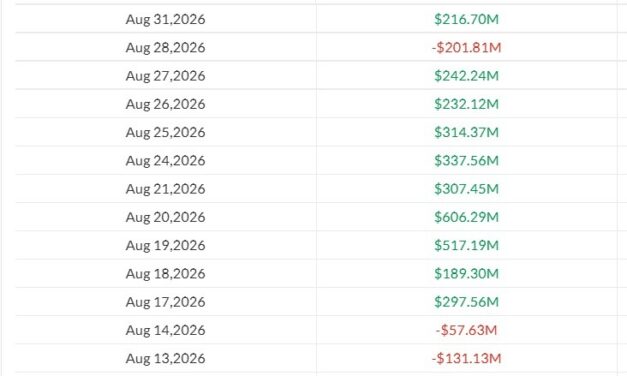
US-listed spot Ethereum exchange-traded funds (ETFs) logged $70.62 million in net outflows on Friday, ending a five-day inflow streak.Ethereum funds saw $211.25 million in net inflows over the previous five sessions from July 17 to Thursday, according to SoSoValue data. They still posted $103.9 million in net inflows for the week ended Friday.Despite the outflows, Ethereum ETFs extended their weekly inflow streak to three straight and have attracted $337.74 million in net inflows so far in July.Spot crypto ETF flows have become one of the market’s most closely watched gauges of demand for Bitcoin (BTC) and Ether (ETH) through traditional investment products. Although other jurisdictions, including Hong Kong, have launched similar funds, US-listed ETFs account for the vast majority of assets and trading volumes.Daily spot Ethereum ETF net flows from July 17 to July 24. Source: SoSoValueBitcoin ETFs also end week with outflowsThe reversal followed a similar pattern in Bitcoin ETFs, which ended a seven-day inflow streak on Thursday and recorded another $240.08 million in net outflows on Friday.Bitcoin ETFs also extended their net inflow streak to three consecutive weeks, adding $103.90 million during the week ended Friday and $233.96 million so far in July. They followed a record June, when $4.5 billion flowed out of the funds. BTC traded just under $64,000 at the time of writing, tumbling from the week’s high of $66,892 on Tuesday, according to CoinGecko. ETH traded at $1,837, down from Wednesday’s weekly high of $1,954.Related: Bitcoin falls under $64K as surging US bond yields boost Fed rate-hike oddsJapan’s crypto reforms fuel $18.4 billion Bitcoin ETF forecastFollowing Japan’s recent overhaul of its crypto regulations, which is widely viewed as laying the groundwork for future spot Bitcoin ETFs, crypto management platform XWIN estimated that a mature Japanese spot Bitcoin ETF market could reach about $18.4 billion, equal to roughly 0.13% of the country’s $14.6 trillion in household financial assets.In an analysis posted at CryptoQuant, XWIN said the estimate assumes demand from existing crypto holders, new retail investors using brokerage accounts and institutional allocators. The report pointed to the US market as an example, noting that spot Bitcoin ETFs excluding Grayscale’s GBTC have accumulated roughly 1 million Bitcoin, demonstrating how regulated ETF products can connect traditional finance with digital assets.“The key is access,” XWIN said, adding that a Japanese spot Bitcoin ETF would allow investors to gain Bitcoin exposure through familiar brokerage and custody systems. It characterized the $18.4 billion figure as “an achievable upper-end market scenario.”Magazine: A quantum roadmap would push Bitcoin much higher: Charles Edwards

Čítaj viac

Bitcoin falls under $64K as surging US bond yields boost Fed rate-hike odds

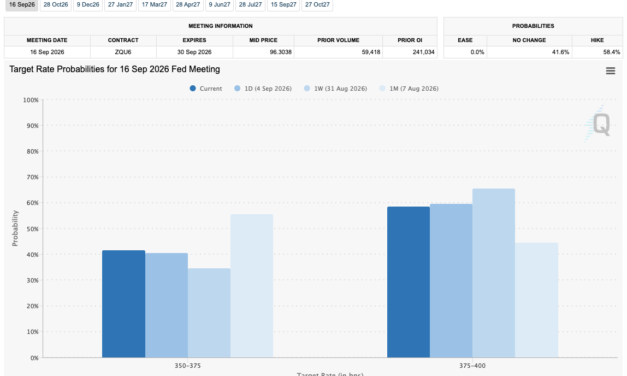
Bitcoin (BTC) fell more than 1.6% on Friday as its latest price correction accelerated after Wall Street opened.Key points:Bitcoin price downside pressure mounts on the back of multiple macro headwinds.US bond yields further a hawkish pivot in Fed interest-rate expectations.BTC price analysis sees a Binance “plunge protection team” attempting to shore up the market.Analysis warns US bond yields now “well above” targetData from TradingView showed BTC/USD approaching $64,000 as bulls struggled to preserve recent gains.BTC/USD one-hour chart. Source: Cointelegraph/TradingViewGeopolitical tensions and macroeconomic headwinds weighed on crypto markets as appetite for risk assets faded.Trading firm Mosaic Asset Company said rising US Treasury yields were a key driver of the sell-off.“Massive moves are underway across the yield curve despite a weaker than expected consumer inflation report,” it wrote, referring to the latest US Consumer Price Index (CPI) report.Mosaic said the two-year yield was particularly prone to influence the outlook on Federal Reserve interest-rate changes, with risk assets suffering as a result of additional hikes.“The 2-year yield that tends to lead fed funds is now at 4.31% and sits well above the Federal Reserve’s target range,” it continued.US two-year Treasury yield one-week chart. Source: Cointelegraph/TradingViewThe latest data from CME Group’s FedWatch Tool showed that markets still expected the Fed to leave rates unchanged next week, while pricing in a 0.25% hike in September as one of two increases expected before the end of 2026.Mosaic added that those expectations were “placing downward pressure on stock indexes.”Fed target-rate probability comparison for September FOMC meeting (screenshot). Source: CME GroupBitcoin price “plunge protection team” returnsIn ongoing market monitoring, crypto trader Killa said BTC was repeating a familiar short-term trading pattern.Related: BTC supply in profit eyes 60%, but analysis hints recovery may ‘roll back over’“Textbook setup on $BTC. Seen this occur numerous times,” they said on X, repeating a post from early June in which they identified a “plunge protection team” active on the largest crypto exchange Binance.A chart accompanying the post showed layers of bid liquidity below the spot price, with its owners potentially not planning for the positions to be filled.BTC/USDT chart with order-book liquidity data. Source: Killa on X.comAnalytics account Wealthmanager focused on $64,000, warning that a break below that level would “invalidate” the low-timeframe market structure.Trader and analyst Rekt Capital, meanwhile, doubled down on the theory that BTC/USD was repeating behavior from its 2022 bear market, rejecting from the 50-month exponential moving average (EMA) at $65,950.“Bitcoin hasn’t really offered any evidence to the contrary. Still following 2022 historical tendencies,” he summarized.BTC/USD one-month chart with 21, 50EMA. Source: Rekt Capital on X.com

Čítaj viac

BTC supply in profit eyes 60%, but analysis hints recovery may ‘roll back over’

Bitcoin (BTC) investors are back in aggregate profit, but onchain data suggests it’s too early to confirm a new bull market.Key points:Bitcoin supply profitability is improving, but the trend must prove its staying power before confirming a market recovery, says CryptoQuant.Supply in profit is now approaching 60%, up from its 2026 low near 46% less than a month ago.Long-term holder onchain losses continue to dominate — a caveat in a bullish recovery. Bitcoin profit metrics risk second false breakoutAccording to onchain analytics platform CryptoQuant, Bitcoin supply in profit rebounded above the 50% mark in July.Bitcoin supply in profit. Source: CryptoQuant“Bitcoin’s Supply in Profit (%), the share of Bitcoin worth more than its acquisition price, has climbed to 57.5% as of July 22, up from 46.2% on June 30, the 2026 low,” CryptoQuant contributor thechessONCHAIN summarized.Bitcoin supply in profit data (screenshot). Source: CryptoQuantWith nearly 60% of the BTC supply now in profit, the spent output profit ratio (SOPR) of long-term holders (LTHs) is also improving. LTHs are entities whose Bitcoin has remained dormant for at least six months. SOPR measures the proportion of LTH coins moving onchain at a higher price relative to their previous transaction. Values above 1 indicate coins moving onchain mostly in profit, while values below 1 indicate LTH investors are moving coins at a loss, potentially indicating capitulatory activity.ThechessONCHAIN explained that previous bear markets have only ended when both supply in profit and LTH-SOPR meet specific requirements.The 30-day simple moving average (SMA) of LTH-SOPR should remain above 1 without falling below that level for weeks on end, while total supply in profit should be above 64%. “This cycle already produced one failed attempt: from April 28 to June 1 the LTH-SOPR average held above 1.0 for 35 days, Supply in Profit reached 67%, and both rolled back over,” TheChessOnChain noted.Since then, the 30-day SMA of LTH-SOPR has been below 1 for more than 50 days.Bitcoin LTH-SOPR chart with 30-day SMA. Source: CryptoQuantBTC investment recovery stays fragileAs Cointelegraph reported earlier, Bitcoin supply in loss crossed the 50% mark in June, a threshold that has historically preceded bear-market bottoms.Related: Bitcoin will get ‘lift’ from Hyperliquid, Robinhood in next crypto bull market: Bitwise execHere, too, the data reveals similarities among Bitcoin bear markets, with the 50% loss mark sparking the final countdown to a BTC price cycle bottom in previous years.Demand, meanwhile, appears mixed, with weak spot-market interest meeting a rebound in institutional BTC allocation.

Čítaj viac

Bitcoin slides below $65K as Iran conflict fuels $100 oil and bond-yield surge

Bitcoin (BTC) fell below $65,000 on Thursday as US stocks slid amid another round of escalation in Iran.Key points:Several days of US-Iran escalation are beginning to take their toll on crypto and stock market performance.Bitcoin sees three-day lows under $65,000 as traders diverge on the near-term outlook.A 21-day moving average trend line becomes important nearby support.Bitcoin wobbles as Iran destabilizes stocks, oil and US bond yieldsData from TradingView showed BTC/USD hitting three-day lows of $64,799 on Bitstamp.BTC/USD one-hour chart. Source: Cointelegraph/TradingViewRisk assets felt the strain on the day as US President Donald Trump warned that he would blame Iran for recent Houthi strikes on Saudi Arabian commercial vessels.In a post on Truth Social, Trump said that he was “very disappointed” in the Houthis, referencing attacks on US ships from 2025.Source: Donald Trump on Truthsocial.comBy the close of New York trading, the S&P 500 had fallen 1.2% and the Nasdaq had shed 2.2%, while oil prices rallied to their highest since early June, with Brent crude topping $100 a barrel.CFDs on Brent crude oil one-day chart. Source: Cointelegraph/TradingView“Inflation expectations and interest rates are rising sharply again,” trading resource The Kobeissi Letter wrote in a response on X.Ahead of the Federal Reserve’s next interest-rate decision, data from CME Group’s FedWatch Tool showed an increasing chance of officials hiking by 0.25% — traditionally a headwind for crypto markets. Odds neared 40% on Thursday, while a week prior, they were closer to 12%.Fed target-rate probability comparison for July FOMC meeting. Source: CME GroupKobeissi, meanwhile, noted 18-month highs in US 10-year bond yields in a sign of fresh economic strain.Related: Bitcoin will get ‘lift’ from Hyperliquid, Robinhood in next crypto bull market: Bitwise execBTC price analysis offers hope of $73,000Bitcoin traders showed an increasing split over what short-term BTC price action would bring.Commentator Exitpump argued that the Bitcoin relief rally is likely to end by late July, reinforcing an established theory that has already gained traction.“July rally is coming to end, price is at resistance, close your longs, go short once price breaks below 65K,” they told X followers late on Wednesday.BTC/USDT perpetual contract four-hour chart. Source: Exitpump on X.comOthers were more hopeful, with trader Jelle arguing that price was “still making progress.”“Clear this local area and that void towards $70k opens up – could be a quick move to form the new range. Patience remains my game,” he reported.BTC/USD chart. Source: Jelle on X.comAccording to crypto trader and analyst Michaël van de Poppe, the 21-week simple moving average (SMA) at $64,073 was key.“Theoretically, the target area for Bitcoin is reached. However, as long as this stays above the 21-Day MA, I’m sure there will be a higher valuation for Bitcoin in the near-term,” an X post on the day stated, adding:“It’s facing the final hurdle for a big breakout, which is the $68,000 resistance zone. It’s been tested once, and this is the second test that we’ll be facing.”BTC/USDT one-day chart. Source: Michaël van de Poppe on X.comVan de Poppe gave a $73,000 target should bulls successfully break through resistance.

Čítaj viac

HYPE falls as crypto funds queue nearly $150M in locked tokens for withdrawal

Key points: Funds queue ~$150M of HYPE for unstaking, $116M from MulticoinHYPE falls 8% to ~$58; withdrawals dwarf thin spot marketSale intent unclear — Jain denies selling, Selini exit tied to HIP-3 shutdownHyperliquid’s HYPE token slid to around $58 on Wednesday in the face of large unstaking events initiated by crypto funds. Data obtained from hedge fund and analytics platform Block Liquidity shows Multicoin Capital holding a combined $138.78 million in staked HYPE, of which roughly 83% — about $116 million — sits in pending withdrawal. That’s as Selini Capital and Galaxy Digital have queued HYPE tokens worth $4.4 million and $29.4 million, respectively, for withdrawal. In addition, a Multicoin-linked wallet also deposited roughly 167,000 HYPE, worth $11.2 million, to Coinbase, possibly to be sold. As of publication, the price had recovered some of its decline, last trading hands at $59.19, according to CoinGecko data. Trading volume in the past 24 hours was more than $415.4 million. Withdrawal queue dwarfs daily spot turnoverThese bulk unlocks will be processed in five to seven days and will result in a nearly $150 million overhang in HYPE’s liquid supply. While perpetuals for the tokens trade around $400 million daily, the spot market for HYPE is significantly smaller. Block Liquidity’s flow tracker recorded just $72.8 million in HYPE spot volume across the roughly 28 hours to Wednesday morning, with 1,463 unique buyers against 982 sellers. Wintermute was the largest net buyer at over $9 million, while the top net seller offloaded $5.2 million.Top buyers and sellers during HYPE’s plummet to as low as $57.39. Source: Blockliquidity.xyzA withdrawal queue nearly double the daily spot turnover helps explain the recent apprehension in the market. HYPE has fallen about 11% over the past week. However, whether the unlocked tokens are about to be sold into the market is far from clear. The unstaking by Selini Capital appears to be linked to the shutdown of the HIP-3 CASH perpetuals markets run by DreamCash. Like many recent HIP-3 deployments, DreamCash’s USDt (USDT)-based markets struggled to attract liquidity, especially as USDC (USDC) became more deeply entrenched in the Hyperliquid ecosystem. Recent: Bitcoin analysis eyes ‘serious volume’ after Binance sees 9K BTC daily outflowLaunching a builder-deployed perpetuals marked under HIP-3 requires staking 500,000 HYPE as a slashable security bond, which can be refunded when the market goes defunct. Selini Capital may decide to sell this HYPE allocation through an OTC desk.Wallet associated with Selini Capital invoking StakingTransfer Method. Source: HypurrScan.io Sale or HIP-3 war chest?While Selini’s recent HYPE unlock represents the shutdown of a HIP-3 market, Multicoin’s HYPE may at least partially be headed for a new deployment. Last week, the firm made its first Hyperliquid ecosystem venture bet by leading a $1.75 million seed round into Trasia. The latter is an Asia-focused, noncustodial trading platform that plans to launch perpetuals for Asian equities. Managing partner Tushar Jain said on X that Trasia is targeting “net new users” unfamiliar with Hyperliquid. He claimed in an X post later on  Wednesday night that the unstaked HYPE was not intended for selling. The market will watch where funds will flow on the July 28 unlock. Although absorption by new HIP-3 deployments or mere asset reallocation remains the base case, HYPE has not yet recovered to its recent highs.Multicoin Capital managing partner Tushar Jain issues clarification. Source: X.com

Čítaj viac

Bitcoin will get ‘lift’ from Hyperliquid, Robinhood in next crypto bull market: Bitwise exec

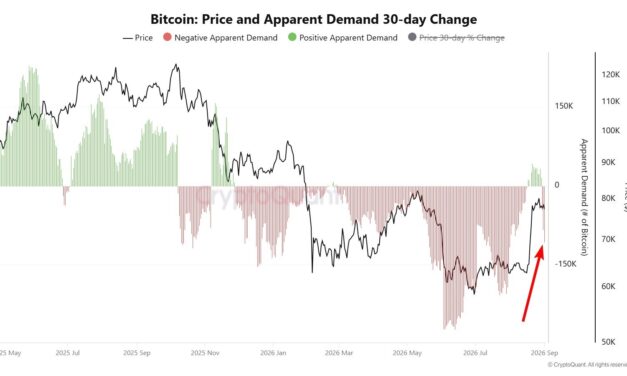
Bitcoin (BTC) is “finally showing signs of a bottom,” but the next bull market will have a different source.Key points:TradFi integrations, particularly Hyperliquid and Robinhood, will drive the next crypto bull market, says Bitwise’s Matt Hougan.The resulting tide should “lift” the largest cryptocurrencies with it, including Bitcoin and Ether.Apparent demand for BTC is already showing signs of reversal, per Bitwise data.Hyperliquid, Robinhood catalyst to “lift most of” crypto sectorIn a blog post on Wednesday, Matt Hougan, chief investment officer at crypto asset manager Bitwise, revealed his picks for what will “lift” BTC price action going forward.BTC/USD is gaining ground against US stocks, Hougan notes, but investors should look elsewhere for the next long-term crypto comeback.“So how should you start positioning for the new bull market?” he queried. “By looking at two entities that are leading this convergence from opposite sides: Hyperliquid (HYPE) and Robinhood (HOOD).”For Hougan, the bull market will depend on crypto-focused integrations that bring the market’s inherent benefits, such as 24/7 trading, to the TradFi realm.“Today, nearly half the volume on Hyperliquid is in conventional assets like oil, silver, and the S&P 500. It’s expanding into spot commodities, prediction markets, and options,” he said about Hyperliquid.HYPE/USDT one-day chart. Source: Cointelegraph/TradingViewHougan also sees competition from traditional financial players, like the Robinhood Chain layer-2 network, as a key catalyst to bring about a broader crypto renaissance.“I suspect the coming bull market will be big enough to lift most of the sector,” he said. “I’m bullish on the majors—Bitcoin, Ethereum, Solana, etc.—and on crypto equities. But there are two types of investments I think are particularly well positioned.”HOOD/USD one-day chart. Source: Cointelegraph/TradingViewThe Bitwise executive has remained optimistic on Bitcoin and the wider market throughout 2026, in February predicting that the end of crypto winter would come “sooner rather than later.”“Here’s the good news: We’re closer than you think,” he wrote at the time.Bitcoin apparent demand reverses higherAs Cointelegraph reported, Bitcoin traders broadly agree that while some bottom signals are already flashing, the bear market has several months or more left to run.Related: Bitcoin analysis eyes ‘serious volume’ after Binance sees 9K BTC daily outflowSpot demand remains weak and has become a key talking point, even on shorter time frames. Here, however, Bitwise also sees a potential shift underway.In an X post on Thursday, European head of research, Andre Dragosch, described “re-accelerating” apparent demand.Apparent demand measures the difference between newly-mined BTC and the supply inactive for at least one year. Bitcoin apparent demand data. Source: Andre Dragosch on X.com

Čítaj viac

Bitcoin may have bottomed before its traditional cycle low: Grayscale’s Pandl

Crypto-focused asset manager Grayscale said that Bitcoin’s price may have bottomed earlier than the traditional four-year cycle, which would imply a cycle low in September or October. Grayscale’s head of research, Zach Pandl, argued that Bitcoin (BTC) has “grown up” as an asset and is increasingly driven by macroeconomic factors. “If the Fed forgoes rate hikes and economic growth holds up well, Bitcoin’s price may already have bottomed,” Pandl wrote in a Wednesday report.Earlier in July, crypto brokerage K33 pointed to more than 50% of the Bitcoin supply being held at a loss as another signal of an imminent market bottom, arguing that Bitcoin’s price has historically bottomed weeks after more than half of the supply fell underwater in prior cycles.In a June interview, Swan Bitcoin CEO Cory Klippsten told Cointelegraph that the record holdings of long-term investors, which reached an all-time high of 14.7 million Bitcoin, are another signal of an imminent Bitcoin bottom.Bitcoin price cycles that correspond to shifts in macro backdrops. Source: GrayscaleFed interest rate expectations, macro factors in the “driver’s seat”Grayscale’s Pandl said that macro factors, such as the Federal Reserve’s interest rate decisions, are in the “driver’s seat” for Bitcoin price, which could “bottom when these macro factors turn around.”The Fed’s next interest rate decision is due on July 29. Market participants are pricing in a 66% chance that the Fed will hold interest rates unchanged, down from 88% a week ago, according to the CME Group’s Fedwatch tool.Target rate probabilities for the Fed’s July 29 meeting. Source: CMEGroupPandl argued that prior Bitcoin bear markets have corresponded with slowing economic growth and rising real interest rates.Related: Hobby-level miner bags $200K solo BTC block with budget Bitaxe rigHowever, regulatory uncertainty may still limit Bitcoin’s price action. In a June 26 report, Pandl said that if the CLARITY Act doesn’t pass this year, Strategy and other treasury companies may continue to further “deleverage,” causing Bitcoin to “fall moderately further.”Other analysts are expecting a later bottom, such as Lebit Mining Pool founder Jiang Zhuoer, who predicted that Bitcoin would only bottom between October and December 2026, or about six months after Strategy’s Multiple to Net Asset Value (mNAV) found its cycle low.  Magazine: Bitcoin nearing late stages of bear market: Jamie Coutts, Real Vision

Čítaj viac
Načítava

Získaj BONUS 8 € v Bitcoinoch

nakup bitcoin z karty

Registrácia Binance

Burza Binance

Aktuálne kurzy