Značka: Markets

Bitcoin price rejects at $83K as Trump calls Iran deal 'big assumption'

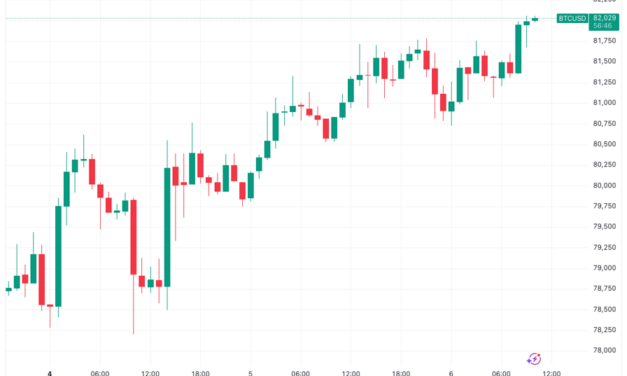
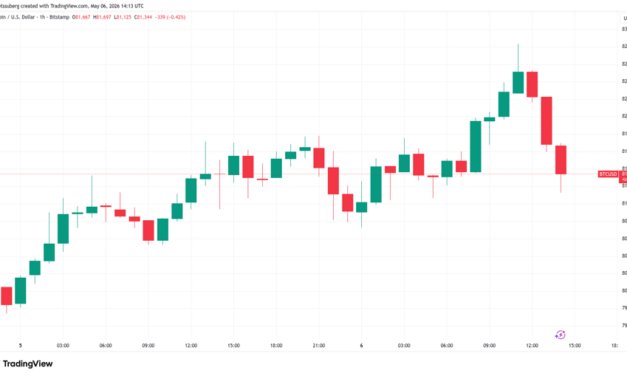
Bitcoin (BTC) cooled from new 13-week highs at Wednesday’s Wall Street open amid mixed signals over a US-Iran peace deal.Key points:Bitcoin stops short of tapping $83,000 as momentum becomes guided by geopolitical developments.Oil sees flash volatility around rumors of the Strait of Hormuz opening.Bitcoin trader sees a price reset to a $78,400 trend line.Iran deal let-down sours Bitcoin’s attack on $83,000Data from TradingView showed a new local peak for BTC/USD of $82,833 on Bitstamp.BTC/USD one-hour chart. Source: Cointelegraph/TradingViewThe pair made fresh gains amid reports of a 14-point ceasefire agreement potentially coming into effect — one that would include resumption of oil traffic through the Strait of Hormuz.Hours later, however, US President Donald Trump said that Iran’s agreement to the terms of the truce was “perhaps, a big assumption.”“If they don’t agree, the bombing starts, and it will be, sadly, at a much higher level and intensity than it was before,” he added in a post on Truth Social.Source: Truth SocialBitcoin reacted by erasing its upside to circle $81,500 at the time of writing, still up around 1% on the day.Oil also saw volatility, with WTI dropping over 10% in a matter of hours before rebounding to $96 per barrel.CFDs on WTI crude oil one-hour chart. Source: Cointelegraph/TradingViewCommenting on X, trading resource The Kobeissi Letter reported what it called “unusually large” short interest on WTI, which totaled nearly $1 billion, immediately before the drop.Light crude oil futures chart. Source: The Kobeissi Letter/XBTC price focus switches to $78,000 and higherBitcoin traders, meanwhile, looked to patches of potential liquidations on exchange order books for clues as to where price might head next.Related: Bitcoin can crash to $50K if ‘most critical’ bear market test fails: Analysis“Above, the $82.4K area still has some left. But price did take out most of the local liquidity from the past day. With price at 3 month highs, we would need to zoom out to see the other major levels,” trader Daan Crypto Trades told X followers. “Below, the $80.1K & $78.2K levels are good to watch if price were to trade into them.”Crypto liquidation history (screenshot). Source: CoinGlassData from CoinGlass put total crypto liquidations over the past 24 hours at more than $550 million, with shorts accounting for $400 million of the total.Trader CrypNuevo called BTC/USD “overextended” on short time frames, seeking a retracement to the 50-period simple moving average (SMA) on the four-hour chart. That stood at $78,432.“Ideally it continues pushing straight higher without any exhaustion signs and it will overextend price even more so the short will be more atractive and worth it when we see those signs at higher prices,” he wrote on X.BTC/USD four-hour chart with 50SMA. Source: Cointelegraph/TradingViewEarlier, Cointelegraph reported on concerns that historical precedent called for the failure of Bitcoin’s current breakout attempt.This article is produced in accordance with Cointelegraph’s Editorial Policy and is intended for informational purposes only. It does not constitute investment advice or recommendations. All investments and trades carry risk; readers are encouraged to conduct independent research.

Čítaj viac

Zcash price may hit $800 as $2.7B hedge fund reveals ‘significant position’ in ZEC

Zcash (ZEC) has outperformed the broader crypto market over the past month, rising by over 125% compared to an average 15% gain for most coins.ZEC/USD versus TOTAL crypto market cap 3o-day performance chart. Source: TradingViewThe privacy-focused cryptocurrency may rally further in the coming weeks as a mix of bullish technical and fundamental catalysts converges.Key takeaways:US crypto hedge fund Multicoin Capital revealed it has been buying ZEC since February.Robinhood will list ZEC as Zcash’s network activity has been booming in the past weeks.ZEC technicals are painting a 40% rally setup.Multicoin disclosure boosts ZEC momentumOn Tuesday, Multicoin Capital, a US-based crypto hedge fund managing $2.687 billion in assets, revealed a “significant position” in ZEC, fueling speculation that institutional investors are warming up to privacy-focused digital assets again.Its co-founder, Tushar Jain, revealed that the firm had been accumulating ZEC since February.Jain described Zcash as “the most direct public market vehicle” for exposure to private, censorship-resistant and seizure-resistant money, framing the investment as a bet on rising demand for financial sovereignty and cypherpunk-style privacy tools.Source: XZEC has rallied by over 43% in the past 24 hours, showing that traders have interpreted the Multicoin announcement as institutional validation of the privacy coin narrative.ZEC’s flag breakout hints at further gainsFrom a technical perspective, Zcash has entered the breakout phase of a prevailing bull flag pattern on the weekly chart.A bull flag forms when the price consolidates lower within a descending parallel channel after a strong uptrend. It resolves when the price breaks above the channel’s upper trendline and rises by as much as the previous uptrend’s height.ZEC/USDT weekly chart. Source: TradingViewApplying that rule to ZEC’s chart puts its breakout target near $800. As of Wednesday, Zcash traded as high as $607, leaving the token on track to test the bull flag’s measured upside target located roughly 40% above. Zcash’s weekly relative strength index (RSI), a momentum indicator that measures whether an asset is overbought or oversold, also suggests the rally may continue. The RSI currently remains just below 70, a level traders typically associate with overheated market conditions, indicating ZEC may still have room to climb before buyers show signs of exhaustion.BitMEX Co-Founder Arthur Hayes said ZEC’s target is 10% of Bitcoin’s market capitalization, a scenario that would imply a multi-trillion-dollar valuation for ZEC and prices potentially ranging between $8,000 and $10,000 per coin based on current supply levels.Source: XRobinhood listing, tightening ZEC supply adds tailwindsZcash’s breakout also has fundamental support.ZEC has rallied alongside the broader crypto market as US–Iran peace-deal hopes improve risk appetite, mirroring patterns in early April. Its Robinhood listing on April 23 added another tailwind by opening spot access to 25.9 million funded users, including those in stricter jurisdictions like New York.Meanwhile, more than 30% of circulating ZEC now sits in shielded addresses, according to data resource ZecHub.WIKI. This tightening supply shows a big jump in demand for private on-chain transactions over the past year.Zcash shielded supply weekly chart. Source: ZecHub.WIKIThis article is produced in accordance with Cointelegraph’s Editorial Policy and is intended for informational purposes only. It does not constitute investment advice or recommendations. All investments and trades carry risk; readers are encouraged to conduct independent research.

Čítaj viac

Bitcoin short-term holder cost basis eyes $92K as next price target

Bitcoin (BTC) buyers resumed their activity during the early Asian trading hours on Wednesday, pushing the price to a new multi-month high of $82,240.Onchain indicators, including the short-term holder (STH) cost basis, suggest that the BTC price can go higher, with the next big target at $92,000. Key takeaways:Bitcoin holders are back in profit, increasing the chances of reaching $92,000.BTC bulls must overcome resistance at $84,000 to continue the uptrend. Bitcoin price eyes $92,000 nextData from TradingView shows that BTC/USD had risen 37% to trade above $82,000 from its multi-month low of $60,000 reached on Feb. 6.This rally has seen Bitcoin rise above the cost basis of its short-term holders, currently at $79,000, according to data from Glassnode.STH cost basis refers to the average purchase price of investors who have held Bitcoin for less than 155 days.Historically, reclaiming this level has coincided with extended recovery phases, as investors returning to profit are often less inclined to sell and more willing to add exposure. The shift can also attract fresh buyers and trigger short squeezes as bearish positioning unwinds.Related: Bitcoin in ‘disbelief rally’ as traders spot $84K BTC price targetThe chart below shows that when the price reclaimed its realized price in April 2025, it rallied 30% toward the upper band of this metric at $112,000 four weeks later. Similar occurrences in October 2024, October 2023 and January 2023 also saw the BTC price rally toward the same onchain level, as shown in the chart below.If BTC breaks above the line, there is a good chance of seeing $92,423 in the short term, about 13% above the current price.Bitcoin STH cost basis. Source: Glassnode“Bitcoin has crossed the coveted ‘short-term holder breakout,’” analyst Mitchell Askew said in a Wednesday post on X, adding:“This typically signals the end of bear markets and consolidation periods.”Bitcoin analyst Plan C said if the price “can find sustained support above this level,” it would confirm that the 50% drawdown from the $126,000 all-time high was just a “mid-cycle correction.” Meanwhile, Bitcoin’s STH spent output profit ratio (SOPR) has flipped positive, showing early signs of a shift in market behavior.The metric is “back above 1, which usually means recent buyers are back in profit and selling pressure is easing,” analyst BitBull said in a Wednesday post on X, adding:“This is where markets often move from accumulation into early bullish phases.”Bitcoin STH SOPR. Source: BitBullAs Cointelegraph reported, several technical indicators suggest that Bitcoin’s bottom is in, with analysts setting targets as high as $250,000 within a year. Bitcoin’s price needs to flip $84,000 into supportBitcoin’s bullish weekly close above the 20-week exponential moving average and true market mean at $78,300 has convinced traders it can move higher from current levels.Analysts say the continuation of Bitcoin’s rally now hinges on breaking above the $82,000-$84,000 supply zone. Bitcoin is retesting the low $80,000s region, which “corresponds with the November lows and the Daily 200MA/EMA coming in a bit higher,” trader and analyst Daan Crypto Trades said in his latest Bitcoin analysis on X.Note that the 200-day EMA and the 200-day simple moving average are at $82,600 and $83,402, respectively.This is a “big level” for Bitcoin bulls, the analyst said, adding:“Acceptance higher can lead to a further bounce back into the $90Ks, but a rejection will likely keep this rangebound with $80K as the ceiling for a while.”BTC/USD daily chart. Source: X/Daan Crypto TradesMN Capital founder Michael van de Poppe shared a chart showing $84,000-$86,000 as the “next resistance zone,” which, if broken, could potentially see Bitcoin “continue to the 50-Week MA around $90K.”Meanwhile, Bitcoin’s whale order book showed “big ask orders concentrated” between $82,000-$84,000, making it a crucial level for the bulls to overcome. Bitcoin whale order book. Source: CoinGlassAs Cointelegraph reported, the BTC/USD pair may rise as high as $92,000 if resistance at $84,000 is broken.This article is produced in accordance with Cointelegraph’s Editorial Policy and is intended for informational purposes only. It does not constitute investment advice or recommendations. All investments and trades carry risk; readers are encouraged to conduct independent research.

Čítaj viac

Bitcoin can crash to $50K if 'most critical' bear market test fails: Analysis

Bitcoin (BTC) is approaching its “most critical” resistance hurdle of the bear market, new BTC price analysis says.Key points:Bitcoin has arguably its most important resistance battle at $84,000.A failure to reclaim a 200-day trend line opens up the road down to $50,000 lows, warns analysis.The bull market support band needs to hold in the event of a corrective phase.Bitcoin faces battle to avoid “bear cycle continuation”In an X post on Wednesday, crypto investment company TradingShot revealed the next key decision point for Bitcoin bulls.BTC price action continues to test $82,000, according to data from TradingView, but it is the area around $84,000 that will be essential to reclaim as support next.BTC/USD one-hour chart. Source: Cointelegraph/TradingView“Bitcoin is about to test its 1D MA200, the most critical Bear Cycle Resistance but has also already entered the Pivot Zone formed from the previous Low,” TradingShot wrote.An accompanying chart compares current price performance with the 2022 bear market, with the 200-day simple moving average (SMA) at the center.At the time, BTC/USD retested the 200-day SMA from below after initially losing it, but the reclaim failed — and the result was a trip to new macro lows.“This is a familiar pattern that $BTC forms during downtrends, it was also emphatically present during the 2022 Bear Cycle where those Pivot Zones got formed from a previous Low that was later tested as Resistance,” the analysis continues.BTC/USD one-week chart. Source: TradingShot/XShould history repeat, TradingShot is eyeing a dramatic correction, with a bottom target at $50,000.“A rejection now on this ‘Stepping Stones’ pattern will confirm the Bear Cycle continuation for BTC to $50000, while a break-out will invalidate it,” it concludes.As Cointelegraph reported, the $50,000 zone has long been a favorite among traders who see the bear market continuing.BTC price support band as “main focus”If the 200-day SMA is the resistance level to beat, two trend lines immediately below price are essential to retain as support, commentators argue.Related: Bitcoin price nears $82K as ‘big level’ sparks warning of fresh macro rejectionThe so-called bull market support band, formed of the 20-week SMA and the 21-week exponential moving average (EMA), sits near $78,000.In some of its latest X analysis, trading account Cryptic Trades said that the support band should stay the “main focus.”“I believe that as long as price keeps holding above this range, as well as the April 2025 bottoming formation around $76K, the broader market structure remains intact,” it wrote on Wednesday alongside an explanatory chart. “The other key level to track is the lost high-timeframe support range marked in purple around $84K, where I believe we could see a short-term rejection.”BTC/USD one-day chart. Source: Cryptic Trades/XThis article is produced in accordance with Cointelegraph’s Editorial Policy and is intended for informational purposes only. It does not constitute investment advice or recommendations. All investments and trades carry risk; readers are encouraged to conduct independent research.

Čítaj viac

Bitcoin holds $81K amid flat derivatives markets: Is the rally sustainable?

Key takeaways:While Bitcoin onchain activity and derivatives show a lack of participation from traders, record spot ETF inflows point to strong institutional demand.The absence of leveraged longs may actually fuel further upside as sellers are forced to buy back if Bitcoin edges higher.Bitcoin (BTC) gained 7% over the past week, breaking above $81,000 for the first time in over three months. Despite the strong price performance, data suggest that Bitcoin derivatives lack optimism from investors and this raises questions on the rally’s sustainability. Bitcoin derivatives fail to mirror investors’ joy over $81,000Macroeconomic and several onchain metrics point to softening demand.Bitcoin 2-month futures basis rate. Source: LaevitasBitcoin monthly futures traded at a 1% annualized premium (basis rate) relative to spot markets on Tuesday, landing well below the neutral threshold. Typically, sellers demand a 4% to 8% premium to compensate for the cost of capital. This cautious sentiment took hold in late January, when Bitcoin was trading at $90,000, partly explaining the current lack of enthusiasm.To confirm if the issue is limited to futures, one should assess the demand balance between put (sell) and call (buy) options. Under neutral conditions, these instruments trade within a -6% to +6% premium relative to each other. When professional traders fear downside risks, the delta skew metric moves above 6%.Bitcoin 30-day options delta skew (put-call) at Deribit. Source: LaevitasThe Bitcoin delta skew moved closer to the 6% neutral threshold on Tuesday, though it remained slightly bearish. Whales and market makers do not appear particularly worried about an imminent crash, but bulls’ conviction has clearly stagnated. With Brent crude oil prices hovering near $110, persistent inflation concerns are weighing on traders’ expectations for economic growth.US 5-year inflation expectation vs. Euro 10-year government bond yields. Source: TradingViewUS inflation expectations neared a 10-year high of 2.5%, according to data from the Federal Reserve Bank of Cleveland. Simultaneously, investors are demanding higher returns to hold Eurozone government bonds. Despite these inflationary pressures, the tech-heavy Nasdaq 100 Index surged to an all-time high on Tuesday, signaling a broader risk-on environment.Declining Bitcoin onchain activity faces heavy spot ETF accumulationBitcoin may have benefited from this increased risk appetite, but weak onchain metrics hints with declining retail demand.Bitcoin onchain daily volume (USD) vs. number of transfers. Source: Glassnode / CointelegraphDaily network transfer volume has plummeted 54% from three months ago, dropping to $4.1 billion. Similarly, the number of transfers is nearing its lowest level in over five years. While Bitcoin’s price action is not strictly dependent on onchain activity, these metrics serve as a proxy for general public interest and adoption.The temporary pause in Strategy’s (MSTR US) accumulation ahead of its earnings release may have sparked some unwarranted fear. The company, led by Michael Saylor, maintained an aggressive acquisition pace over the previous four weeks. However, analysts expect Strategy to report a quarterly net loss due to its mark-to-market Bitcoin accounting.Related: Bitcoin turns risk on as stocks hit new highs and miner profits rise: Is $85K BTC next?Macroeconomic weakness and declining onchain activity negatively impacted Bitcoin derivatives, but the $1.16 billion in net inflows into US-listed Bitcoin spot exchange-traded funds (ETFs) between Friday and Monday suggests rising institutional demand.Ultimately, the lack of demand for leveraged bullish positions in Bitcoin derivatives might serve as a catalyst for further upside. As prices climb, shorts (sellers) may be forced to close their positions at a loss, fueling additional momentum.This article is produced in accordance with Cointelegraph’s Editorial Policy and is intended for informational purposes only. It does not constitute investment advice or recommendations. All investments and trades carry risk; readers are encouraged to conduct independent research.

Čítaj viac

Bitcoin short liquidations push BTC to multi-month highs: Is $90K next?

Bitcoin (BTC) may have a clear path to $90,000 after $7.9 billion in short liquidations in February put pressure on the bears. Data show liquidations came in three waves that extended from February through April. The liquidations highlight a growing imbalance as BTC traders continue to build short positions above $80,000, while the price holds firm, creating repeat conditions for future short squeezes.Repeat short squeezes pressure bearsBitcoin researcher Axel Adler Jr. tracked over $7.9 billion in forced short liquidations since early February. The largest spike hit $737 million on Feb. 13, followed by multiple waves through March and April. The liquidation volumes ranged from $2–28 million per day before jumping back to $175 million on May 4. That spike came during a quiet week, pointing to renewed short exposure near $80,000. The pattern shows consistent reloading of bearish positions at higher levels.Bitcoin trend pulse. Source: Axel Adler Jr.The trend pulse data adds context to this behavior. The model moved from bear mode into neutral mode in early April. The short-term momentum has turned positive, while the long-term trend awaits confirmation from a bullish crossover of the 30-day and 200-day simple moving averages (SMAs). Axel Adler Jr. said each major liquidation wave formed while the trend pulse sat in neutral mode, a transition phase after bear mode without a full bullish confirmation. The largest spikes all occurred during this phase. The price was effectively at a crossroads, while traders kept adding short positions. That pattern shows repeated strength fading, followed by forced liquidations, creating pressure that can extend higher if current levels hold above $80,000-$81,500. Related: Bitcoin price nears $82K as ‘big level’ sparks warning of fresh macro rejectionBTC price holds key breakout zone above $80,000Market analyst Coin Niel pointed to continued BTC exchange outflows, with net flows of -837 BTC on May 5. The move signals ongoing accumulation, though smaller than the -6,590 BTC outflows on Monday, keeping the spot sell pressure limited.Bitcoin open interest on all exchanges. Source: CryptoQuantFunding rates hold near -0.0045, suggesting longs are not crowded while the short-side pressure remains active. BTC open interest climbed 6% to $29 billion, its highest level since Jan. 31, increasing sensitivity to large price swings. The BTC price action has turned constructive after Bitcoin broke above a descending trendline that capped rallies through April. The 100-day exponential moving average (EMA) now sits just below the price, acting as dynamic support. BTC is also holding near $81,500, aligned with the short-term holder cost basis, a key level that keeps recent buyers in profit, and may further reduce selling pressure. BTC/USDT on the one-day chart. Source: Cointelegraph/TradingViewThe upside range of $86,000 to $90,000 aligns with a prior supply zone, where sellers stepped in and halted the recovery. This area marks a cluster of past selling activity, with relatively fewer resistance levels before it. Below, the $76,000–$78,000 range serves as the first demand zone, supported by recent activity and a developed daily fair-value gap from last Friday. Crypto trader KriptoHolder noted that liquidation clusters are shaping the near-term direction. The short liquidations sit around $81,000–$82,000, while a larger pool of long exposure rests between $77,000 and $78,000. Data indicates $1.12 billion in cumulative shorts are at risk near $82,500, compared with over $4.2 billion in long positions facing liquidation near $77,000, defining a tight liquidity imbalance.Related: Bitcoin short-term cost basis approaches profitability, but $80K must flip to support firstThis article is produced in accordance with Cointelegraph’s Editorial Policy and is intended for informational purposes only. It does not constitute investment advice or recommendations. All investments and trades carry risk; readers are encouraged to conduct independent research.

Čítaj viac

Crypto Fear and Greed Index turns neutral for first time since January: Is $100K BTC next?

The Crypto Fear and Greed Index hit 50 on Tuesday, measuring “neutral” for the first time since Jan. 17. This shift ended a 108-day stretch dominated by negative sentiment. The index gauges market sentiment using volatility, momentum, trading volume, and social signals. A score below 25 signals “extreme fear” or risk aversion, while 26–49 reflects cautious positioning or “fear,” with higher readings indicating improving investor confidence. Crypto Fear and Greed Index. Source: Alternative.meThe index’s move to 50 marks its first neutral score since mid-January and follows a steady recovery in the total crypto market capitalization, which rose 5.45% in May. Since March, the market has expanded by 16.51%, climbing to $2.66 trillion from $2.28 trillion.TOTAL market cap on the one-month chart. Source: Cointelegraph/TradingViewThe positive shift in sentiment aligns with Bitcoin’s attempt to stabilize above the $81,000 level. Crypto analyst Darkfost noted that BTC sentiment is turning more constructive as the price tests higher levels. The analyst added that a separate sentiment index, ranging from -100 to +100, has also edged into the greed zone. This indicates that investor confidence is improving, with a growing preference to hold BTC rather than exiting positions.Bitcoin unified sentiment index. Source: CryptoQuantJanuary showed a similar shift in sentiment before the momentum faded. Darkfost pointed to the current phase as a potential pivot, with investor behavior shaping the next move.Related: Bitcoin ‘supercycle’ or a bear market rally? BTC breaking $81K has traders at oddsStablecoin outflows may stall momentum Binance stablecoin netflows have recorded a cumulative outflow of $11.8 billion since April 25. This metric tracks the movement of stablecoins into and out of the exchange and is often used as a proxy for available buying power.Positive net flows signal capital entering the exchanges, often associated with accumulation. A negative net flow indicates capital leaving, which can reduce liquidity for spot crypto purchases.Binance stablecoin netflows. Source: CryptoQuantRecent data shows a sustained drainage phase, with daily outflows exceeding $1.5 billion across multiple sessions. Earlier in April, Binance saw consistent inflows as Bitcoin climbed from $74,000 toward $78,000. That inflow cycle has now reversed.Market analyst Crazzyblockk noted that the earlier buildup of stablecoin reserves helped fuel the upward movement. The current outflow trend suggests this pool of deployable capital has thinned in the short term, potentially tempering the bullish momentum for BTC and other crypto assets. Related: Crypto products post 5th straight week of inflows despite mid-week selloffThis article is produced in accordance with Cointelegraph’s Editorial Policy and is intended for informational purposes only. It does not constitute investment advice or recommendations. All investments and trades carry risk; readers are encouraged to conduct independent research.

Čítaj viac

XRP price copies 2025 chart fractal that last time sparked 66% gains

XRP (XRP) is currently displaying a technical pattern that follows a 2025 fractal that produced 66% gains. The daily chart shows XRP price breaking out of a bull flag, which can also result in massive gains.Key takeaways:XRP is currently displaying a technical pattern similar to the 2025 price action that ignited a 66% price rallyXRP’s spot taker CVD has turned positive, suggesting confidence among buyers.XRP price chart fractal targets $2.35XRP’s price action in the daily time frame mirrors a technical structure after recovery from the  April 2025 cycle low, preceding a sharp upward continuation. The formation came after a multi-week consolidation inside a bull flag, followed by a bullish cross by the 20-day and 50-day exponential moving averages (EMAs), as shown in the chart below.Related: XRP set for ‘strongest’ 2026 monthly ETF inflows as bulls target $2The XRP/USD broke above the upper boundary of the flag in early July 2025, triggering a cascade of short liquidations and fresh buying that ultimately delivered 66% gains to its current all-time high of $3.66, less than two weeks later.XRP/USD daily chart. Source: Cointelegraph/TradingViewXRP’s current price action is following a similar pattern, with the price again breaking out of a bull flag pattern and a pending bullish crossover from the moving averages.If history repeats itself, XRP/USD may rally by more than 66% toward $2.35. Further confirmation of a trend reversal now hinges on the price holding above $1.40, which is also the flag’s upper boundary and the 50-day SMA.“XRP is gaining momentum above $1.40, holding firmly over its 100-hour SMA” analyst Jack Straw said in a Tuesday post on X, adding:“A clean break above $1.420 could trigger the next leg up.”Fellow analyst Sam Mti said XRP was “looking good” after a buy signal from the MTI indicator, with potential to move above $1.45 as long as support at $1.40 holds. XRP/USD 1-hour chart. Source: Sam Mti As Cointelegraph reported, buyers will gain the upper hand on a close above the $1.40 level, paving the way for an XRP rally toward $2, then to $2.40.XRP’s spot taker CVD suggests buyers are backXRP’s 90-day spot taker cumulative volume delta (CVD) shows that buy-orders (taker buy) have become dominant again. CVD measures the difference between buy and sell volume over three months.The metric flipped positive (green bars in the chart below) on May 1 as the price broke above the $1.38 resistance and has remained positive since. This indicates optimism among traders, as they’re actively positioning for further gains.If the CVD remains green, it means buyers are not backing down, which could set the stage for another rally as seen in the past. A similar occurrence in June 2025 accompanied 70% XRP price gains. XRP spot taker CVD. Source: CryptoQuantMeanwhile, XRP’s open interest (OI) delta flipped positive, rising to as high as $27 million on May 1, reflecting  a change in active derivatives positioning, data from CryptoQuant shows“A sharp positive reading suggests that new positions are being added to the market,” CryptoQuant analyst Amr Taha said in a QuickTake analysis on Tuesday, adding:“When this happens while price is rising, it often shows that traders are increasing exposure as momentum begins to recover.”XRP OI delta across exchanges. Source: CryptoQuantThis article is produced in accordance with Cointelegraph’s Editorial Policy and is intended for informational purposes only. It does not constitute investment advice or recommendations. All investments and trades carry risk; readers are encouraged to conduct independent research.

Čítaj viac

Bitcoin ‘supercycle’ or bear-market rally? BTC breaking $81K has traders at odds

Bitcoin (BTC) climbed 3.5% this week to hit $81,325 on Tuesday, its highest level since January. But is Bitcoin’s multi-month highs just a bear-market rally, or has it already bottomed to resume the so-called “supercycle,” as some traders suggest?Key takeaways:Bitcoin may rally to $180,000–$200,000 as institutional accumulation offsets bear-market pressureSelling pressure remains firm near the $80,000–$82,000 area.BTC/USD daily price chart. Source: TradingViewBitcoin “supercycle” thesis targets $250,000 nextBitcoin’s rebound now stands at 35.70% from its February low of $59,930. Still, BTC remains roughly 36% below its October 2025 record high near $126,200. This has sparked debate among traders, with some analysts predicting a return to new all-time highs this year.Bitcoin is not in a typical boom-bust cycle but transitioning into its first “supercycle,” according to analyst PlanC. In a Tuesday post, he projected a move to above $250,000 by 2027–2028 from the $16,000 bear-market low in November 2022.His framework splits the current cycle into three phases: an initial rally to $126,000 (already achieved), a mid-cycle correction toward $60,000 (done, as well), and a final expansion phase targeting new highs above $250,000. Bitcoin supercycle illustration. Source: PlanCThe key distinction, he noted, is that the recent ~50% drawdown resembles prior mid-cycle resets, such as 2020 and 2021, rather than the deeper 70%–90% bear markets seen in 2014, 2018, and 2022.In the current scenario, institutional demand is absorbing over 500% of the new daily BTC supply, turning sharp crashes into softer corrections.Still, the thesis hinges on Bitcoin holding above its mid-cycle floor near $60,000. A breakdown below that level would invalidate the supercycle theory and reopen the case for a prolonged bear phase.”I think once BTC clears the mid 80’s and holds the chances of seeing new highs are quite high,” analyst Pentoshi said in a Tuesday post, citing the ongoing supply squeeze.He added:”In terms of probabilities, I think the lows are in and we could see BTC trade as high as $180k between this year and next.”Elliott Wave setup hints that Bitcoin’s bottom is inBitcoin’s latest rebound has strengthened the case that its correction from the January 2025 high has ended, according to trader Decode’s Elliott Wave analysis.The chart shows BTC likely completing a three-part A-B-C correction, with the final “C” wave bottoming near $60,000. In Elliott Wave terms, that usually marks the end of a corrective phase and can precede a new five-wave advance.BTC/USD weekly chart. Source: TradingView/DecodeDecode notes that Bitcoin has now moved back above its November low, even if only slightly. That overlap invalidates bearish wave counts that expected “one more low” within the same downward impulse.As a result, the bearish case has narrowed. BTC could still be inside a larger correction, but the cleaner setup now suggests the recent $60,000 area was likely a cycle low.A decisive reclaim of the $78,000–$80,000 range as support would further boost the odds of a BTC price rally toward $90,000–$100,000 next.Sellers step in near a key resistance confluenceBitcoin’s rebound is running into a familiar resistance cluster, raising the risk of a short-term pullback.As of Tuesday, BTC is testing the confluence of its 200-day exponential moving average (200-day EMA, the blue line) and the upper boundary of a bear flag channel near the $80,000–$82,000 region.BTC/USD daily chart. Source: TradingViewThis resistance confluence increases the odds of a Bitcoin pullback in the coming days, with the downside target sitting around the flag’s lower trendline near the $70,000–$72,000 area.A breakdown below the bear flag’s lower trendline risks pushing the price under $50,000.A similar setup played out in January, when Bitcoin rallied into its 200-day EMA after a prolonged downtrend but failed to break higher. The rejection triggered another leg down before a more durable bottom eventually formed.Also, the 200-day EMA served as strong resistance to Bitcoin’s bear market rallies in the past, particularly in 2018 and 2022, as highlighted in the chart shared by analyst Jason Pizzino. Source: XBTC’s price dropped by an average of 40% after testing the 200-day EMA as resistance during the 2018 bear market. In 2022, the average drawdown was around 35.5%.Related: Bitcoin short-term cost basis approaches profitability, but $80K must flip to support firstBTC price may decline to the $48,000–$52,000 range if the fractal repeats, aligning with the bear flag downside target.This article is produced in accordance with Cointelegraph’s Editorial Policy and is intended for informational purposes only. It does not constitute investment advice or recommendations. All investments and trades carry risk; readers are encouraged to conduct independent research.

Čítaj viac

Bitcoin taps $81K as long-term holders add 330K BTC: How high can price go?

Bitcoin (BTC) rose as much as 2% over the past 24 hours to an intraday high of $81,300 on Tuesday. This brings the weekly and 30-day gains to 5% and 21%, respectively.This rally was accompanied by buying from long-term holders, who have added more than 330,000 BTC over the past month, according to data from CryptoQuant.Key takeaways:Long-term Bitcoin holders added 331,000 BTC over the past 30 days.Spot Bitcoin ETFs have seen a total of $1.18 billion in net inflows over the last three days.Bitcoin’s bull flag projects a BTC price rally to $94,800.Bitcoin long-term holders add $26.7 billion in BTCBitcoin long-term holders (LTHs) — entities holding coins for at least six months without selling — ramped up their holdings as BTC price hit new highs above $81,000. Related: Bitcoin short-term cost basis approaches profitability, but $80K must flip to support firstCryptoQuant data shows that on a rolling 30-day basis, the supply held by LTHs increased by a net 331,000 BTC, worth around $26.7 billion at current market prices as of Tuesday. This represents almost 1.6% of the total supply, suggesting increased accumulation as the price recovers.Bitcoin 30-day rolling LTH supply change. Source: CryptoQuantAlso accompanying Bitcoin’s bullishness are strong inflows into US-based spot Bitcoin exchange-traded funds (ETFs), which have recorded positive flows for three consecutive days totaling $1.18 billion. These investment products attracted $532 million in net inflows on Monday, suggesting increased institutional appetite for BTC.Spot Bitcoin ETF flows table. Source: Farside Investors “ETF flows are back in the markets, and the markets are turning upwards for Bitcoin,” MN Capital founder Michael van de Poppe said in an X post on Tuesday, adding:“I assume we’ll continue to see more strength coming in over the course of the next few weeks as there’s a lot of ETF demand happening.”As Cointelegraph reported, institutions are absorbing more than five times the daily mined BTC supply. How high can Bitcoin price go?The Bitcoin liquidation heatmap showed the price eating away liquidity around $80,000, with millions in bid orders still sitting between the spot price and $84,600.“Bitcoin is on a liquidity hunt,” Bitcoin analyst AlphaBTC said his latest post on X, adding:“Up to $84K is looking Juicy!”Bitcoin liquidation heatmap. Source: GlassnodeThe $84,000 area is on many traders’ radars because it coincides with the CME gap formed in early February. From a technical perspective, the price has validated a bull flag on the daily chart after breaking above the upper boundary at $77,500.A daily candlestick close above the 200-day exponential moving average at $$82,000 will confirm the continuation of the uptrend toward the measured target of the flag at $94,800. Such a move would bring the total gains to 18%.BTC/USD daily chart. Source: Cointelegraph/TradingViewCrypto investor Cryptocupra shared a chart suggesting that Bitcoin’s macro bottom could be in, following the bullish cross from the weekly MACD, paving the way for more upside.  BTC/USD weekly chart. Source: X/CryptocupraAs Cointelegraph reported, the BTC/USD pair may rise as high as $92,000 if the resistance at $84,000 is broken.This article is produced in accordance with Cointelegraph’s Editorial Policy and is intended for informational purposes only. It does not constitute investment advice or recommendations. All investments and trades carry risk; readers are encouraged to conduct independent research.

Čítaj viac

Bitcoin turns risk on as stocks hit new highs and miner profits rise: Is $85K BTC next?

Key takeaways:Improved Bitcoin mining profitability and massive ETF inflows have calmed investors’ fears that miner selling could cap BTC price.Bitcoin dominance hits its highest level since July 2025 as investor interest shifts away from struggling altcoin sectors.Bitcoin (BTC) surged to $80,000 for the first time in three months on Monday, triggering $270 million in liquidations across leveraged short (sell) futures contracts. This positive momentum for Bitcoin coincided with tech stocks jumping to an all-time high, signaling a broad risk-on environment. Currently, three key indicators point to further upside momentum for Bitcoin.Nasdaq 100 futures (left) vs Bitcoin/USD (right). Source: TradingViewBitcoin’s price action maintained a tight correlation with the tech-heavy Nasdaq 100 Index. Yet while the US stock market nears its highest-ever level, Bitcoin sits 36% below its $126,200 peak from October 2025.Bitcoin Hashprice Index by Luxor, USD. Source: HashrateIndexProfitability for Bitcoin miners has also improved. The expected daily return for 1 pentahash/second has climbed to $37, a high not seen since Jan. 30. This shift is crucial because the total hashrate has dropped 13% over the last quarter. Major publicly listed mining firms have recently liquidated their Bitcoin treasuries to reduce debt and support AI data center investments.Bitcoin miners, ETF flows and options demand back BTC’s momentumFor a time, traders feared that a decline in network hash power would spark additional sell pressure. Data from BGometrics shows miner reserves hitting 10-year lows and on Thursday, Riot Platforms (RIOT US) confirmed that it sold $250 million in Bitcoin last quarter. Fortunately, the recent jump in mining profitability is beginning to alleviate these structural concerns.Bitcoin market share, excluding stablecoins. Source: TradingView / CointelegraphBitcoin’s market share, excluding stablecoins, has jumped to its highest level since July 2025. This move reflects a declining demand for memecoins, governance tokens, and blockchain applications in general. Reduced interest in decentralized exchanges and numerous hacks within finance applications have also contributed to the negative sentiment surrounding altcoins.Combined assets under management for Bitcoin and Ether (ETH) exchange-traded products reached $147 billion, according to a CoinShares report from April 27. In comparison, similar products for Solana and XRP have failed to break above $3 billion each. Investors’ expectations for institutional demand for major altcoins proved too high, as BTC and ETH now account for 95% of that market.Related: Bitcoin short-term cost basis approaches profitability, but $80K must flip to support firstDeribit Bitcoin options premium put-to-call, USD. Source: LaevitasDemand for call (buy) option premiums exceeded that for equivalent put (sell) options on Monday by 24%. This data represents a major turnaround from levels seen during the weekend, when premiums paid for call options were 25% lower than those for put options. While it seems premature to conclude that traders are flipping bullish, the fear of an imminent price decline is no longer present.Friday’s strong $630 million net inflows into US-listed spot exchange-traded funds (ETFs) likely contributed to the improved sentiment. Regardless of the high correlation with tech stocks, Bitcoin’s path to $85,000 remains valid given the increased mining profitability, dominance versus altcoins and Bitcoin options data.This article is produced in accordance with Cointelegraph’s Editorial Policy and is intended for informational purposes only. It does not constitute investment advice or recommendations. All investments and trades carry risk; readers are encouraged to conduct independent research.

Čítaj viac

Bitcoin short-term cost basis approaches profitability, but $80K must flip to support first

Bitcoin (BTC) reached a new three-month high of $80,500 on Monday, testing the level for the first time since Jan. 31. The rally above $80,000 puts the price just below short-term holders’ cost basis of $81,486, the next dynamic resistance level. For the rally to continue, a daily close above this level is key to securing $80,000 as support. A rally to $81,500 may lock in the trendBitcoin’s rally to $80,000 places the price directly under the short-term holder’s realized price of $81,486. This metric reflects the average cost of coins moved over the last 155 days and indicates where recent buyers have flipped from loss to profit.A daily close above $81,500 would return these holders to profit and reduce sell-side pressure. According to crypto analyst Crazyyblockk, the short-term holder losses have narrowed to about -2.17%, showing that the overhead supply band is thinning. The long-term holders (LTHs) hold near +27% profit and are not distributing aggressively.Bitcoin LTH/STH SOPR ratio. Source: CryptoQuantThe spent-output profit ratio (SOPR), which tracks whether coins are spent at a profit or a loss, has climbed to 1.097 from 0.99. This indicates the coins are being spent in profit again, led by long-term holders. The exchange inflow data aligns with that shift. Around 97.2% of recent deposits came from short-term holders, with wallets holding 1 to 1,000 BTC contributing roughly 58%.BTC inflows peaked at 35,649 BTC on April 24 and dropped to 3,895 BTC by May 3. That compression reduces immediate sell pressure and supports the case for holding at $80,000 once the cost basis flips.Related: Bitcoin in ‘disbelief rally’ as traders spot $84K BTC price targetBTC exchange supply builds below $80,000BTC exchange flow data tracked by Bitcoin researcher Axel Adler Jr shows 8,512 BTC in net inflows over recent days, with spikes on April 27 and April 30. The price absorbed that supply without a sharp downside, signaling an active BTC demand.Bitcoin exchange netflows for all exchanges. Source: CryptoQuantThe BTC flows have since cooled to near-neutral at 269 BTC between May 1 and May 3. The short-term averages stay positive, while the longer-term averages sit near zero, keeping the move contained to a short impulse.BTC exchange reserves increased by 5,773 BTC week over week to 2,685,541 BTC, before easing slightly after April 30. Adler Jr explained that the coins are currently sitting on exchanges without aggressive selling, forming a supply overhang that could turn into pressure if demand slows.Meanwhile, crypto trader Ardi highlighted that BTC is retesting breakout liquidity near $79,600. The trader said that holding this level keeps the move intact toward the next supply zone near $84,000. BTC/USDT analysis by Ardi. Source: XA breakdown below $80,000 shifts focus to the new-money cost basis near $76,500 and increases the likelihood of a failed breakout setup.Related: BTC price can ‘easily’ hit $95K: Five things to know in Bitcoin this weekThis article is produced in accordance with Cointelegraph’s Editorial Policy and is intended for informational purposes only. It does not constitute investment advice or recommendations. All investments and trades carry risk; readers are encouraged to conduct independent research.

Čítaj viac
Načítava

Získaj BONUS 8 € v Bitcoinoch

nakup bitcoin z karty

Registrácia Binance

Burza Binance

Aktuálne kurzy