Price predictions 5/4: SPX, DXY, BTC, ETH, XRP, BNB, SOL, DOGE, HYPE, ADA
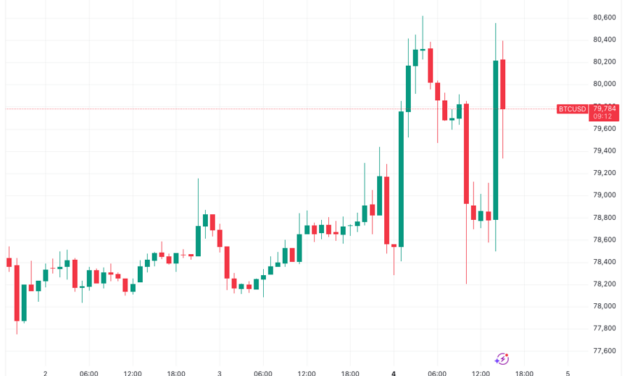
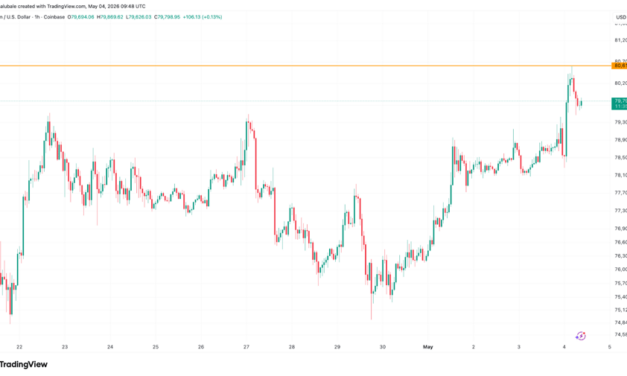
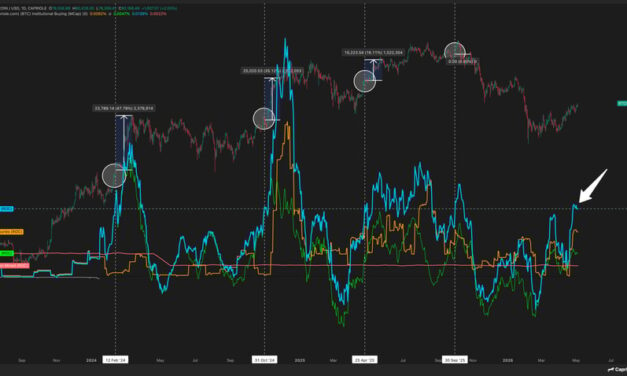
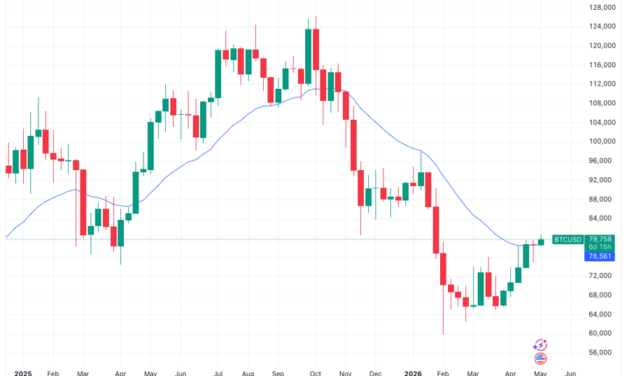
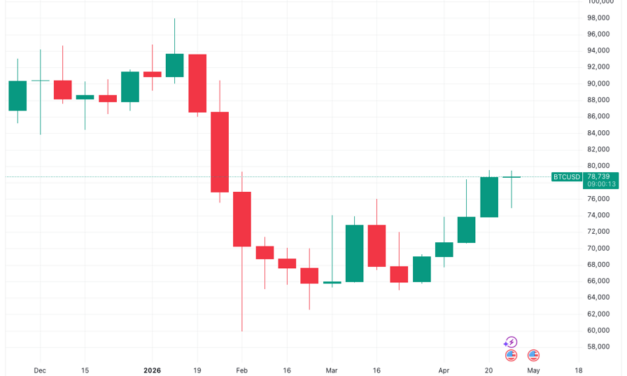
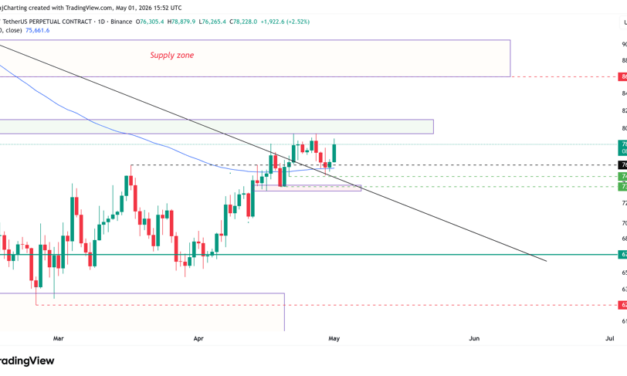
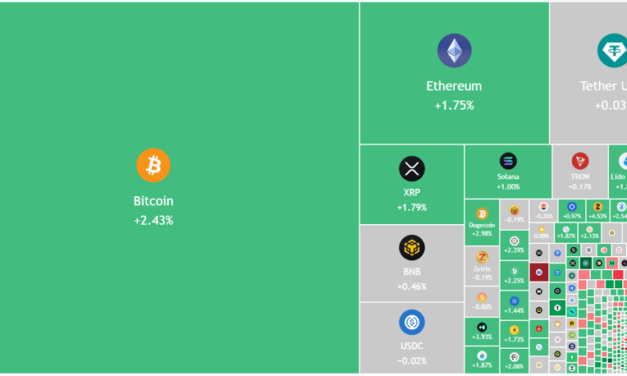
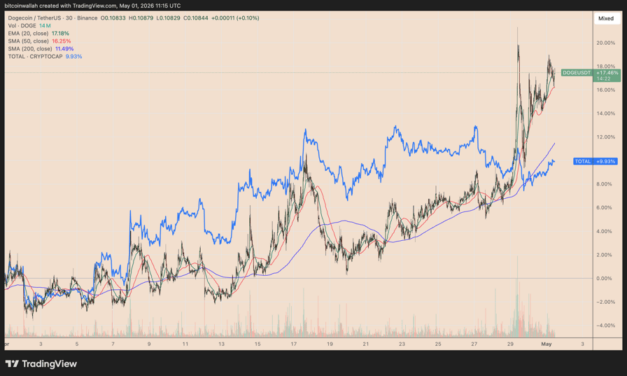
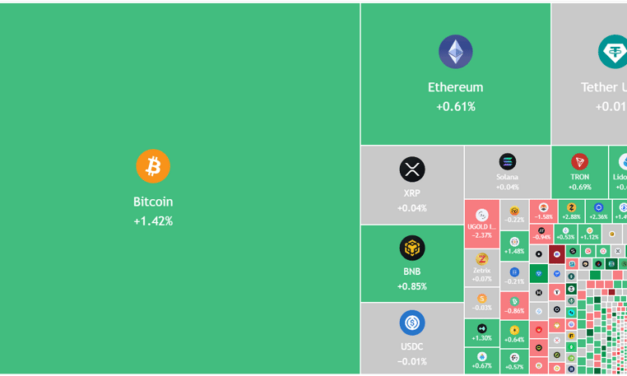
Key points:Bitcoin’s rally through $79,500 opens the door to a move toward $84,000.Ether, Dogecoin and Hyperliquid are showing strength, but the other major altcoins are yet to pick up momentum.Bitcoin (BTC) opened the new week with a rally above $80,500, suggesting the bulls are attempting to take charge. Analysts are closely watching the $80,000 level, as some believe a failure to close above it could trigger a move toward $60,000. However, crypto analyst Matthew Hyland said in a post on X that traders calling BTC’s fall to $60,000 and lower ‘will be the ones flipping bullish late above $90K.” BTC’s 30-day liquidation map shows that a rally above $84,000 would trigger $2.85 billion worth of short liquidations across all exchanges.Crypto market data daily view. Source: TradingViewA positive sign for the bulls is that BTC’s rise continues to be supported by institutional investors. Capriole Investments founder Charles Edwards said in a post on X that institutions have been “slurping up 500%+ of Bitcoin’s daily mined supply.” Such instances in the past have boosted prices by more than 24% in the following month. If history repeats, BTC may surge to around $96,000.Could BTC and the major altcoins sustain the breakout? Let’s analyze the charts of the top 10 cryptocurrencies to find out. S&P 500 Index price predictionThe S&P 500 Index (SPX) remains in a strong uptrend, rising to a new all-time high of 7,272 on Friday.SPX daily chart. Source: Cointelegraph/TradingViewThe upsloping 20-day exponential moving average (7,043) indicates an advantage to buyers, but the relative strength index (RSI) near the overbought zone signals that a minor consolidation or correction is possible in the near term.The 7,000 level is the crucial support to watch out for on the downside. A solid bounce off the 7,000 level suggests that the bulls have flipped it into support. That improves the prospects of a rally to 7,500. On the contrary, a close below the 7,000 support may sink the index to the 50-day simple moving average (6,827).US Dollar Index price predictionThe US Dollar Index (DXY) has been stuck between the 50-day SMA (98.97) and the 97.74 support.DXY daily chart. Source: Cointelegraph/TradingViewThe downsloping 20-day EMA (98.61) and the RSI in the negative territory indicate that the bears are at a slight advantage. If the price breaks below the 97.74 support, the index may tumble toward the 96.21 level.Conversely, a close above the 50-day SMA suggests that the bulls are on a comeback. The index may rally to the 100.54 resistance level, where buyers are expected to encounter solid selling pressure from bears.Bitcoin price predictionBTC has broken above the $79,500 resistance, signaling the resumption of the uptrend toward $84,000.BTC/USDT daily chart. Source: Cointelegraph/TradingViewThe uptrend is expected to face solid selling pressure at $84,000, but if the bulls prevent the BTC price from dipping below the 20-day EMA ($76,634), the possibility of a breakout increases. If the $84,000 level is broken, the BTC/USDT pair may surge toward the pattern target of $92,000.Time is running out for the bears. They will have to swiftly yank the price below $76,000 to weaken bullish momentum. The pair may then tumble to the 50-day SMA ($72,798).Ether price predictionEther (ETH) rose above the 20-day EMA ($2,298) on Friday and is marching toward the $2,465 overhead resistance.ETH/USDT daily chart. Source: Cointelegraph/TradingViewSellers will attempt to stall the rally at the $2,465 level, but if the bulls prevail, the ETH/USDT pair may jump to the resistance line. If the ETH price turns down sharply from the resistance line and breaks below the 20-day EMA, it suggests the pair may remain within the channel for some time.On the other hand, a break and close above the resistance line signals that the bulls are back in control. The pair may then surge toward the $3,050 level.XRP price predictionBuyers have pushed XRP (XRP) above the moving averages, opening the door to a rally toward the downtrend line.XRP/USDT daily chart. Source: Cointelegraph/TradingViewThe flattish moving averages and the RSI just above the midpoint do not give either bulls or bears a clear advantage. Buyers will gain the upper hand on a close above the $1.61 level. The XRP/USDT pair may then rally to $2, then to $2.40.Contrary to this assumption, if the XRP price turns down from the $1.61 level, it would suggest that bears are active at higher levels. That may extend the pair’s stay inside the $1.27 to $1.61 range for a while.BNB price predictionBNB (BNB) has been trading near its moving averages over the past few days, indicating indecision between bulls and bears.BNB/USDT daily chart. Source: Cointelegraph/TradingViewThe flattish moving averages and the RSI just above the midpoint suggest that the BNB/USDT pair may remain inside the $570 to $687 range for a few more days.The next trending move is expected to begin on a close above $687 or below $570. If bulls push the BNB price above the $687 resistance, the pair is expected to gain momentum and surge to $790. Alternatively, a close below $570 signals the resumption of the downtrend toward $500.Solana price predictionSolana (SOL) is attempting to rise above the moving averages, indicating demand at lower levels.SOL/USDT daily chart. Source: Cointelegraph/TradingViewA close above the moving averages may push the SOL price to the $90.73 resistance. Sellers will attempt to defend the $90.73 level, but if the bulls prevail, the SOL/USDT pair may surge to $98. On the downside, the bears will need to push the price below $82.65 to gain the upper hand. If they do that, the pair may descend to the solid support at $76. The next trending move is expected to begin on a close above $98 or below $76.Related: BTC price can ‘easily’ hit $95K: Five things to know in Bitcoin this weekDogecoin price predictionDogecoin (DOGE) has broken above the $0.11 resistance level, clearing the path for a rally toward $0.12.DOGE/USDT daily chart. Source: Cointelegraph/TradingViewThe 20-day EMA ($0.10) has started to turn up, and the RSI is in the overbought zone, indicating that the buyers have the edge. Sellers are expected to mount a strong defense at the $0.12 level, but if buyers bulldoze through, the rally may reach $0.14 and eventually $0.16.Instead, if the DOGE price turns down sharply from $0.12 and breaks below the moving averages, it suggests that the bears remain sellers on rallies. That may keep the DOGE/USDT pair within the $0.09-$0.12 range for a few more days.Hyperliquid price predictionHyperliquid (HYPE) is maintaining above the 20-day EMA ($41.04), but the long wick on the candlestick shows selling at higher levels.HYPE/USDT daily chart. Source: Cointelegraph/TradingViewThe uptrend is expected to face selling pressure in the $43.76 to $45.77 resistance zone. If the HYPE price turns down from the current level or the overhead zone and breaks below the 50-day SMA ($40.11), the advantage will tilt toward the bears. The HYPE/USDT pair may then tumble to $38.70.Contrarily, a break and close above the overhead zone signals the resumption of the uptrend. The pair may surge to $50 and then to $51.43.Cardano price predictionCardano (ADA) has risen above the downtrend line, but the bulls are facing stiff resistance at the 50-day SMA ($0.25).ADA/USDT daily chart. Source: Cointelegraph/TradingViewThe RSI has risen just above the midpoint, signaling a slight advantage to the bulls. If buyers push the price above the 50-day SMA, the ADA/USDT pair may rally to $0.29, then to $0.31. Sellers are again expected to pose a strong challenge at the $0.31 level, as a close above it suggests that the pair may have bottomed out in the short term.The $0.22 level is the critical support to watch out for on the downside. If the ADA price turns down and breaks below the $0.22 support level, it signals a resumption of the downtrend.
Čítaj viac