Značka: Markets

Bitcoin bounces around $80K as Iran strike unsettles crypto, risk assets

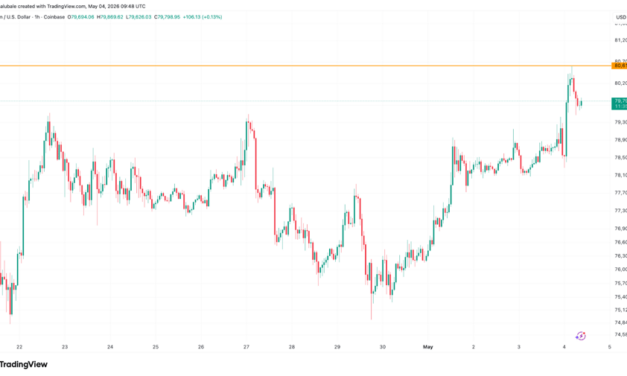
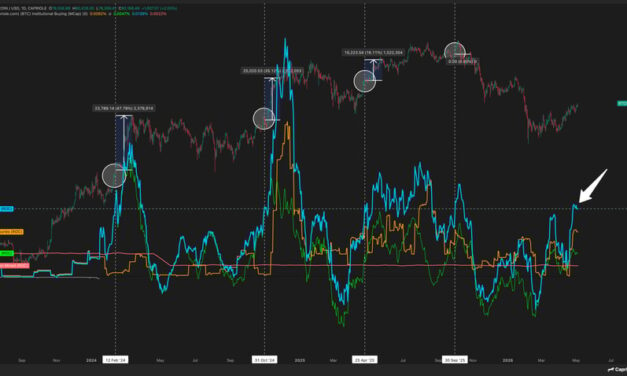
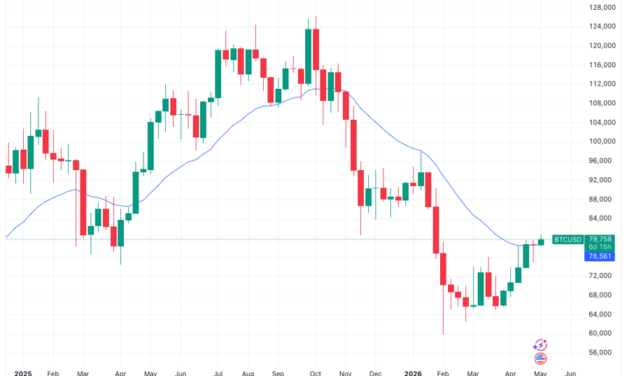
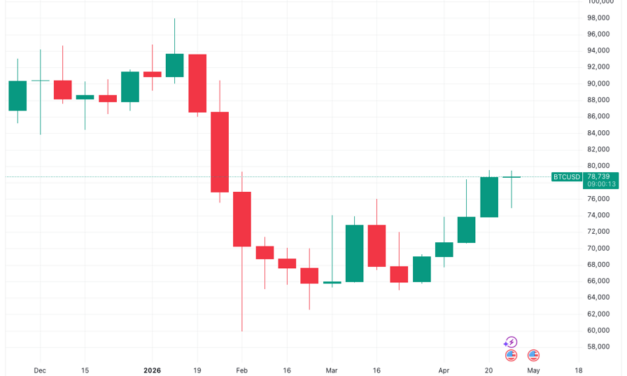
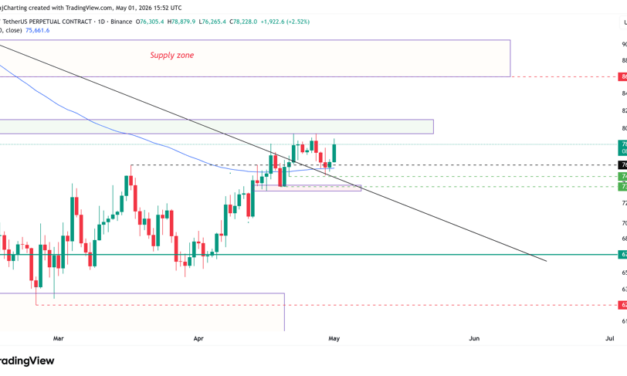
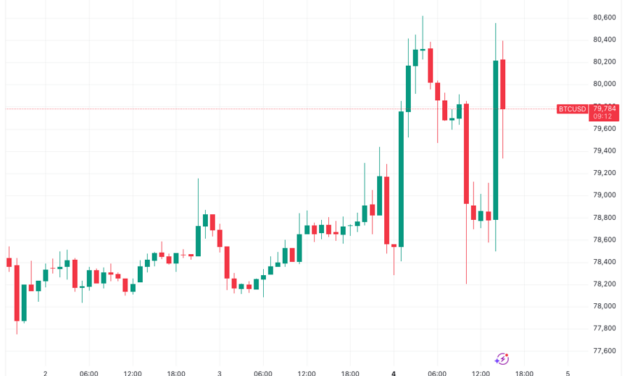
Bitcoin (BTC) saw volatility at Monday’s Wall Street open as fresh US-Iran war events sparked instability.Key points:Bitcoin wobbles around the $80,000 mark as Iran tensions steer risk-asset markets.The overhead CME futures gap becomes the new target for traders wanting proof of BTC price strength.Short-term holders approach breakeven on their unrealized losses.Iran injects fresh BTC price volatility with $80,000 at stakeData from TradingView showed whipsaw BTC price action as $80,000 became a central focus for both bulls and bears.BTC/USD one-hour chart. Source: Cointelegraph/TradingViewNews that Iran had struck a petroleum facility in the United Arab Emirates sent oil prices surging on the day, with US stocks under pressure.WTI crude added over 5% to return past $105 per barrel, while Brent hit $119 per barrel — within striking distance of its highest levels in nearly three years.CFDs on Brent crude oil one-day chart. Source: Cointelegraph/TradingViewEarlier, trading company QCP Capital described the Iran situation as “fluid.”“For now, markets appear to be pricing in de-escalation. That calculus could change quickly,” it wrote in its latest Market Color analysis.For Bitcoin itself, QCP argued that the semi-filled gap in CME Group’s futures market formed the key resistance hurdle for buyers to overcome.“Opened up with a new small CME gap. It is also well on its way to close the previous large gap from $84K,” trader Daan Crypto Trades continued on the topic in a post on X. “Good to mark these levels on your chart as they could act as a ‘magnet’ and local reversal zones if price trades close/into them.”CME Bitcoin futures 15-minute chart. Source: Daan Crypto Trades/XBitcoin speculators almost wipe out unrealized lossesOnchain analytics platform CryptoQuant added another important level in the form of the aggregate cost basis of Bitcoin’s short-term holders, or speculative investors holding for up to six months.Related: BTC price can ‘easily’ hit $95K: Five things to know in Bitcoin this week“The more probable scenario is a cautious recovery attempt toward STH realized price,” contributor Crazzyblockk wrote in a QuickTake blog post. “A confirmed daily close above $81,500 flips that level from resistance to support, opening the path toward $87–92K. Failure sends price back to test new money realized price near $76,500.”Bitcoin aggregate cost basis (realized price) by UTXO age (screenshot). Source: CryptoQuantCrazzyblockk added that Bitcoin’s long-term holders were “unbothered” about their average 27% unrealized losses.This article is produced in accordance with Cointelegraph’s Editorial Policy and is intended for informational purposes only. It does not constitute investment advice or recommendations. All investments and trades carry risk; readers are encouraged to conduct independent research.

Čítaj viac

Ethereum holders are back in profit as ETH price chart targets $3K

Ether’s (ETH) surge to $2,390 on Monday pushed its value above its realized price, implying that the average holder of ETH is now back in profit. But is this enough for the ETH bulls to reach $3,000?Key takeaways:Ether holders are back in profit, increasing chances for more upside.Ether’s bull flag chart pattern is targeting $3,000.A big potential sell wall exists around $2,800, with 7.1 million ETH on the line.Ether price rises above its cost basisData from TradingView shows that Ether’s price rose 21% to $2,340 on Monday from its local low of $1,940 reached on March 29.This rally has seen ETH rise above its realized price, or the average cost basis of all moved ETH, currently at $2,320, according to data from Glassnode.Related: Ethereum Foundation sells another 10,000 ETH to BitMine in third OTC dealThe average ETH holder returning to profit after unrealized losses provides meaningful financial relief for many holders, and perhaps a bullish outlook.Historically, breaking above this level shifts market sentiment from fear to greed, reducing sell pressure from underwater holders. This often fuels bullish momentum, attracting new buyers and short squeezes.The chart below shows that when the price reclaimed its realized price in May 2025 after trading below it for roughly two months, it went on to rally 173% to its $4,950 all-time high from $1,800. The gains were 58% after ETH/USD reclaimed its cost basis in early 2023. Ethereum: Key pricing levels. Source: GlassnodeTherefore, holding above $2,300 is crucial for the bulls and for a potential retest at $3,000.Analyst Dami-Defi said that a break above the $2,400-$2,600 would trigger the “most violent move of the year” toward $3,000.“Once we break $2,400 we will catapult violently to $2,800 – $3,000.”ETH/USD weekly chart. Source: X/Dami-DefiAs Cointelegraph reported, the ETH/USD pair must overcome resistance at $2,400 to confirm a trend change.ETH price technical analysis: Bull flag targets $3,000Ether’s price action has formed a bull flag chart pattern on the daily chart (see below). The price is retesting the $2,350 resistance, where the flag’s upper boundary and the 100-day exponential moving average (EMA) converge. A daily candlestick close above this level would open the way toward the measured target at $3,018, roughly 30% above the current price. ETH/USD 12-hour chart. Source: TradingViewThe daily relative strength index has increased to 56 from near oversold conditions at 36 in late March, suggesting that ETH bulls are returning to the market.Trader and analyst Cohelson David said a broadening wedge pattern on the 12-hour chart projects an ETH price breakout toward $3,000.ETH/USD 12-hour chart. Source: X/Cohelson DavidHowever, Ether’s cost basis distribution data shows that investors hold about 7.1 million ETH at an average cost of between $2,750 and $2,850, creating a potential resistance zone.This concentration suggests that many investors may sell at breakeven, potentially stalling Ether’s upward move.Ethereum cost basis distribution chart. Source: GlassnodeThis article is produced in accordance with Cointelegraph’s Editorial Policy and is intended for informational purposes only. It does not constitute investment advice or recommendations. All investments and trades carry risk; readers are encouraged to conduct independent research.

Čítaj viac

Bitcoin in ‘disbelief rally’ as traders spot $84K BTC price target

Market analysts said Bitcoin (BTC) is “primed for upward momentum” after rallying past $80,000 during the early Asian trading hours on Monday. Key takeaways:Bitcoin price rises to a 13-week high of $80,610 on Monday amid $462 million in crypto liquidations.The CME gap at $84,000 could act as a “magnet” for BTC price.Bitcoin leads market in fresh May rallyData from TradingView showed 1.6% daily BTC price gains, with BTC/USD rising as high as $80,610 for the first time since Jan. 31.BTC/USD one-hour chart. Source: Cointelegraph/TradingViewEther (ETH), the largest altcoin by market capitalization, was trading at $2,367 at the time of writing, up 2% over the last 24 hours. Fourth-place XRP (XRP) has gained nearly 2% over the last day to trade just above $1.41. Dogecoin (DOGE) climbed the most among the top 10 cryptocurrencies, up 3.5% over the same period.Related: BTC price can ‘easily’ hit $95K: Five things to know in Bitcoin this weekAs a result, the global crypto market capitalization is up 1.6% over the last day toward $2.65 trillion on Monday.Performance of top-cap cryptocurrencies: Source: CoinMarketCap“Bitcoin looks primed for upwards momentum,” MN Capital founder Michael van de Poppe said in an X post on Monday. The analyst added that a “breakout above $79K opens the opportunities” toward the $86,000-88,000 resistance zone and later to $90,000.BTC/USD daily chart. Source: X/Michael van de Poppe“It’s a disbelief rally” for Bitcoin, crypto analyst Matthew Hyland said in response to Bitcoin’s latest push above $80,000, adding:“The many calling for $60K and below will be the ones flipping bullish late above $90K.”Bitcoin’s rally is accompanied by significant short liquidations across the crypto market totaling $452 million over the last 24 hours, signaling intense buying by traders.Meanwhile, Bitcoin taker buy volume saw “two consecutive large hourly buy-volume spikes on Binance of approximately $1.19 billion and $792 million,” CryptoQuant analyst Amr Taha said in a Quicktake note on Monday, adding:“When this type of volume appears near a major breakout level, it often shows that traders are not waiting for a pullback; instead, they are chasing confirmation as the price moves higher.”Bitcoin taker buy volume on Binance. Source: CryptoQuantBTC bulls target $84,000 nextAs Cointelegraph reported, Bitcoin bulls were required to push above $80,000 to sustain the upward momentum.Bitcoin’s 5.5% rally over the last five days saw the BTC/USD pair reclaim key support levels, including the true market mean at $77,500 and the short-term holder cost basis around $78,000. Traders now shifted their focus to the CME gap at $84,000, formed in early February.BTC/USD four-hour chart. Source: X/AlphaBTCBitcoin is on “its way to close the previous large gap from $84K,” trader Daan Crypto Trades said in a Monday post on X, adding“Good to mark these levels on your chart as they could act as ‘magnets’ and local reversal zones if price trades close/into them.”Meanwhile, Bitcoin’s 30-day liquidation map reveals that a break above $84,000 would trigger over $2.85 billion worth of leveraged short liquidations across all exchanges.Bitcoin exchange liquidation map. Source: CoinGlassThis article is produced in accordance with Cointelegraph’s Editorial Policy and is intended for informational purposes only. It does not constitute investment advice or recommendations. All investments and trades carry risk; readers are encouraged to conduct independent research.

Čítaj viac

Bitcoin price eyes $96K as institutions absorb 500% of daily BTC supply

Bitcoin (BTC) may rally toward $96,000 by June as institutions absorb more than five times the daily mined BTC supply, according to Capriole Investments founder Charles Edwards.BTC price averages 24% gains after institutional supply squeezeIn a Monday post, Edwards said institutions have been “slurping up 500%+ of Bitcoin’s daily mined supply.”BTC/USD daily chart vs. institutional buying market cap. Source: Capriole Investments Since the April 2024 halving, Bitcoin miners have produced roughly 450 BTC per day, keeping supply growth relatively stable, with its rate of change (ROC, the red line) hovering near 0.0022% as of Monday. In contrast, institutional buying’s ROC (blue) stood near 0.0139%, showing demand momentum rising more than five times faster than new supply growth. Renewed ETF inflows and steady BTC purchases by Michael Saylor’s Strategy have helped drive that demand. They added roughly 70,000 BTC in April, more than approximately 13,500 BTC mined during the same period.US Spot Bitcoin ETF monthly net flows and Strategy’s BTC holding. Source: Glassnode, BitBo.IO”Every time it’s been this high before, price has shot up over the next week,” said Edwards, adding: “The average return in prior cases is +24% over the next 1 month from here, that would take us to around $96K.”Edwards noted that when institutional absorption exceeds 500% of Bitcoin’s daily mined supply, BTC has historically delivered ~24% average gains over the following month, which would put the price around $96,000 by June.Similar targets have also been shared by analyst Michaël van de Poppe, who said Bitcoin may “easily” reach $95,000, citing renewed demand for spot BTC ETFs and other technical factors.Bitcoin sharks accumulate over 61,000 BTC in 30 daysOnchain data shows the supply squeeze extends beyond ETFs and corporate buyers. Bitcoin “sharks,” entities that hold 100–1,000 BTC, have accumulated over 61,000 BTC in the past 30 days, according to data resource Glassnode. BTC shark net position change vs. price. Source: GlassnodeSmaller cohorts, including “fishes” holding 10–100 BTC and “crabs” holding 1–10 BTC, are also net accumulators during the same period.BTC fish and crab net position change vs. price. Source: GlassnodeThe data shows that both mid-sized investors and retail participants are steadily absorbing supply, raising BTC’s odds of hitting $96,000 over the next few weeks if the demand persists. Related: Strategy takes Bitcoin buying breather ahead of Q1 earnings reportStill, some analysts warrant caution, citing a prevailing bear flag setup. In a Monday post, trader Bitbull highlighted $60,000–$62,000 as a potential downside target if BTC corrects from the flag’s upper trendline toward the lower trendline. BTC/USD daily chart. Source: TradingView/BitBullA breakdown below the lower trendline may send the BTC price under $50,000.This article is produced in accordance with Cointelegraph’s Editorial Policy and is intended for informational purposes only. It does not constitute investment advice or recommendations. All investments and trades carry risk; readers are encouraged to conduct independent research.

Čítaj viac

BTC price can 'easily' hit $95K: Five things to know in Bitcoin this week

Bitcoin (BTC) starts a new week in fighting form as $80,000 returns after a three-month absence.Bitcoin finally taps the $80,000 mark for the first time since late January, as a trader brings $88,000 and higher back into focus.The Bitcoin bear flag construction is in the spotlight, while some still see a new macro breakdown coming.Dissent at the Federal Reserve contrasts with record highs for the S&P 500, but analysis warns that stocks are not safe.Oil is done and the overall supply overhang will drive a comedown, new research says in a potential risk-asset tailwind.Bitcoin’s MVRV ratio metric is now at its highest levels since late January.BTC price can hit $88,000 and higher next: TraderIt started with a breakthrough a key 21-week trend line last week, and now, Bitcoin is back at $80,000 for the first time in three months.Data from TradingView shows new local highs of $80,617 on Bitstamp.The weekly close did not disappoint, becoming Bitcoin’s highest since late January and only its second above the 21-week trend line since October 2025.BTC/USD one-week chart with 21EMA. Source: Cointelegraph/TradingViewCorrespondingly, market participants are daring to forecast even higher levels next. For crypto trader and analyst Michaël van de Poppe, $88,000 is just the start.“Bitcoin looks primed for upwards momentum,” he wrote in one of his latest posts on X. “Very keen to see how the markets will react when the US opens, especially given the positive ETF flows of last Friday. Breakout above $79K opens the opportunities all the way towards $86-88K for coming period.”BTC/USDT one-day chart. Source: Michaël van de Poppe/XVan de Poppe referred to Friday’s $630 million net inflows for US spot Bitcoin exchange-traded funds (ETFs).As a result of February’s drop to the $60,000 zone, which he described as “one of the strongest corrections in its existence,” Van de Poppe suggested that a reset of onchain indicators had now locked in.“That means: we can easily run to $92-95K without any breakdown of the bear market trend, and we can easily start a bull market from here,” another post stated on Sunday.Traders split over Bitcoin’s bear flagBitcoin pushing to $80,000 has implications for a multi-month bearish structure on the daily BTC/USD chart. This bear flag, Bitcoin’s second of 2026, is now tantalizingly close to being left behind.At the same time, a failure to break higher leaves price vulnerable to a comedown — possibly to new macro lows.“If it does lose this structure, a deeper move down in that 30–40% range wouldn’t be surprising and the whole market probably feels it,” trader and investor Crypto Storm wrote in a post on X. “Only real shift in this view is a clean daily close back above 80K, that would flip things bullish again.”BTC/USDT one-day chart. Source: CryptoStorm/XTrader BitBull is among those seeing failure as the likely outcome, telling X followers that they would soon begin building short positions with a $60,000 target.“$BTC bear flag is very close to completion,” they summarized.BTC/USDT one-day chart. Source: BitBull/XConsensus, however, is far from unanimous about where BTC/USD will go next. For trader Jeff Sun, the signals are clear that Bitcoin bulls have already won out.“Spot has now reclaimed $80,000 for the first time since January 31, 2026. This is a position I have been building via ETF since early March,” he reported on Monday.Sun described the structure as “not a bear flag” based on the latest three-month price highs.BTC/USD one-day chart. Source: Jeff Sun/XLike Sun, late last month, Jurrien Timmer, director of global macro at Fidelity Investments, pointed to Bitcoin’s rebound from the $60,000 area in early February. “The rally off the $60,033 low could still be described as a bear flag (not unlike the bear market rally last fall), but my sense is that Bitcoin continues to build a large base here in preparation for the next major up wave,” he told X followers at the time.Fed rate cuts “over for now” as officials sparAs the US-Iran war grinds on for a third month, its impact on inflation is increasingly on officials’ minds.The Federal Reserve’s latest interest-rate meeting underscored the Iran tensions, along with near three-year highs in its “preferred” inflation gauge.Consensus over policy was noticeably under strain, and dissent from four members of the Federal Open Market Committee (FOMC) made for the most conflicted meeting statement since the early 1990s.“The primary reason for dissent was against language in the meeting statement indicating an easing bias,” trading resource Mosaic Asset Company commented on the topic in the latest edition of its regular newsletter, The Market Mosaic. “Leading indicators of the fed funds rate indicates that the Fed’s easing cycle is over for now.”Fed target rate probabilities (screenshot). Source: CME GroupAs multiple senior Fed figures take to the stage this week and Chair Jerome Powell is replaced by Kevin Warsh on May 15, data from CME Group’s FedWatch Tool shows that easing is the last thing that markets now expect this year.Risk assets traditionally struggle when policy is at risk of tightening. So far, however, stocks have shaken off any cold feet, with the S&P 500 hitting new record highs last week.Continuing, Mosaic said that those highs were driven by a “sharp jump in corporate earnings.”“If inflation does start accelerating further in the months ahead, that could add significant pressure to stock valuations,” it warned. “High inflation tends to lead to high interest rates, which makes the present value of future corporate profits worth less in present value terms.”S&P 500 one-day chart. Source: Cointelegraph/TradingViewOil gains “fully priced in” despite Iran warIn analytics circles, there is growing conviction over the fate of global oil prices.In his latest Commodity Report on Monday, analyst Lukas Kuemmerle said that despite the ongoing supply squeeze, the overall trend still points to supply outweighing demand. “Brent crude is currently trading around $112 per barrel, up from $61 at the start of the year. The price has tested the March and April highs three times in the past month — and each time it has been rejected,” he noted. “This is classic technical behaviour for a market where the bullish story is fully priced in.”Crude oil futures one-day chart. Source: Lukas KuemmerleKuemmerle said that markets have not forgotten the “supply growth” narrative for 2026, and that an oil-price comedown is all the more likely because of it.“Even Goldman Sachs, the most war-bullish of the major banks, sees Brent averaging $85 with the Hormuz disruption fully priced in,” he continued.Brent spot passed $120 per barrel for the first time since 2022 last week, subsequently cooling before returning to $115 to start the week.Spot Brent crude oil one-week chart. Source: Cointelegraph/TradingViewKuemmerle, meanwhile, adds that “hedge funds that wanted to be long the Iran story are already long.” “The flow has turned,” he concluded, saying that smart money “has already repositioned for the reversal.”Bitcoin MVRV ratio shows ongoing recoveryA key Bitcoin onchain metric is increasingly supporting the bull case this month.Related: Crypto industry will be ‘just fine’ if CLARITY Act doesn’t pass: Chris PerkinsData from onchain analytics platform CryptoQuant this week flags multimonth highs in Bitcoin’s market value to realized value (MVRV) ratio tool.MVRV ratio compares Bitcoin’s market cap to the price at which the supply last moved, also known as its “realized cap.”Values below 1 suggest oversold conditions, with the metric dipping to lows near 1.1 during Bitcoin’s trip to $60,000.“The Bitcoin MVRV Ratio is currently reading around 1.45, a significant level as it represents one of its highest readings since the beginning of 2026,” CryptoQuant contributor Arab Chain now notes. “This signal reflects a clear improvement in Bitcoin’s market valuation relative to its realized value, suggesting that the market has begun to regain an important portion of its momentum following a period of decline and rebalancing during the first months of the year.”Bitcoin MVRV ratio. Source: CryptoQuantArab Chain describes MVRV as showing a “gradual improvement in investor profitability.”“If the indicator continues to climb in the coming period, it could point to the market entering a stronger and more mature phase within the broader upward trend,” it adds.

Čítaj viac

Bitcoin preps highest weekly close since January as BTC price nears $79K

Bitcoin (BTC) eyed $79,000 into Sunday’s weekly close as crypto markets continued to be guided by the US-Iran war.Key points:Bitcoin circles a key weekly level into the weekly close, with the highest close in several months on the table.Analysis sees the mid-$80,000 zone and higher coming back into play.Liquidity grabs form the basis for caution among some traders.BTC price nears highest weekly close in over three monthsData from TradingView showed BTC/USD attempting to hold higher after cancelling out losses from earlier in the week.Finishing the week above $78,670 would deliver the pair’s highest weekly close since late January.BTC/USD one-week chart. Source: Cointelegraph/TradingViewFriday delivered a boost to risk assets as hopes of a fresh peace agreement between the US and Iran accelerated. On Sunday, however, US President Donald Trump appeared skeptical of ratifying Iran’s latest peace proposals.In a post on Truth Social, Trump wrote that he “can’t imagine that it would be acceptable.”Source: Truth SocialDespite this, some crypto market commentators remained optimistic about the short-term outlook.“Strong consolidation on $BTC , and Friday gave us a slight insight in what’s likely to come,” trader and analyst Michaël van de Poppe wrote on X.Van de Poppe referenced Friday’s strong inflows to the US spot Bitcoin exchange-traded funds (ETFs), which totaled nearly $630 million.“I don’t think this will slow down in the coming week and that’s probably why we’re seeing a relatively shallow consolidation taking place,” he continued. “The $79K area is a crucial zone. That needs to break. If this breaks, I’m assuming we’ll see more upwards momentum and I’ve got $86-88K as first resistance area and $92-94K as the crucial one.”BTC/USDT one-day chart. Source: Michaël van de Poppe/XBitcoin traders warn of liquidity gamesCaution was also visible, with traders watching for liquidity grabs to the upside before a subsequent price reversal.Related: Here’s what happened in crypto today“Starting to see a build of liquidity form below, but a take of the high liquidity and using that to dump,” Crypto Tony commented on data from CoinGlass on the day.BTC liquidation heatmap. Source: CoinGlassTrading account JDK Analysis described the liquidity setup as “typically bearish.”“We can clearly see fresh longs opening into the highs, while price continues to show signs of absorption – unable to push meaningfully higher despite increasingly aggressive market buying for now,” it summarized in posts on X.BTC/USDT 15-minute chart. Source: JDK Analysis/XThis article is produced in accordance with Cointelegraph’s Editorial Policy and is intended for informational purposes only. It does not constitute investment advice or recommendations. All investments and trades carry risk; readers are encouraged to conduct independent research.

Čítaj viac

Bitcoin rally extends, yet BTC options price only 25% chance of $84K in May

Key takeaways:Bitcoin options markets price in low odds of BTC reaching $84,000 in May, while the monthly futures basis rate reflects weakness.Significant Bitcoin accumulation by listed companies and rising spot Bitcoin ETF inflows absorb mining supply, reducing the impact of potential selling.Bitcoin (BTC) reclaimed the $78,000 level amid broader risk-on sentiment, as the S&P 500 Index jumped to an all-time high on Friday. Despite 15% gains over the past 30 days, options markets are pricing in 25% odds that Bitcoin will trade above $84,000 by the end of May. Derivatives markets remain skeptical of further gains, although institutional spot demand remains solid.Bitcoin monthly options at Deribit. Source: DeribitBitcoin call (buy) options with a May 29 expiry and an $84,000 strike price traded at 0.0136 BTC, or $1,063. Considering there are 27 days left until expiry, the implied probability for Bitcoin price gaining 8% in May stood at 25%. Bitcoin put (sell) options have consistently traded at a premium over the past month, indicating heightened demand for downside price protection.Bitcoin options 30-day delta skew (put-call) at Deribit. Source: LaevitasThe delta skew measures the gap between put and call options, which usually ranges between -6% to +6% in balanced markets. When professional traders are unwilling to take downside price exposure, the indicator jumps above the 6% neutral threshold, a level that has been the norm for the past month. A similar trend has also been prevalent in BTC futures markets.Bitcoin 2-month futures basis rate. Source: LaevitasThe Bitcoin monthly futures basis rate usually trades at a 4% to 8% premium relative to regular spot markets to account for the cost of capital. However, this metric has displayed weakness over the past 30 days. The lack of demand for bullish leveraged positions can be partially explained by Bitcoin’s 12% decline year-to-date in 2026.Bitcoin accumulation by spot ETFs and listed companiesWhile derivatives traders show little confidence that Bitcoin will reach $84,000, US-listed spot Bitcoin exchange-traded funds (ETFs) tell a different story. These instruments accumulated $1.3 billion in net inflows during March and another $2 billion in April, driving total net assets above $100 billion. This metric is commonly used as a proxy for institutional investor demand.Related: Bitcoin’s surge to $77K pressures shorts, but absent spot and long leverage caps ralliesUS-listed spot Bitcoin ETFs monthly net flows, USD. Source: SoSoValueSimilarly, listed companies have added massive Bitcoin positions to their reserves over the last 30 days. These include 56,235 BTC from Strategy (MSTR US), 5,075 BTC from Metaplanet (3350 JP), and 929 BTC from Strive (ASST US). By acquiring more than the equivalent of five months of future Bitcoin mining supply, these companies greatly reduce potential sell pressure.The lack of demand for bullish Bitcoin derivative exposure does not invalidate the odds that the BTC price will reach $84,000 or higher by the end of May. As long as institutional appetite remains solid, the bullish momentum should continue.This article is produced in accordance with Cointelegraph’s Editorial Policy and is intended for informational purposes only. It does not constitute investment advice or recommendations. All investments and trades carry risk; readers are encouraged to conduct independent research.

Čítaj viac

Three Bitcoin data points suggest a rally to $80K is imminent

Several Bitcoin (BTC) data points suggest that $80,000 is the next destination for the cryptocurrency. Bitcoin gained 2.52% to trade above $78,800 on Friday after holding support at the 100-day exponential moving average. Spot market buy volumes also strengthened while the cumulative volume delta (CVD) reached 11,500 BTC, its highest level since Feb. 17. BTC futures activity is picking up, with the open interest rising 6.64% to 257,000 BTC, indicating fresh positioning.Bitcoin’s daily trend recovery shows fresh positioningBitcoin rebounded from its 100-day exponential moving average (100-EMA) after retesting the daily trend over the past two days. The move lifted the price by 2.52% to $78,800 on Friday, holding the short-term uptrend intact.The 100-day EMA, currently acting as dynamic support on the daily chart, suggests that the higher time-frame chart remains bullish. BTC/USDT on the one-day chart. Source: Cointelegraph/TradingViewThe spot demand is strengthening at the same time. The spot cumulative volume delta (CVD), which tracks net buying versus selling, reached 11,500 BTC, a new high since Feb. 17. This indicates buyers are absorbing the supply during the recent dip. Derivatives positioning is expanding in tandem with price, pointing to fresh participation. The aggregated open interest has risen 6.64% to 257,000 BTC over the past 24 hours, indicating new positions are being added as Bitcoin consolidates below $80,000. BTC price, spot, and futures CVD. Source: VeloThis follows a recent leverage flush of roughly 9,000 BTC, suggesting that excess positioning has been cleared as the leveraged market rebuilds. The futures CVD adds further context. Futures volume has recovered to 98,300 BTC, signaling a return of net buying pressure. However, it remains below the levels seen during the April 27 correction, suggesting trader positioning is still developing. At the same time, liquidity continues to cluster in the $78,000–$80,000 range, with $2.1 billion in short positions at risk, which could lead to a short squeeze near the key level.Bitcoin liquidation heatmap. Source: CoinGlassRelated: Bitcoin ETFs draw $2B in April for highest monthly inflows this yearBTC demand from institutions tightens the available supplyBTC institutional activity continues to lean supportive. The 30-day change in OTC desk balances has fallen to around -20,700 BTC, matching levels last seen in March 2025. The lower balances indicate BTC moving off desks, reducing the immediately available supply.Bitcoin: Total OTC desk balance. Source: CryptoQuantThe exchange-traded fund (ETF) flows show a similar pattern. With ETF flows reaching $1.97 billion in April. Bitcoin research newsletter Ecoinometrics noted a nine-day streak of inflows, the longest in 2026.Ecoinometrics explained that while the pace of inflows is moderate, the consistency has improved, adding, “The last time flows showed this kind of persistence was right before the October 2025 peak. Not saying we’re there yet, but it tells you the direction is improving.”The near-term focus is on how long flows sustain themselves and whether liquidity above $80,000 thins as spot, futures, and institutional participation increase.ETF inflow streak improves for Bitcoin. Source: Ecoinometrics/XRelated: Bitcoin’s $75K cost basis emerges as key support zone for current bull trendThis article is produced in accordance with Cointelegraph’s Editorial Policy and is intended for informational purposes only. It does not constitute investment advice or recommendations. All investments and trades carry risk; readers are encouraged to conduct independent research.

Čítaj viac

XRP sentiment hits 2-year high, but why is price stuck?

XRP’s (XRP) sentiment on social media has risen sharply over the last few days, but overhead resistance at $1.40 kept the price in consolidation.Key takeaways:XRP’s social media sentiment has risen 240% over the last 30 days to a two-year high.XRP price recovery may face resistance at $1.40, with a prolonged consolidation likely..XRP sentiment jumps on integration with Rakuten Pay News of XRP’s integration with the Japanese payment platform, Rakuten Wallet, has sparked renewed optimism among investors. Related: XRP set for ‘strongest’ 2026 monthly ETF inflows as bulls target $2This integration allows Rakuten’s over 44 million users to convert their loyalty points (worth over $23 billion) directly into XRP, trade it in-app, and spend it at over 5 million merchant locations via the Rakuten Pay app. This marks “one of the largest retail deployments of $XRP as a payment method to date,” bridging loyalty programs, payments, and crypto utility in a major world economy, Ripple said in an X post on Thursday.XRP integrates with Rakuten Pay. Source: RippleAs a result, XRP saw its “2nd highest bullish sentiment across social media in the past 2 years,” Santiment said in a Thursday post on X. Santiment’s Positive/Negative sentiment indicator, which measures the ratio of positive to negative social media mentions for a cryptoasset, shows XRP has a score of 3.9, levels last seen in early 2024.This was more than 240% higher than the 1.135 value recorded on March 29, following a 20% price drop over two weeks. Traders are showing excitement over the fact that XRP is “seeing further adoption,” the onchain data provider said, adding:“As far as price goes, these events don’t often instantly lead to major price outbreaks. It is usually after the initial wave of euphoria, after FOMO calms down, that the impact of this kind of news sees the bullish outcome.”XRP’s Positive/Negative sentiment metric. source: Santiment“Buy $XRP with points. Spend it across millions of merchants in Japan,” analyst John Squire said in reaction to the development, adding:“This is what mass adoption looks like.”Following this news, XRP/USD jumped 2% over the last 24 hours, but remains 62% below its $3.66 multi-year high reached in July 2025. XRP faces stiff resistance above $1.40XRP’s recent 18% rally from its local low at $1.27 reached on April 5 was stopped at $1.48, coinciding with the upper boundary of a symmetrical triangle. This trend line has suppressed the price since early February, as shown in the chart below. Bulls must push the price above the $1.40-$1.45 resistance zone to confirm a bullish breakout from the triangle. This area is also where the 50-day exponential moving average, the 100-day simple moving average and the upper trend line of the triangle sit, reinforcing the significance of this resistance zone.XRP/USD daily chart. Source: Cointelegraph/TradingViewAccording to XRP’s cost-basis distribution data, investors hold approximately 2 billion XRP at an average cost of $1.40-$1.45, creating a potential resistance zone. This concentration suggests many investors may sell at break-even, potentially stalling XRP’s upward momentum.XRP cost basis distribution chart. Source: GlassnodeA break above this supply area could open the way for a rally toward the measured target of the triangle at $2.10, about 50% above the current price. In a Friday post on X, analyst ChartNerd said a big move was brewing for XRP price once resistance above $1.40 is “cleared.”As Cointelegraph reported, the XRP/USD pair was required to hold the $1.27 support and rise above the moving averages around $1.40 to signal a trend change. This article is produced in accordance with Cointelegraph’s Editorial Policy and is intended for informational purposes only. It does not constitute investment advice or recommendations. All investments and trades carry risk; readers are encouraged to conduct independent research.

Čítaj viac

Price predictions 5/1: BTC, ETH, XRP, BNB, SOL, DOGE, HYPE, ADA, BCH, XMR

Key points:Bitcoin will have to flip the $80,000 level into support to continue its up move to $84,000.Several major altcoins are finding buyers at lower levels, but they will have to overcome the overhead resistance to start a new up move.Bitcoin (BTC) has risen above $78,000, extending upon its 11.87% rally in April, per CoinGlass data. The recovery in April was supported by solid buying in the US spot BTC exchange-traded funds, which saw $1.97 billion in inflows, according to SoSoValue data.The rally is expected to encounter selling in the zone between the True Market Mean at $78,000 and the Short-Term Holder (STH) cost basis at $79,000. Analysts are closely monitoring the $80,000 level, which needs to be flipped into support for confirmation that bulls remain in control.Crypto market data daily view. Source: TradingViewCryptoQuant is not convinced that BTC’s rally could extend further. In a recent report, the crypto analytics firm said that BTC’s up move in April was fuelled mainly by futures traders, while spot demand contracted. That suggests “the market’s marginal buyer was speculative, not fundamental.” CryptoQuant warned in an X post that the exact setup had “preceded the next leg down” in 2022.Could BTC and the major altcoins break above their overhead resistance levels? Let’s analyze the charts of the top 10 cryptocurrencies to find out.Bitcoin price predictionBTC turned up from the 20-day exponential moving average ($75,814) on Thursday, indicating buying on dips. BTC/USDT daily chart. Source: Cointelegraph/TradingViewThe relief rally is expected to face selling pressure at $79,500, but if buyers pierce the overhead resistance, the uptrend is expected to gain momentum, and the BTC/USDT pair may rally to $84,000. The 20-day EMA is the crucial support to watch out for on the downside. If the BTC price turns down from the current level or the overhead resistance and breaks below the 20-day EMA, it may start a deeper correction to the 50-day simple moving average ($72,362) and then the support line.Ether price predictionEther (ETH) is finding support near the 50-day SMA ($2,207), indicating that bulls are viewing the dips as a buying opportunity.ETH/USDT daily chart. Source: Cointelegraph/TradingViewThe flattening 20-day EMA and the relative strength index (RSI) just above the midpoint suggest weakening momentum. If the ETH price turns down and breaks below the 50-day SMA, the next stop is likely to be the support line.Instead, if the price remains above the 20-day EMA, the bulls will attempt to drive the ETH/USDT pair to $2,465 and then to the ascending channel’s resistance. The next trending move is expected to begin on a close above the resistance line or below the support line. Until then, the pair may remain inside the channel.XRP price predictionXRP (XRP) remains stuck inside the $1.27 to $1.61 range, signaling buying on dips and selling on rallies.XRP/USDT daily chart. Source: Cointelegraph/TradingViewThe 20-day EMA ($1.39) has started to turn down gradually, and the RSI is near the midpoint, indicating a slight edge to the bears. If the XRP price remains below the moving averages, the likelihood of a drop to the $1.27 support increases.Buyers are likely to have other plans. They will attempt to thrust the price above the moving averages. If they succeed, the XRP/USDT pair may rally to the downtrend line of the descending channel pattern, then to the $1.61 resistance. A trend change will be signaled on a close above the $1.61 level.BNB price predictionBNB (BNB) slipped below the moving averages on Tuesday, but the bears have failed to build upon their advantage. That suggests demand at lower levels. BNB/USDT daily chart. Source: Cointelegraph/TradingViewThe bulls are attempting to push the BNB price back above the moving averages. If they manage to do that, the BNB/USDT pair may rise to $654 and then to the $687 overhead resistance.On the other hand, if the price turns down and breaks below $610, it signals that the sellers remain in control. The pair may then tumble toward the $570 support, where the buyers are expected to step in.Solana price predictionBuyers are attempting to sustain Solana (SOL) above the $82.65 level but the bears continue to exert pressure.SOL/USDT daily chart. Source: Cointelegraph/TradingViewIf the $82.65 level cracks, the SOL/USDT pair may decline to $76. Buyers are expected to defend the $76 level with all their might, as a close below it may start the next leg of the downward move to $67.On the contrary, if the SOL price rises above the moving averages, it suggests that the pair may remain inside the $82.65 to $90.73 range for some time. A close above $90.73 opens the gates for a retest of the $98 overhead resistance.Dogecoin price predictionDogecoin (DOGE) is showing strength, as bulls prevented the pullback from dipping below the $0.10 level on Thursday.DOGE/USDT daily chart. Source: Cointelegraph/TradingViewThat increases the likelihood of a rally to the $0.12 overhead resistance, where the bears are expected to mount a strong defense. If the price turns sharply lower and breaks below the moving averages, it suggests the DOGE/USDT pair may remain within the $0.09 to $0.12 range for a while longer.Alternatively, if buyers overcome the $0.12 obstacle, it suggests that the pair may have bottomed out in the near term. The DOGE price may rise to $0.14 and later to $0.16.Hyperliquid price predictionHyperliquid (HYPE) fell below the 50-day SMA ($39.84) on Thursday but the long tail on the candlestick shows buying at lower levels.HYPE/USDT daily chart. Source: Cointelegraph/TradingViewThe bulls are striving to push the HYPE price above the 20-day EMA ($40.85). If they manage to do that, the HYPE/USDT pair may rally toward the $43.76-$45.77 overhead resistance zone. A close above the zone clears the path for a rally to $50.Contrary to this assumption, if the price turns down and breaks below $38.70, it signals that the bears are selling on rallies. That may start a deeper pullback to $37.77 and subsequently to $34.45.Related: Did Dogecoin bottom first? DOGE price poised for 20% gains as whales returnCardano price predictionCardano (ADA) has been clinging to the moving averages, indicating that the bulls have kept up the pressure.ADA/USDT daily chart. Source: Cointelegraph/TradingViewThat improves the prospects of a break above the downtrend line. If that happens, the ADA/USDT pair may surge to $0.32 and later to $0.37, signaling a potential short-term trend change.This bullish view will be invalidated in the near term if the ADA price turns sharply lower and breaks below $0.22. Such a move suggests that the pair may remain inside the descending channel for a few more days.Bitcoin Cash price predictionBitcoin Cash (BCH) bounced off $443 again, indicating that the bulls are aggressively defending the level.BCH/USDT daily chart. Source: Cointelegraph/TradingViewThere is minor resistance at the 50-day SMA ($453), but it is likely to be crossed. The BCH/USDT pair may then soar to $486, at which point bears are expected to sell aggressively. However, if buyers overcome the barrier, the pair may rally to $520.Contrary to this assumption, if the BCH price turns sharply lower from $486 and breaks below the moving averages, it suggests that bears remain sellers on rallies. That may keep the pair range-bound between $419 and $486 for some time.Monero price predictionMonero (XMR) bounced off the 20-day EMA ($366) on Wednesday, indicating a positive sentiment. XMR/USDT daily chart. Source: Cointelegraph/TradingViewThe upsloping 20-day EMA and the RSI in positive territory indicate that the path of least resistance is upward. If buyers push and maintain the XMR price above the $406 resistance, the rally may reach the $500 level.Conversely, if the price turns sharply lower from the overhead resistance and breaks below the moving averages, it suggests that the XMR/USDT pair may remain range-bound between $302 and $406 for some time.

Čítaj viac

Did Dogecoin bottom first? DOGE price poised for 20% gains as whales return

Dogecoin (DOGE) has outpaced the broader crypto market over the past month, rising roughly 18% versus the market’s 10% gain, as whale accumulation and a bullish chart setup hint at a potential bottom.DOGE/USDT vs. TOTAL crypto market cap 30-day returns. Source: TradingViewKey takeaways:DOGE whale holdings hit a record high as large transactions reached a six-month peak.DOGE’s triangle breakout targets $0.131, with $0.088 as the key invalidation level.DOGE whale holdings hit new high amid April price rallyDogecoin wallets holding at least 100 million DOGE controlled a record 108.52 billion DOGE, worth roughly $11.6 billion, as of late April, compared to under 107.95 billion DOGE in mid-April, according to data resource Santiment.Dogecoin whale transaction count and holdings. Source: SantimentThe accumulation coincided with DOGE’s 23.50% price rebound, suggesting large holders helped support the move.DOGE/USDT weekly chart. Source: TradingViewWhale activity also spiked. On April 28, Santiment recorded 739 Dogecoin transfers worth more than $100,000 in a single day, the highest count in six months. The surge came alongside the launch of 1Shares’ physically backed Dogecoin ETP on Xetra, Germany’s leading electronic trading platform.DOGE triangle breakout points to 20% upsideFrom a technical standpoint, the DOGE price has entered the breakout stage of what appears to be a descending triangle pattern.DOGE/USDT weekly chart. Source: TradingViewIn classical technical analysis, descending triangles signal persistent selling pressure. These structures usually resolve to the downside, but upside breakouts do occur, especially in broader accumulation trends.For instance, BTC formed a multi-month descending triangle in 2021 after the China mining crackdown.BTC/USD three-day price chart. Source: TradingViewThe structure leaned bearish, but price broke above the descending trendline near $35,0000, triggering a squeeze that led to a rally over $52,000 in the following weeks.Applying the same technical rule to DOGE charts puts its upside target for May at around $0.131, up about 20% from the current price. The level aligns with DOGE’s 200-week simple moving average (200-week SMA, the blue line).DOGE/USDT weekly chart. Source: TradingViewSuch a move would push Dogecoin above the average acquisition cost of large DOGE wallets holding more than 10,000 DOGE (green), currently near $0.115. It would also clear DOGE’s aggregate cost basis (black) around $0.132.Historically, reclaiming these cost-basis levels has preceded extended bullish phases, as more holders return to profit and selling pressure eases. DOGE realized price by wallet size. Source: GlassnodeConversely, a rejection near current levels, around the 20-week EMA (green) resistance, would weaken the bullish breakout case. Such a pullback could put DOGE at risk of revisiting its local low near $0.088 in May.This article is produced in accordance with Cointelegraph’s Editorial Policy and is intended for informational purposes only. It does not constitute investment advice or recommendations. All investments and trades carry risk; readers are encouraged to conduct independent research.

Čítaj viac

Bitcoin seals best monthly gain in a year as S&P 500 hits fresh all-time high

Bitcoin (BTC) eyed $77,500 on Friday after US stocks posted fresh record highs on strong tech earnings.Key points:Bitcoin continues a rebound after the monthly close as stocks hit record highs.Strong tech earnings propel the S&P 500 over 7,200 points for the first time in history.PCE inflation data nears its highest levels in three years, prompting speculation about next month’s numbers.Bitcoin creeps higher while S&P 500 makes historyData from TradingView showed near 12% April BTC price gains as risk assets ignored rising US inflation signs.BTC/USD one-month chart. Source: Cointelegraph/TradingViewThe S&P 500 reached nearly 7,220 points before closing ten points lower, propelled by stronger-than-expected earnings from Google and Apple.Reacting on X, trading resource The Kobeissi Letter noted that the S&P had added over $8 trillion in market cap since hitting local lows at the end of March.“A year ago it was at 5,600. 5 years ago it was at 4,200. 10 years ago it was at 2,100,” Charlie Bilello, chief market strategist at wealth manager Creative Planning, added.S&P 500 one-day chart. Source: Cointelegraph/TradingViewWhile Bitcoin’s gains were less pronounced, markets en masse appeared uninterested in US inflation warnings.The March print of the Personal Consumption Expenditures (PCE) came in at 3.5%, per data from the US Bureau of Economic Analysis (BEA), marking its highest since August 2023.Known as the Federal Reserve’s “preferred” inflation gauge, PCE had previously conformed to market estimates.“In the first month of the Iran War, US inflation hit a 3-year high,” Kobeissi commented. “April’s data will be interesting.”US PCE Indexes. Source: BEABTC price still struggling with support reclaimBitcoin thus closed out April’s monthly candle with mixed messages.Related: Bitcoin Coinbase Premium threatens bear flag repeat with BTC price at $76KAt 11.9%, BTC/USD saw its highest monthly gains in a year, CoinGlass data confirmed, but the monthly candle fell short of reclaiming key support lines.BTC/USD monthly returns (screenshot). Source: CoinGlassAs Cointelegraph reported, these included the 21-week exponential moving average (EMA), with only a single weekly close above it since last October.“The Bitcoin pullback continues and this is looking more and more like an EMA rejection, especially if BTC isn’t able to Weekly Close above the EMA by end of week,” trader and analyst Rekt Capital warned X followers on Wednesday.He added that a retest of the mid-$60,000 zone on weekly time frames was “technically necessary to achieve full breakout confirmation.”BTC/USD one-week chart. Source: Rekt Capital/XThis article is produced in accordance with Cointelegraph’s Editorial Policy and is intended for informational purposes only. It does not constitute investment advice or recommendations. All investments and trades carry risk; readers are encouraged to conduct independent research.

Čítaj viac
Načítava

Získaj BONUS 8 € v Bitcoinoch

nakup bitcoin z karty

Registrácia Binance

Burza Binance

Aktuálne kurzy