Can Bitcoin hit $250K this year? Traders say it may be time to ‘sell in May’
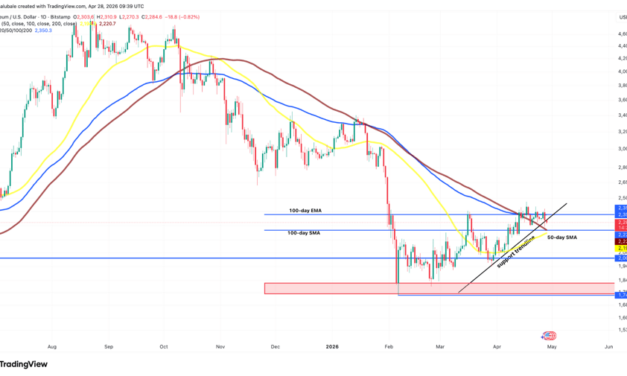
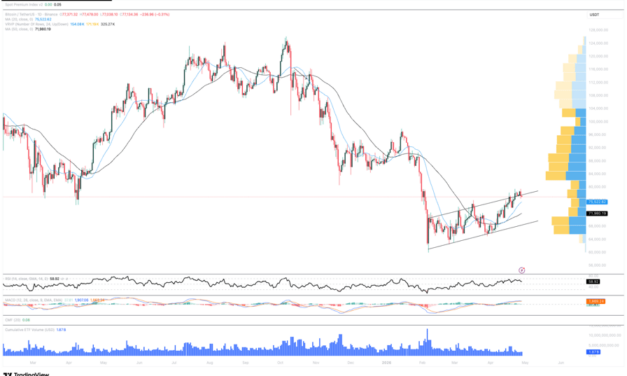
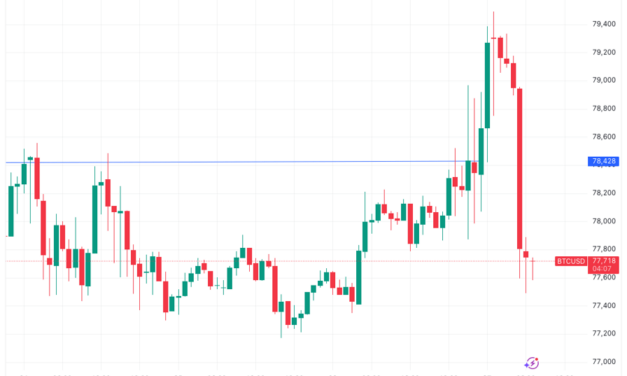
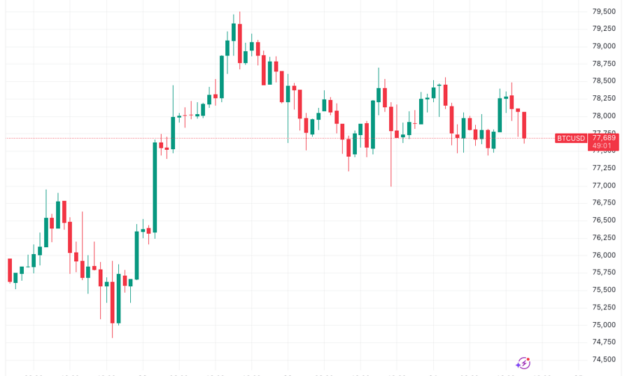
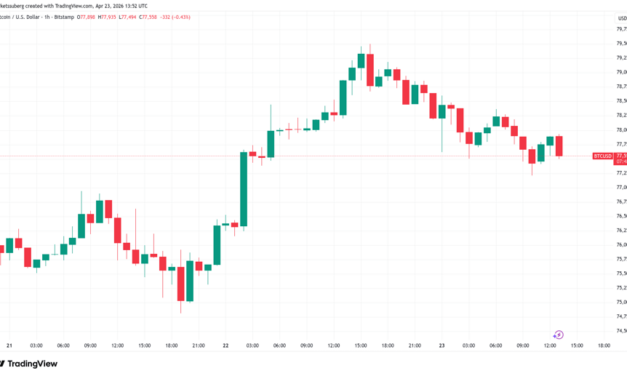
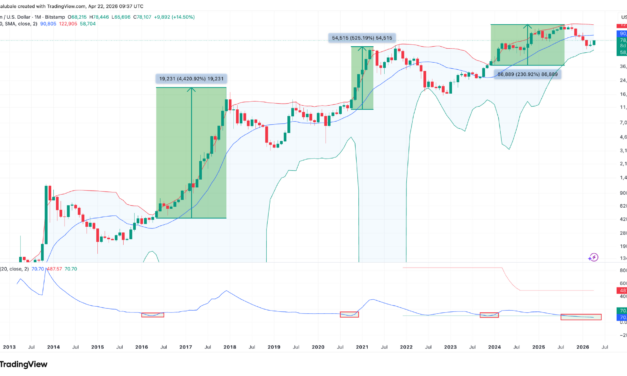
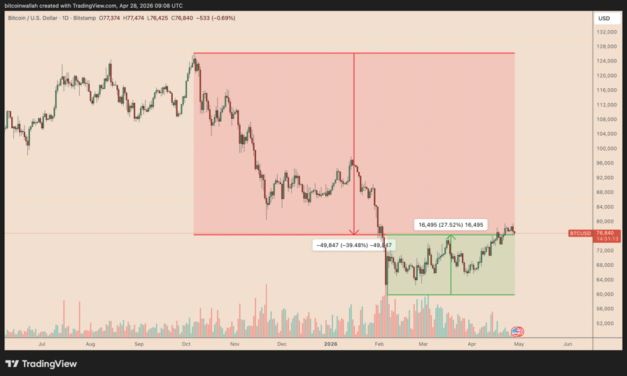
Bitcoin (BTC) is trading roughly 40% below its October 2025 record high near $126,000 despite its ongoing recovery.BTC/USD daily chart. Source: TradingViewStill, some of the cryptocurrency’s loudest bulls, including billionaire investor Tim Draper and Fundstrat’s co-founder Tom Lee, have not backed down from their $250,000 year-end prediction, a target that would require more than a threefold rally from current levels.Is that realistic, or is Bitcoin’s latest drawdown a warning that the cycle has already peaked?Key takeaways:Bitcoin’s selloff may resume due to a bearish continuation setup.Halving and midterm election fractals appear bearish for the BTC price in 2026.Veteran trader warns of more BTC price declinePeter Brandt, a veteran futures market trader, highlighted a maturing bear flag channel on the Bitcoin daily chart, which could keep BTC’s odds of rising toward $250,000 this year low.As of Tuesday, BTC was showing signs of a pullback after testing the flag’s upper boundary near $79,500 as resistance. The cryptocurrency risks declining toward the flag’s lower boundary around the $69,000 level by May if the correction persists.Those of you predicting $250,000 in 2026 need to stop with the mushroomsThis is called a channel While it does not preclude further price gains, it is NOT a bullish bottoming patternSource: XA bear flag fully resolves when the price decisively breaks below the lower boundary and drops to a level at length equal to the height of the previous downtrend.A break below the flag’s lower trend line may push the BTC price under $50,000 if the technical setup plays out as intended.BTC/USD daily chart. Source: TradingViewBitcoin halving fractals show the bear market is midwayBTC’s price cycles have historically followed a clear pattern tied to its halvings every four years. Cycle peaks have consistently occurred 12 to 18 months after the event. In 2012, the peak arrived in 12 months. The 2016 halving saw its top in 17 months, while the 2020 halving peaked after 18 months. The April 2024 halving fits this timeline. Bitcoin hit its all-time high of $126,000 in October 2025, roughly 17–18 months later. Bitcoin price performance since halvingNow, in late April 2026 (over 24 months post-halving), BTC trades around $77,000, down 38%–40% from that peak. This alignment suggests the 2025 high may represent the cycle top, casting doubt on new highs for the remainder of 2026.Bitcoin sell-off may resume in MayA chart by analyst Merlijn The Trader is adding to the cautious narrative, pointing to a recurring “Sell in May” pattern in US mid-term election years. For instance, BTC dropped 61% in 2014, 65% in 2018, and 66% in 2022, each beginning around May of the election years. BTC/USD one-month chart. Source: TradingView/Merlijn The TraderApplying a similar framework to 2026, Merlijn projected a potential decline of over 60%, which would place BTC near the $30,000 level.In a February report, Capital Group analysts Matt Miller and Chris Buchbinder said midterm elections often raise uncertainty over congressional control and policy direction. As campaign rhetoric heats up in the spring, investors tend to cut risk, slow buying, and brace for volatility.That backdrop weakens the case for Bitcoin reaching $250,000 by year-end, even though several analysts, including those from Bernstein, see room for a more modest rebound toward the $100,000–$150,000 range. This article is produced in accordance with Cointelegraph’s Editorial Policy and is intended for informational purposes only. It does not constitute investment advice or recommendations. All investments and trades carry risk; readers are encouraged to conduct independent research.
Čítaj viac