Bitcoin price eyes $66K as US stocks rise on Iran-strike pause
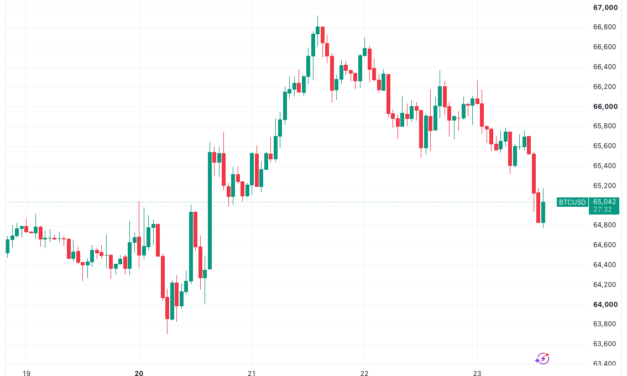
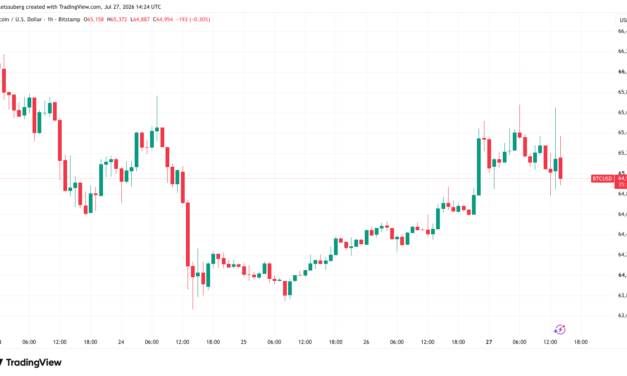
Bitcoin (BTC) sought to build on local highs at Monday’s Wall Street open as US stocks opened in the green.Key points:Bitcoin approached new local highs with the start of the week’s first US trading session.Stocks also opened higher amid relief over a hiatus in the US-Iran war and potential progress on reopening the Strait of Hormuz.BTC price action defended two daily moving averages on Sunday’s weekly close.Bitcoin follows stocks higher as Iran news offers risk-asset tailwindData from TradingView showed BTC/USD spiking to near $66,000 as markets reacted to a pause in strikes between the US and Iran. BTC/USD one-hour chart. Source: Cointelegraph/TradingViewAdditional reports cited an Iranian foreign ministry spokesman announcing that Tehran and Oman were “trying to establish mechanisms regarding maritime traffic” through the Strait of Hormuz, a key global oil route currently closed.US WTI crude oil fell toward $82 per barrel on Monday before a modest rebound. The S&P 500 and Nasdaq Composite Index were both up by around 0.3% at the time of writing.CFDs on US WTI crude oil one-hour chart. Source: Cointelegraph/TradingViewAcknowledging a potential stumbling block in the form of higher US bond yields, trading company QCP Capital voiced that they were anticipating tailwinds for the crypto market going forward. “Digital assets have generally outperformed equities in July despite a more challenging macro backdrop,” the firm wrote in its latest Market Color analysis. “BTC and ETH are up approximately 11.6% and 24.6% month-to-date, respectively, even as higher Treasury yields and periodic risk-off sentiment have weighed on broader markets.”QCP referenced developments around the CLARITY Act, a key piece of proposed crypto legislation still under consideration.“Market attention also remains on developments surrounding the proposed CLARITY Act, which continues to be closely followed by digital asset participants given its potential implications for the US regulatory framework,” it continued.BTC price support holds but remains fragileAmong Bitcoin traders, caution mixed with quiet optimism over BTC price action on shorter time frames.Related: Rate path still divides investors: Five things to know in Bitcoin this weekCrypto trader and analyst Michaël Van de Poppe highlighted that BTC was holding the 21-day and 50-day simple moving averages (SMAs) as support. These stood at $64,289 and $63,261, respectively.“This is a strong signal for the markets to be betting on the long side of this asset, however, it’s still a little fragile,” he wrote in ongoing updates on X. “I’d much prefer to see a strong move to $66,000-67,000 over the next 1-3 days to see a continuous bid coming in.”BTC/USDT one-day chart. Source: Michaël Van de Poppe on X.comData from CoinGlass showed crypto short liquidations spiking as the market rose, with these nearing $250 million over a 24-hour period.BTC/USD vs. crypto liquidations (screenshot). Source: CoinGlass
Čítaj viac