Self-custody Bitcoin amount unmeasurable so far, says Santiment exec
One of the most notable results of self-custody is that it tends to decrease circulation, which in turn reduces the market cap.
Čítaj viac
One of the most notable results of self-custody is that it tends to decrease circulation, which in turn reduces the market cap.
Čítaj viac
Cointelegraph analyst and writer Marcel Pechman explains why the cryptocurrency market has lost 60% of its market cap, with the S&P 500 only about 15% from its all-time high. Cointelegraph YouTube Subscribe
Čítaj viac
Memecoins are back in the headlines as PEPE booms, taking the market capitalization of speculative tokens over $20 billion.
Čítaj viac
The first quarter of 2023 saw Bitcoin outperform traditional assets after a 72% quarterly gain in market capitalization.
Čítaj viac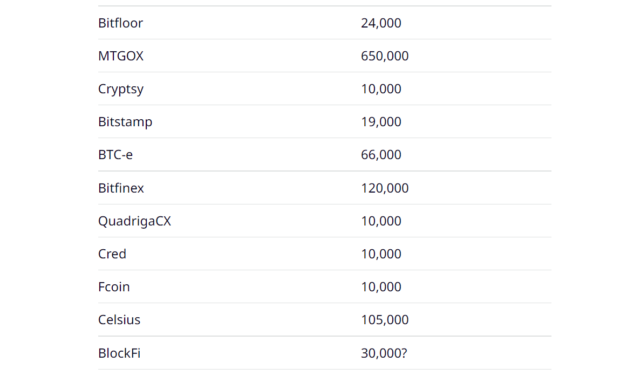
One of the biggest factors differentiating Bitcoin (BTC) from fiat currency and most cryptocurrencies is the hard limit of 21 million on its total circulating supply. However, the demise of numerous crypto exchanges over the last decade has permanently taken out at least 5.7% (1.2 million BTC) of the total issuable Bitcoin from circulation.The lack of clarity around a crypto exchange’s proof-of-reserves came out as the primary reason for their sudden collapses, as seen recently with FTX. Historical data around crypto crashes revealed that 14 crypto exchanges, together, were responsible for the loss of 1,195,000 BTC, which represents 6.3% of the 19.2 Bitcoin currently in circulation.Bitcoin lost due to defunct crypto exchanges. Source: Casa BlogAn investigation conducted by Jameson Lopp, co-founder and CTO of Bitcoin storage platform CasaHODL, revealed that Mt. Gox maintains the top position when it comes to exchanges losing BTC holdings.While the scarcity of Bitcoin is directly related to its value as an asset, Lopp pointed out that fake Bitcoin offerings currently threaten the ecosystem, adding that “Bitcoin will not be a great store of value if most people are buying fake bitcoin.” Investigations confirm that at least 80 crypto assets have “Bitcoin” in their names, aimed purely to mislead BTC investors.As a result, investors purchasing fake Bitcoin assets negatively impact the price appreciation of the original Bitcoin.80+ crypto assets have the word “bitcoin” in their name.14 have a market cap over $1,000,000.3 claim to be Bitcoin.1 is Bitcoin.— Jameson Lopp (@lopp) September 22, 2022To ensure Bitcoin’s position as sound money, self-custody comes out as the most effective way to reduce reliance on crypto exchanges and corporate “paper Bitcoin” contracts.Related: Blockstream CEO Adam Back talks Bitcoin over a game of JengaSalvadorean President Nayib Bukele announced plans to acquire 1 BTC every day starting from Nov. 17, 2022. We are buying one #Bitcoin every day starting tomorrow.— Nayib Bukele (@nayibbukele) November 17, 2022
Public records show that El Salvador currently holds 2,381 BTC at an average buying price of $43,357. However, stagnant Bitcoin performance opened up a window of opportunity for the country to substantially bring down its average price of Bitcoin acquisition.
Čítaj viac
A cryptocurrency’s maximum supply is the total number of tokens that will ever be mined, and it is usually defined when the genesis block is created. Bitcoin’s maximum supply is capped at 21 million, and although anything is possible, its strict protocol and code are built so that no more BTC can ever be mined. Other cryptocurrencies do not have a maximum supply but may have a cap on the number of new coins that can be minted with a specific cadence, like in the case of Ether. Stablecoins, on the other hand, tend to keep the maximum supply constant at all times to avoid a supply shock that could affect and fluctuate the price too much. Their stability is guaranteed by collateral reserve assets or algorithms created to control supply through the burning process. Algorithmically-backed coins are designed to maintain a stable price, but they have drawbacks as they are vulnerable to de-pegging risks. Also, non-algorithmic stablecoins like Tether may risk de-pegging, as happened in June 2022, showing that even coins that should provide more certainty may be at risk. The other two metrics — circulating and total supply — also affect a token’s price, but to a lesser extent than the maximum supply. When a cryptocurrency hits maximum supply, no more new coins can ever be created. When that happens, two main results are produced: The cryptocurrency becomes more scarce and as a result, its price may increase if demand exceeds supply; Miners have to rely on fees to get rewards for their contributions. In the case of Bitcoin, the total supply gets cut in half through a process called the halving, so it is calculated that it will reach its maximum supply of 21 million coins in the year 2140. Although Bitcoin’s issuance increases over time through mining and is therefore inflationary, block rewards are cut in half every four years, making it a deflationary cryptocurrency.
Čítaj viac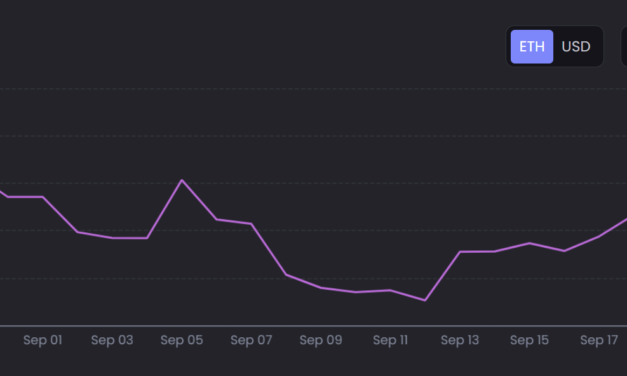
Over the past two years, nonfungible tokens (NFTs) gave the crypto ecosystem the boost it needed to grab mainstream attention — owing to the involvement of prominent artists and celebrities. However, despite the enormous losses suffered by NFT investors following the ongoing, 10-month-long bear market, the ecosystem showed sustainable signs of a comeback in the last two weeks.Since Sept. 12, the performance of blue-chip NFT collections witnessed a steady growth, inching back toward the 10,000 Ether (ETH) that was lost in mid-August 2022, according to data by NFTGo. The performance of blue-chip NFT collections. Source: NFTGoOn Sept. 20, the market capitalization, which is derived from the floor price and the trading price of NFTs, spiked nearly 16.5% at roughly 11.25 million ETH. Market capitalization of NFT collections. Source: NFTGoReciprocating the market cap breach of the 11 million ETH mark for the first time in three months, the number of NFT holders grew 32.24% along the same timeline, as shown above.Ethereum Name Service (ENS) currently contributes the highest volume at 9.25%, which is followed by popular NFT collections such as Bored Ape Yacht Club and Otherdeed. NFT market sentiment. Source: NFTGoHowever, current market sentiment — calculated based on volatility, trading volume, social media and Google trends — remains cold as investors try to recoup their previous losses.Related: Post offices adopting NFTs leads to a philately renaissanceNFT marketplace OpenSea launched the OpenRarity protocol to verify the rarity of NFTs within its platform. The protocol aims to provide a reliable “rarity ranking” that would assist investors when considering purchasing NFTs.
Čítaj viac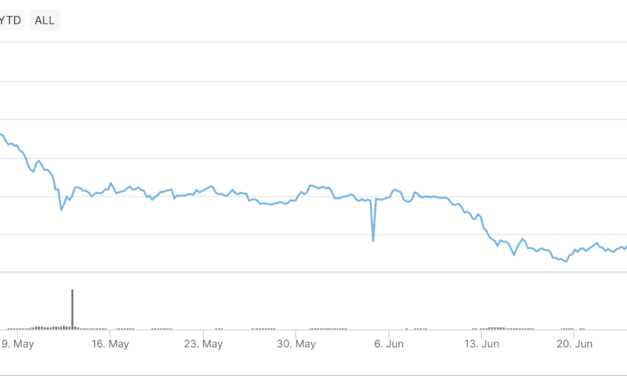
Bye bye Monday blues, hello bullish news – the total crypto market capitalization has retaken the $1 trillion level. The crypto market cap is now almost as valuable as all the silver on the planet.A price pump for Bitcoin (BTC) brought the world’s most decentralized cryptocurrency into the $22,500 range, while Ethereum (ETH) enjoyed a double-digit “giga pump” to kiss the $1,500 mark. Their combined efforts have culminated in a 4.8% pump to the entire crypto market, lifting it to a recent high of $1.02 trillion.The crypto market cap is back over the 1 trillion mark! Is it too early to start getting bullish? — Cointelegraph (@Cointelegraph) July 18, 2022 Bitcoin reclaimed the meme-worthy target of $420 billion in market cap, while Ethereum is sitting pretty at a total market cap of $180 billion, having added more than $20 billion in the past 24 hours. As per the below graph, the last time that the crypto market crossed the $1 trillion level was on June 13.Total crypto market cap for the past 3 months according to coinmarketcap.com/chartsA reminder on market capitalizations; in the case of Bitcoin and most mined cryptocurrencies, the “market cap” refers to the total value of all mined coins. For Bitcoin, it’s simple: multiply the total number of Bitcoin mined since January 3rd, 2009, (a little over 19,096,775) by the current price per Bitcoin, circa $22,000.The trillion dollar mark was welcome news to crypto advocates on Twitter. They were quick to celebrate the momentous milestone, while some, such as DonAlt, queried whether the new price levels could indicate a bullish reversal: So now that BTC is up and ETH is giga mooningAt what price level would a new bull market be confirmed for you guys— DonAlt (@CryptoDonAlt) July 18, 2022
Indeed, the beaten-down market is eager to bask in bullish news, given that the fear and greed index has sat at “extreme fear” or “fear” for months on end. Caution, fear and greed index still sits in extreme fear. Source: alternative.meNonetheless, before reaching for the champagne, spare a thought for the previous crypto market cap all-time high. It tipped the $3 trillion mark in quarter four of 2021, meaning $2 trillion has been lost. Related: Bitcoin hodling activity resembles previous market bottoms: GlassnodeThe crypto market cap reached the same value as Apple’s stock in April 2021 before surpassing $3 trillion. However, Apple is currently valued at $2.4 trillion, while crypto sits at $1 trillion. Consequently, there are some ways to go for crypto to match one of the world’s biggest, and certainly among the most well-known, companies.
Čítaj viac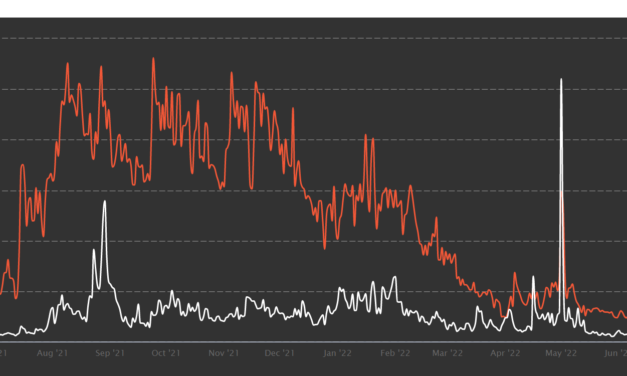
Nonfungible tokens (NFT) took center stage in the year 2021 as artists, influencers, A-list celebrities and the sports industry finally came across a fan engagement tool that empowered the general public to cash in on their success. However, the hype around NFT did not manage to stand its ground as sales plummeted to one-year lows amid the ruthless bear market of 2022.The NFT boom, which started in early 2021, upheld its glory until May 2022 — supported by a healthy and bullish crypto ecosystem and positive investor sentiment. However, Bitcoin’s (BTC) struggle to hold on to its all-time high prices had an adverse impact across the crypto ecosystem. Number of daily NFT sales between June 2021 – June 2022. Source: NonFungibleThe NFT ecosystem recorded its worst performance of the year in June 2022 as the total number of daily sales fell down to roughly 19,000 with an estimated value of $13.8 million — a number which was recorded back in June 2021. Last year, however, daily NFT sales of a similar amount were considered impressive as the nascent ecosystem saw mainstream implementations across various use cases. NFT market capitalization and trading volume. Source: NFTGoAs evidenced by data from nonfungible.com, the NFT ecosystem witnessed its highest number of daily sales of 224,768 NFTs on Sept. 24, 2021, worth $78.3 million. However, the biggest sale in terms of dollar value took place on May 1, 2022, when 118,577 NFTs were sold in a day for $780.4 million.Some of the key factors negatively impacting the hype around NFTs are falling Ether (ETH) prices, a lack of secondary market demand and unrealistic gas fees. As a result, over the last three months, the NFT market capitalization suffered a drop of nearly 40% while losing over 66% of its trading volume, as shown by data from NFTGo.Related: NFTs to appear on Facebook, cross-post with Instagram as Meta Web3 expansion continuesAmid the bear market, crypto entrepreneurs, including Changpeng “CZ” Zhao, are helping governments explore NFT use cases in ID-ing citizens. Social media giant Meta’s Facebook, too, recently announced plans to support NFTs for creators.We’re launching NFTs on Facebook! Excited to share what I’ve been working on with the world. pic.twitter.com/TaV66zRanV— Navdeep Singh (@navdeep_ua) June 29, 2022A Meta spokesperson revealed that the rollout of NFTs on Facebook would be gradual, beginning with select creators in the United States.
Čítaj viac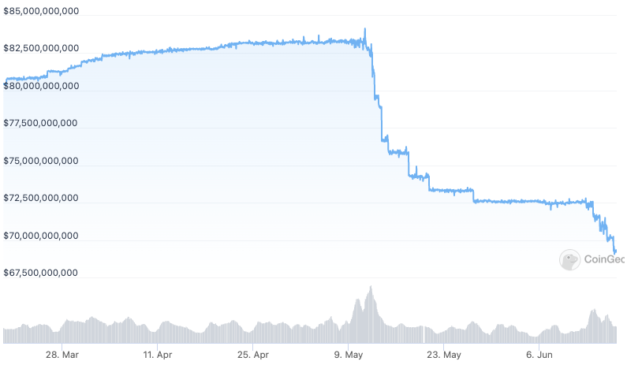
Tether (USDT), the biggest stablecoin and the third largest digital currency by market capitalization, continues losing its market value amid the current market downturn.On June 16, USDT’s market cap dropped below $70 billion for the first time since October 2021. The drop followed a cascade of repeated declines shortly after the USDT market value reached its all-time high above $80 billion in May.At the time of writing, Tether USDT’s market capitalization stands at $69.3 billion, up around $300 million from the multi-month low, according to data from CoinGecko.USDT 90-day market capitalization chart. Source: CoinGeckoTether’s biggest rival, USDC, is the second-largest U.S. dollar-pegged stablecoin backed by the peer-to-peer payments technology company Circle. The stablecoin reached $50 billion market cap in February and has never beaten Tether’s in market cap so far.While Tether has been losing its market share over the past few weeks, other stablecoins like the USD Coin (USDC) have been gaining value recently. As such, USDC market cap surged from about $48 billion in mid-May to $55 billion in mid-June.USDC 90-day market capitalization chart. Source: CoinGeckoTether’s shrinking market cap comes amid the ongoing market panic and uncertainty, with the market capitalization of all cryptocurrencies dropping below $1 trillion for the first time since February 2021.Related: Total supply of stablecoins dropped sharply for first time ever in Q2Tether firm has been actively posting statements to assure investors that the company has not been affected by the ongoing crypto lending crisis. On June 13, Tether declared that issues around the crypto lending platform Celsius had nothing to do with the firm and would not impact USDT reserves.Tether subsequently announced plans to get rid of commercial paper backing for the USDT stablecoin on June 15. The firm did not respond to Cointelegraph’s request for comment.
Čítaj viac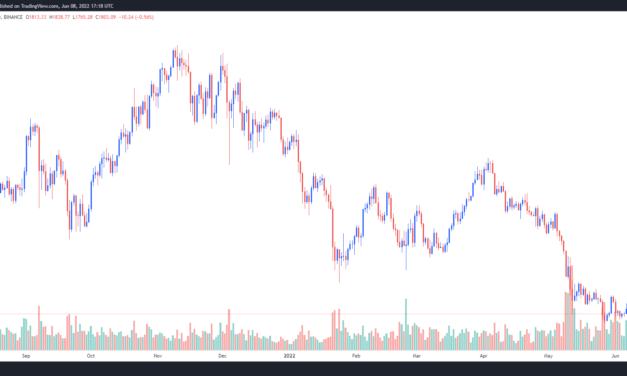
On June 8 the Ethereum network successfully underwent the merge to become proof-of-stake on its Ropsten testnet, but the news had little impact on ETH price. With the Ropsten upgrade now looking more like a buy the rumor, sell the news type of event, most analysts have kept a short-term bearish outlook for Ether price. Let’s take a look.ETH/USDT 1-day chart. Source: TradingViewCan Ether escape the head and shoulders pattern?Twitter analyst, “Cactus”pointed out a bearish head and shoulders pattern and questioned whether Ether price would be able to follow the sharp downside that typically follows the completion of the pattern.ETH/USD 1-week chart. Source: TwitterCactus said, “This is what we are getting excited about? Hard to be bullish any timeframe until we S/R [support/resistance] flip 2K.”The areas of support to keep an eye on below $1,800 were highlighted in the following chart posted by crypto analyst and pseudonymous Twitter user il Capo of Crypto, who ominously noted that “Lower highs all the time and that support has been touched a lot of times already.”ETH/USD 1-day chart. Source: TwitterThe analyst said, “Clean break of $1,700 and last leg down would be confirmed, with main target = $1,000.” The descending triangle pattern also forecasts further downsideA separate, but equally bearish descending triangle chart pattern was highlighted by Crypto Tony, who pondered if this is “something too obvious” to ignore. ETH/USD 1-day chart. Source: TwitterBased on the lower area of support highlighted on the chart provided by Crypto Tony, a breakdown below the current price could see Ether pullback to the $1,450 to $1,600 range. Related: Ethereum ‘double Doji’ pattern hints at a 50% ETH price rally by SeptemberPrice momentum turns negativeA more macro view of the general weakness being displayed by Ether was offered by cryptocurrency trader Cantering Clark, who said “If I didn’t think that this time was slightly different, I would look at this $ETH chart and think ‘Big ships turn slowly, and they don’t stop easily.’”ETH/USD 1-week chart. Source: TwitterCantering Clark said, “By high timeframe measures, this could be the beginning of actual momentum down.”The views and opinions expressed here are solely those of the author and do not necessarily reflect the views of Cointelegraph.com. Every investment and trading move involves risk, you should conduct your own research when making a decision.
Čítaj viac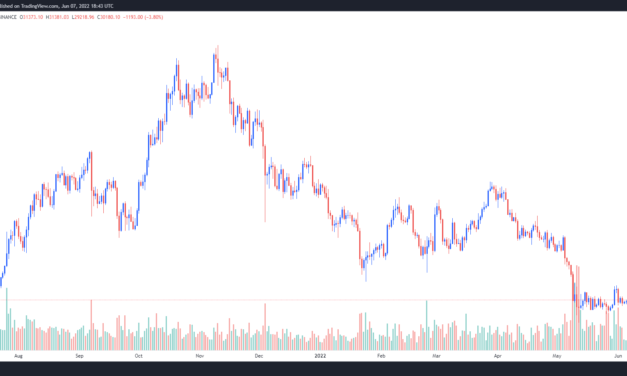
Bitcoin’s (BTC) short-term price action has been dominated by whipsaws that trigger around the $31,000 to $32,000 level and the June 6 reversal at this point triggered a quick sell-off that pushed the price down to $29,200. Surprisingly, on June 7, the price rapidly reversed course as Bitcoin rallied back to $31,500, but given the current rejection at this level, traders are likely to proceed cautiously, rather than expect a quick surge to $35,000.BTC/USDT 1-day chart. Source: TradingViewHere’s what several analysts are saying about the short-term outlook for BTC and what support levels to keep an eye on moving forward. A clear redistribution rangeThe range-bound trading currently impacting Bitcoin was addressed by crypto analyst and pseudonymous Twitter user il Capo of Crypto, who posted the following chart highlighting the “clean range” that BTC has been stuck in for nearly a month. BTC/USD 4-hour chart. Source: TwitterThe analyst said, “What is happening inside the range and what has happened at the range high, shows that this is [a] clear redistribution range. Clean break of the range low = last leg down confirmed = 21K–23K.”Ongoing flip-flop price actionA slightly different outcome to the current market chop was suggested by crypto trader and pseudonymous Twitter user Phoenix, who posted the following chart lamenting the month-long range-bound trading for BTC and hinted that it will see more of the same. BTC/USD 2-hour chart. Source: TwitterPhoenix said, “On our way towards a whole month inside a mini-range again to fully deploy the flip-flop-your-bias-non-stop-angry-pleb-and-gtfo. *Ppl fomoed the top, lows taken again after the nuke, up we go again?*”Related: Coinbase balance drops by 30K BTC as Bitcoin price nurses 6% lossesA possible flush out to $20KFor traders trying to get some sense of where the bottom might be, market analyst and pseudonymous Twitter user Rekt Capital posted the following chart highlighting the 200-EMA (exponential moving average) as a key indicator to watch. BTC/USD 1-week chart. Source: TwitterAccording to Rekt Capital, the price history for Bitcoin shows that while it “tends to confirm uptrends when it breaks above the blue 50-week EMA,” on the flip side it “tends to confirm maximum financial opportunity when it reaches and breaks down from the black 200-week EMA.”A closer look at the recent price action around these indicators was provided in the following chart posted by Rekt Capital to provide a better picture of what support level to look out for. BTC/USD 1-week chart. Source: TwitterRekt Capital said, “This area is ~confluent with the orange #BTC 200-week MA. In fact $BTC would need to downside wick below the 200MA to reach the ~$20K area. Interestingly, downside wicking tends to occur below the 200MA to mark out generational bottoms.”The overall cryptocurrency market cap now stands at $1.24 trillion and Bitcoin’s dominance rate is 46.4%.The views and opinions expressed here are solely those of the author and do not necessarily reflect the views of Cointelegraph.com. Every investment and trading move involves risk, you should conduct your own research when making a decision.
Čítaj viac

