Značka: Ethereum Analysis

Ethereum plunges 13%, down more than Bitcoin after Fed spooks crypto market

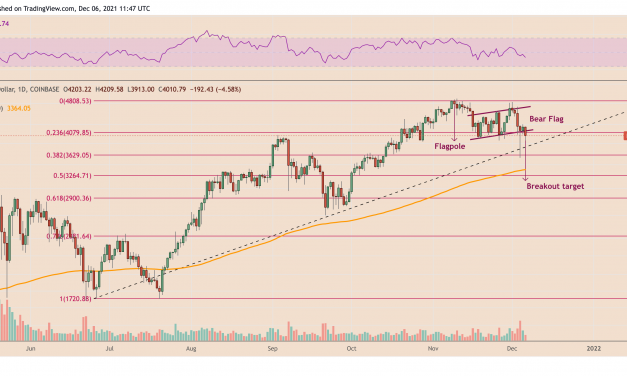
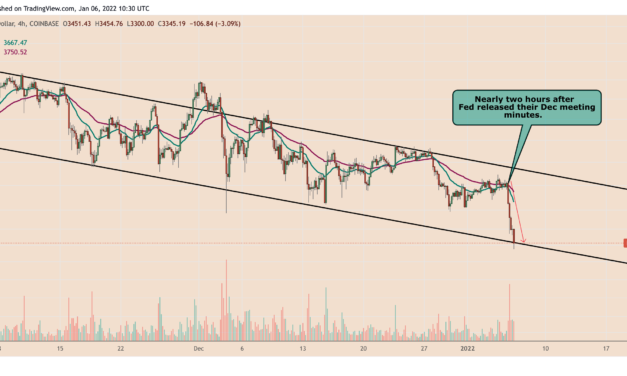
Ethereum’s native token Ether (ETH) plunged sharply hours after the U.S. Federal Reserve released the minutes of their December meeting, showing that they eye a faster timetable for hiking interest rates in 2022.The minutes showed that the Federal Open Market Committee (FOMC) is in favor of raising short-term rates “sooner or at a faster pace than participants had earlier anticipated.” According to the CME Group, trading in the interest-rate futures market showed a two-thirds possibility of the first increase in March.Ether turned lower after the minutes were released, dropping by over 13.50% to as low as $3,300. Its plunge mirrored similar downside moves across the crypto market, with Bitcoin (BTC) shedding a little over 9% to nearly $42,100.ETH/USD four-hour price chart. Source: TradingViewIncontestably, ETH/USD returned more losses to its investors than BTC/USD after the Fed’s spook. It appears traders decided to unwind tokens sitting atop better long-term profits than Bitcoin. For instance, Ether’s returns in the last 12 months — even after the Fed-led drop — came out to be around 175%. On the other hand, Bitcoin’s profits were nearly 15.75% in the same period.Performance of top fifteen cryptocurrencies. Source: MessariSimilarly, Ethereum’s top rival Solana (SOL) also logged more losses than Bitcoin, dipping by more than 13.75% after the Fed news. Nonetheless, its 12-month profits came out to be more than 7,500%, signaling further extreme corrections if the crypto market’s bias remains skewed toward the bears.ETH/BTC reaches key rebound levelEther also plunged against Bitcoin, according to the performance of a widely-traded instrument, ETH/BTC, in the past 24 hours.The pair dropped by a little over 5% to hit 0.077 BTC. In doing so, it also reached a critical support level near 0.078 BTC that has recently been instrumental in keeping Ether bullish against Bitcoin by limiting the former’s downside bias.ETH/BTC daily price chart showing its key support level. Source: TradingViewMeanwhile, the 0.078 BTC-support also appeared to be the lower trendline of Ether’s descending triangle. Descending triangles are continuation patterns that typically send the price in the direction of its previous trend after a consolidation period.That increases Ether’s potential to remain stronger than Bitcoin in the long run, as long as it breaks above the triangle’s upper trendline with convincingly higher volumes.Too soon to fear the FedFor months, Fed officials were stuck to the opinion that higher inflation in the U.S. drew its inspiration from supply-chain bottlenecks, with chairman Jerome Powell asserting that it would resolve by itself. But in the latest meeting, he showed less conviction toward the so-called “inflation-is-transitory” narrative.That is primarily because the U.S. consumer price index (CPI) reached a nearly 40-year high in November 2021, hitting 6.8% year-over-year. Meanwhile, core consumer prices, which exclude energy and food categories, rose to 4.7% from a year earlier; it came to be above the Fed’s preferred inflation target of 2%.”There’s a real risk now, I believe, that inflation may be more persistent and…the risk of higher inflation becoming entrenched has increased,” said Powell on Dec. 15 last year after concluding the FOMC meeting.U.S headline inflation over the years. Source: Bloomberg, Bureau of Labor StatisticsMadison Faller, a global strategist at JPMorgan Private Bank, told Bloomberg that investors should not fear the Fed, noting that their three planned rate cuts in 2022 would do little in curbing down consumer prices. Excerpts from her statement:“Growth and inflation will be decelerating throughout 2022, but nonetheless remain above historic trend levels. We think this will call for a much lower risk of a Fed-induced material market correction.”As Cointelegraph also covered, fears of persistently higher inflation, which, in turn, tends to devalue cash, have prompted mainstream investors to park their money in the crypto sector. For instance, Thomas Peterffy, the billionaire founder of brokerage firm Interactive Brokers Group Inc., admitted that he holds 2-3% of his net assets in crypto just in case the fiat money “goes to hell.” Likewise, Bridgewater Associates founder Ray Dalio revealed last year that his investment portfolio contains Bitcoin.The outlook against inflation promised to offer some respite to Ether, which tends to tail the Bitcoin price movements. Meanwhile, Sean Farrell and Will McEvoy, strategists at Fundstrat Global, noted that investors should increase their investments across the smart contracts sector to get the most from the next market rebound.”Given the current macro backdrop, leverage within the Bitcoin market, and recent robustness seen in the altcoin market, we think it’s appropriate to be overweight Ethereum and other smart contract platforms,” they said in a note, adding:”We probably would not bet the farm near-term on Bitcoin but think there is an opportunity in going long volatility via derivatives strategies.”The views and opinions expressed here are solely those of the author and do not necessarily reflect the views of Cointelegraph.com. Every investment and trading move involves risk, you should conduct your own research when making a decision.

Čítaj viac

Ethereum bulls retain hopes of $10K despite ETH price chart bear flag

Ethereum’s native token Ether (ETH) looks poised to extend its selloff this week as it wobbles near a key support level of $4,000.ETH price dropped by over 5.50% on Dec. 6 to an intraday low at $3,913. In doing so, it slipped through upward sloping support that constituted an Ascending Channel that — more or less — appears like a Bear Flag, a bearish continuation setup.ETH/USD daily price chart featuring Bear Flag setup. Source: TradingViewConservative traders typically spot Bear Flags when an instrument consolidates higher inside a parallel channel after a considerable price drop (called Flagpole). They anticipate the price to break below the Flag’s lower trendline. And when it does, traders set their profit target by measuring the Flagpole’s height and subtracting it from the breakout level.Applying the Bull Flag strategy to Ether’s ongoing price trends, one can expect the cryptocurrency to drop towards $3,200 in the sessions ahead. Interestingly, the level is also near the 0.5 Fib line (~$3,264) of the Fibonacci retracement graph drawn from the $720-swing low to the $4,808-swing high.More confirmation neededWhile the Bear Flag setup hints at more pain for Ether ahead, some analysts believe the Ethereum token still has more room to run to the upside.For instance, PostyXBT, an independent market analyst, asked his massive follower-base on Twitter to turn attention to Ether’s deep price wick from Saturday, underscoring how the cryptocurrency’s sudden crash from near $4,240 to as low as $3,575 (data from Coinbase) was met by traders with an aggressive buying response.”The weekly close above $4k means that ETH is one of the strongest looking coins out there,” the pseudonymous analyst noted, adding that not many held the structure “despite the wick.”ETH/USD weekly perpetual futures contract chart. Source: TradingViewMeanwhile, another popular analyst Crypto FOMO also referred to the Saturday rebound as a reason to stay bullish on Ether. In an analysis published Monday, the analyst said that the cryptocurrency’s ability to hold its rising channel support (the Bear Flag structure) might prompt bulls to push its value to $10,000.”That is also because Ethereum is crashing a lot lesser than other cryptos, which is very bullish,” the channel noted while highlighting Ether’s growing strength against Bitcoin (BTC).Top ten cryptocurrencies’ performance against USD and BTC in the last 30 days. Source: MessariOn its weekly chart, Ether looks to have been eyeing a move toward $6,500 after breaking out of its Ascending Triangle.In detail, the ETH price left the Triangle range in the week ending Oct. 25 after consolidating inside it for a little over four months. Nonetheless, traders returned to test the structure’s upper trendline as support, as is common across bullish continuation setups.ETH/USD weekly price chart featuring Ascending Triangle setup. Source: TradingViewAs long the price holds itself above the Triangle’s upper trendline, its likelihood of continuing its rally upwards remains higher — by as much as the structure’s maximum height, as shown in the chart above. On the other hand, a decisive break below the Triangle’s lower trendline risked invalidating the bullish setup.Strong fundamentalsJames Wo, CEO/Founder of DFG Group — a Singapore-based venture capital firm, blamed Ether’s consistently positive correlation with Bitcoin behind its latest price corrections, noting that a spot market selloff in the BTC market, led by the ongoing Omicron FUD, has had exchanges liquidate $2 billion worth of traders’ margined positions, hurting ETH in tandem.Related: BTC sentiment ‘comparable to a funeral’ — 5 things to watch in Bitcoin this weekBut the analyst, too, anticipated a price rebound for ETH based on its successful adoption across the emerging nonfungible token (NFT), decentralized finance (DeFi), and metaverse space.Top five DeFi chains based on total-volume locked. Source: Defi Llama “The levels of open interest levels seen up to this correction for both BTC and ETH were an important indicator that a bearish scenario was highly probable,” Wo explained, adding:”We still believe that fundamentals are strong and long-term valuations are still very low based on the technological advancements and contributions we are witnessing from this industry.”ETH/USD was trading at $4,050 at the time of this writing.The views and opinions expressed here are solely those of the author and do not necessarily reflect the views of Cointelegraph.com. Every investment and trading move involves risk, you should conduct your own research when making a decision.

Čítaj viac

Ethereum acts as a 'hedge' in Bitcoin price crash as ETH/BTC hits 3-year high

Ethereum’s native token Ether (ETH) plunged alongside other cryptocurrencies on Dec. 4. Still, its move downside did not deter it from hitting a three-year high against Bitcoin (BTC), the world’s leading crypto by market capitalization.The ETH/BTC exchange rate jumped a little over 11.50% to hit 0.0835 BTC for the first time since May 2018. The pair’s price rally appeared in contrast to Ether’s 15% price drop against the U.S. dollar on Saturday, which appeared in the wake of a market-wide selloff that saw Bitcoin plunging by as much as 21% intraday.ETH/USD daily price chart. Source: TradingViewThe ETH vs. BTC “hedge” narrative emergesWhile Ether’s losses were substantial, they were relatively milder compared to Bitcoin in USD terms as the ETH/BTC pair surged to a three-year high. At the same time, some analysts believed that investors started treating the second-largest cryptocurrency as a haven against Bitcoin during the Saturday crash.”It seems that investors are taking ETH as a hedge here,” said Crypto Birb, an independent market analyst in a tweet Saturday, pointing to a four-hour ETH/BTC price chart (as shown below) that showed the pair retracing sharply after testing its 200-period moving average (the orange wave) as support.ETH/BTC four-hour price chart featuring 200-period MA support. Source: TradingViewLukas Enzersdorfer-Konrad, chief product officer at Bitpanda, noted that ETH/BTC’s November close was the best one in the last 45 months, meaning bulls still had “some power left for an additional run.””Ethereum is outperforming Bitcoin by a large margin this year […] It increased its market dominance to 22%. The number of active addresses on the network continues to climb while the net issuance of ETH continues to fall which might be the main reason for its rapid rise.”Technical outlookAs Cointelegraph covered earlier, Ether has shown the prospects of continuing its upward trend due to a technical support pattern, dubbed Ascending Triangle.Related: Ethereum ‘about to go parabolic’ against Bitcoin as analysts weigh BTC bear caseOn Saturday, the ETH/BTC pair broke out of the Ascending Triangle range to the upside, accompanied by a slight increase in its trading volumes. In a “perfect” world, the pair’s move upside should stretch until it hits levels at length equal to the maximum distance between the Triangle’s upper and lower trendlines when measured from the breakout point.In a “perfect” world, the pair’s move upside should stretch until it hits levels at length equal to the maximum distance between the Triangle’s upper and lower trendlines when measured from the breakout point.ETH/BTC weekly price chart featuring Ascending Channel pattern. Source: TradingViewAs shown in the chart above, the Triangle’s upside target, from the breakout point near 0.077 BTC, puts the profit target near 0.1 BTC.The views and opinions expressed here are solely those of the author and do not necessarily reflect the views of Cointelegraph.com. Every investment and trading move involves risk, you should conduct your own research when making a decision.

Čítaj viac

Increased utility in DeFi, NFTs back Ethereum’s 3-year high in its ETH/BTC pair

This week, Ether (ETH) price reached a new 2021 high against Bitcoin (BTC), bringing its year-to-date returns slightly above 350% and according to technical analysis, the rally could extend even further.On Dec. 1, bids for the ETH/BTC pair hit 0.0835 BTC on Coinbase for the first time this year. The upside move came as a part of an uptrend that started mid-October after Ether bottomed out against Bitcoin at 0.0630 BTC to carve out almost 41% price retracement.ETH/BTC daily price chart. Source: TradingViewGrowing adoption propels Ether’s boomThe ETH/BTC price rally reflect deep interest in Ethereum, which is currently the world’s leading smart contract platform by users and market capitalization. This is slightly different than the scenario for Bitcoin, which typically functions as a speculative hedge against inflation across global economies.As of late, Ethereum has been become a core asset within crypto growth sectors like nonfungible tokens (NFT), decentralized finance (DeFi) and the Metaverse. The firms operating in this space require Ether to run their smart contracts, which in turn, has increased demand for the altcoin and supported a steady uptrend in its price.Total valued locked inside ETH-based DeFi platforms (including staking). Source: Defi LlamaDemand for Eth is expected to remain robust in the coming year and this simple fact has many analysts projecting prices within the $6,000 to $10,000 range. ETH/USD daily price chart. Source: TradingViewMatt Maley, the chief market strategist for Miller Tabak + Co., anticipated additional gains for Ether should it break above its mid-November high around $4,900. According to Maley, Bitcoin bulls remain under pressure near the cryptocurrency’s mid-November and mid-April highs of $69,000 to $65,000. If Ether manages to hit and hold a new all-time high while BTC trades in a downtrend, Maley said: “It will show that Ether has become the new crypto of choice for most investors.”The technical outlook for Ether against Bitcoin has also been suggesting stronger bull runs for the former in the future.Related: Ethereum approaches a new ATH, but derivatives data reflects mixed emotionsA prolonged bullish breakout could be in playThe latest bout of buying has had ETH/BTC break above a multi-month resistance trendline that constitutes an ascending triangle pattern and now the pair eyes an extended bull run towards 0.1 BTC, as shown in the chart below.ETH/BTC weekly price chart featuring Ascending Triangle setup. Source: TradingViewTypically, ascending triangles are continuation patterns, meaning, they tend to send the price in the direction of its previous trend by as much as the maximum height between the upper and lower trendline when measured from the breakout point.ETH/BTC’s breakout point comes out to be near 0.077 BTC while its triangle’s maximum height is 0.022 BTC. In a “perfect” world, this would place the ETH/BTC pair on path to 0.1 BTC, but given the volatile nature of the cryptocurrency sector, anything is possible. The views and opinions expressed here are solely those of the author and do not necessarily reflect the views of Cointelegraph.com. Every investment and trading move involves risk, you should conduct your own research when making a decision.

Čítaj viac
Načítava

Získaj BONUS 8 € v Bitcoinoch

nakup bitcoin z karty

Registrácia Binance

Burza Binance

Aktuálne kurzy