Fidelity renews push for spot Wise Origin BTC Trust, making it 7th applicant this year
The huge asset manager was denied approval for the Wise Origin Trust last year; now, it is joining a long line of spot fund hopefuls.
Čítaj viac
The huge asset manager was denied approval for the Wise Origin Trust last year; now, it is joining a long line of spot fund hopefuls.
Čítaj viac
Australian crypto exchanges report no problems with their payment providers, but the lack of local laws means more debanking incidents can’t be ruled out.
Čítaj viac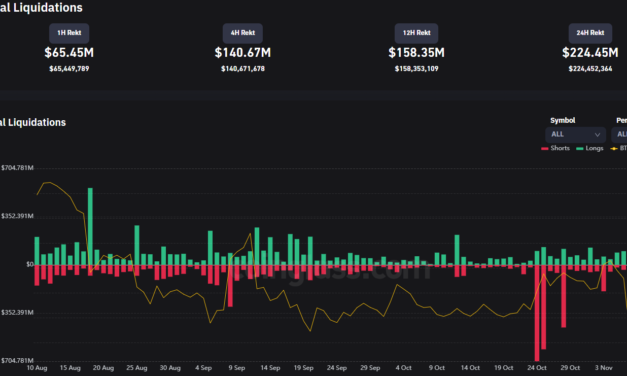
After topping the $21,500 mark on Nov. 4, Bitcoin (BTC) price is down by 14% on Nov. 8, reaching a new yearly low at $17,166 and most altcoins are following suit. While the Binance and FTX news initially caused an uptick in the market, the day turned south as various unconfirmed sources speculate that FTX’s losses could show a $6 billion deficit. This price decline breaks Bitcoin’s short-term correlation to the stock market, with the tech-heavy Nasdaq down only 0.32%, while the Dow Jones gained 0.48% on the back of investors’ optimism about the Nov. 8 U.S. Midterm elections. In the backdrop of the current volatility, $614 million in BTC longs are at risk of liquidation with over $224 million liquidated on Nov. 8. The fear for many is if the FTX situation is not resolved by Binance’s bid to purchase the exchange, a sharper sell-off in the market could trigger a liquidation cascade and send BTC price to new lows.BTC long versus short and liquidations. CoinglassLet’s investigate the main reasons why the Bitcoin price is down today. FTX capitulates after investors’ fears of a bank run sap its liquidityBitcoin price is reacting to the stress placed on the market by the FTX, reaching a yearly low after a period where many thought the bear market bottom had been found.The May 2022, Terra Luna implosion and ultimate collapse of LUNA Classic produced the first 7-week losing streak in Bitcoin’s history. The market is drawing parallels between the current FTX bank run, the perceived large budget hole and what happened to Terra Luna earlier this year.Rising interest rates in the US and abroad weigh on Bitcoin priceBased on the Consumer Price Index Report, inflation in the United States increased by 0.6% in September compared to the previous month. The Consumer Price Index report – the most widely followed barometer of inflationary pressure in the United States – climbed 8.2% in September compared to the same month a year ago, slightly more than the 8.1% predicted by experts. With the upcoming CPI reporting event on Nov. 10, Bitcoin saw a volatile 12% decline in 24 hours hitting record lows for 2022. Bitcoin price index. Source: CointelegraphSuppressed retail and institutional inflowWhile the number of consumers investing in crypto increased dramatically in 2021, prices are heavily affected by retail traders looking to make money on those shifts. And since June, Bitcoin has been flat, stuck largely in the $18,000 to $21,000 range after dropping from its November 2021 all-time high near $68,000. Going below the all year low may not instantly provoke investor interest. According to independent market analyst Jaran Mellerud, Bitcoin’s on-chain activity has been down for the whole year. Coinbase’s second-quarter trading volumes fell by around half to $217 billion. Between mid-June and mid-July, Binance reported a 50% drop in volume, while Kraken and Gemini saw 75% and 80% drops respectively. Binance US was one significant exception, reporting a 2% reduction after halting Bitcoin trading fees in June. FTX has witnessed a run on the bank, seeing a net outflow of $1.1 billion in the first week of November. FTX outflow chart. Source: DuneAnalyticsRelated: Why is the crypto market down today?Is there a chance for Bitcoin price to reverse course? The short-term uncertainties in cryptocurrencies do not appear to have changed institutional investors’ long-term outlook. According to BNY Mellon CEO Robin Vince, a poll commissioned by the bank found that 91% of institutional investors were interested in investing in tokenized assets in the following years. Around 40% of them already have cryptocurrency in their portfolios and approximately 75% are actively investing in digital assets or considering doing so.Worries about FTX’s potential insolvency are clearly instrumental in Bitcoin price sweeping a new yearly low. In the long term market participants still expect the price of Bitcoin to go up, especially as more banks and financial institutions are seemingly turning to digital cash for settlement purposes. The views and opinions expressed here are solely those of the author and do not necessarily reflect the views of Cointelegraph.com. Every investment and trading move involves risk, you should conduct your own research when making a decision.
Čítaj viac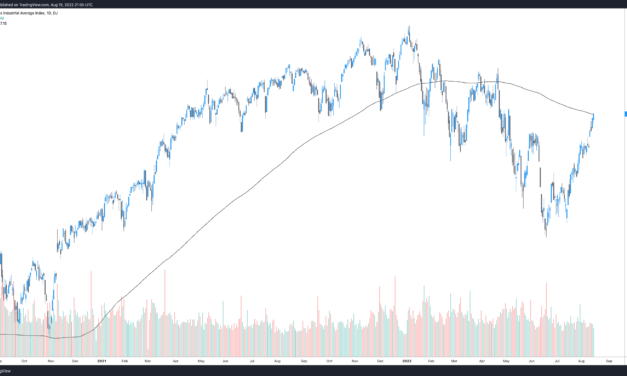
On Aug. 15, Bitcoin (BTC) price and the wider market corrected while the S&P 500 and DOW looked to build on four-straight weeks of robust gains. Data from TradingView and CNBC show the Dow pushing through its 200-day moving average, a first since April 21 and perhaps a sign for bulls that the market has bottomed. Dow Jones Industrial Average Index (DJI). Source: TradingViewWhile equities markets have been strikingly bullish in the face of high inflation and a steady schedule of interest rate hikes, a number of traders fear that the current 32-day uptrend in the DOW and S&P 500 could be a bear market rally. This week’s (Aug. 17) release of minutes from the Federal Open Markets Committee (FOMC) should give more context to the Federal Reserve’s current view of the health of the United States economy and perhaps shed light on the size of the next interest rate hike. For the past month, overly bullish crypto traders on Twitter have also been touting a narrative that emphasizes Bitcoin, Ether (ETH) and altcoins selling off prior to FOMC meetings and then rallying afterward if the set rate aligns with investors’ projected figure. Somehow, this short-term dynamic also contributes to investors’ belief that the Fed will “pivot” away from its monetary policy of interest hikes and quantitative tightening after “inflation peaks.” This may be a somewhat profitable trade for savvy day-traders, but it’s important to note that inflation is currently at 8.5% and the Fed’s target is 2%, which is quite aways to go.Ultimately, Bitcoin price maintains a high correlation to the S&P 500 so investors would be wise to avoid tunnel vision-like narratives that align with their bias and keep an eye on the performance of equities markets. Bitcoin sells-off at a multi-month trendline resistanceOver the weekend, Bitcoin made a strong move at a multi-month descending trendline and broke through the $24,000 level, following a path that many traders anticipated would trigger an upside move and the VPVR gap fill to the $28,000 to $29,000 level. $BTC really looked like it was going to go last night – and now we have 2x outside brewing pic.twitter.com/gkyLodiXi6— Cheds (@BigCheds) August 15, 2022Trader Cheds said “BTC really looked like it was going to go last night” but the selling at resistance created an “outside bar” where “the prior trend was challenged” and according to Cheds, this is a sign that “the trend may be stalling and be on the look out for signs of further weakening.” Bitcoin’s Bollinger Bands are also constricted, a sign that a directional move is imminent but we’ve already seen expansion into the top band at the $25.6K trendline resistance. Is a $22.4K retest next before $BTC attempts to grind higher? Few have mentioned the falling wedge… pic.twitter.com/wi1VpGt2y7— Big Smokey (@big_smokey1) August 15, 2022
Pseudonymous trader “Big Smokey” appeared to concur that a “strong directional move” could be on the cards, citing tightening in the Bollinger Bands and separately in the Super Guppy indicators as Bitcoin price drew close to the multi-month descending trendline. There are some signs that a strong directional move is on the cards for Bitcoin: Super Guppy is getting real tight, possibly provoking a 26% pop to $28K before more sideways chop or downside to grab what will be new liquidity at the $24K s/r re-test by then… pic.twitter.com/1VgAkjj10o— Big Smokey (@big_smokey1) August 15, 2022
In a separate chart, Big Smokey suggested that if the descending trendline is broken, Bitcoin could see “a 26% pop to $28K before more sideways chop,” resulting in an eventual retest of the $24,000 level. After hitting similar overhead resistance levels, most altcoins also followed Bitcoin’s lead by posting single-digit losses, but those that were flashing bottoming signals are still rounding out with what appear to be reversal patterns. AVAX, FTM and SOL daily chart. Source: TradingViewRelated: Shiba Inu eyes 50% rally as SHIB price enters ‘cup-and-handle’ breakout modeEvery dog has its dayInterestingly, on Sunday (Aug. 14) popular traders on Crypto Twitter prophesied that the sharp gains from meme tokens like Shiba Inu (SHIB) and Dogecoin (DOGE) were a clear sign that the bull phase was over-extended and en route to a correction. Pulled this from the archives. One year apart, same sector, different breed.Time is a flat circle. pic.twitter.com/QplWWT43R5— Hsaka (@HsakaTrades) August 14, 2022
Ultimately, after a 130% and 42.5% rally from Ether and BTC, each was poised for a bit of profit taking, especially at resistance. Open Interest on both assets remains near all-time highs, but what it will take to trigger BTC to breakout or breakdown at the multi-month descending trendline is unknown. Perhaps a 1% rate hike, stiffer crypto regulations or a surprise turn-around in equities markets could send price tumbling back toward yearly lows. Alternatively, a successful Ethereum Merge could be a positive catalyst that triggers a high volume surge above Bitcoin’s key resistance level.The views and opinions expressed here are solely those of the author and do not necessarily reflect the views of Cointelegraph.com. Every investment and trading move involves risk, you should conduct your own research when making a decision.
Čítaj viac
Bitcoin mining involves a delicate balance between multiple moving parts. Miners already have to face capital and operational costs, unexpected repairs, product shipping delays and unexpected regulation that can vary from country to country — and in the case of the United States, from state to state. On top of that, they also had to contend with Bitcoin’s precipitous drop from $69,000 to $17,600. Despite BTC price being 65% down from its all-time high, the general consensus among miners is to keep calm and carry on by just stacking sats, but that doesn’t mean the market has reached a bottom just yet. In an exclusive Bitcoin miners panel hosted by Cointelegraph, Luxor CEO Nick Hansen said, “There’s going to definitely be a capital crunch in publicly listed companies or at least not even just publicly listed companies. There’s probably close to $4 billion worth of new ASICs that need to be paid for as they come out, and that capital is no longer available.”Hansen elaborated with: “Hedge funds blow up very quickly. I think miners are going to take 3 to 6 months to blow up. So we’ll see who’s got good operations and who’s able to survive this low margin environment.” When asked about future challenges and expectations for the Bitcoin mining industry, PRTI Inc. advisor Magdalena Gronowska said, “One of the biggest challenges that we’ve had in this transition to a low-carbon economy and reducing GHG emissions has been an underinvestment in technology and infrastructure by the public and private sectors. What I think is really amazing about Bitcoin mining is that it’s really presenting a completely novel way to fund or subsidize that development of energy or waste management infrastructure. And that’s a way that’s beyond those traditional taxpayer or electricity ratepayer pathways because this way is based on a purely elegant system of economic incentives.”Will Bitcoin destroy the environment?As the panel discussion shifted to the environmental impact of BTC mining and the widely held assumption that Bitcoin’s energy consumption is a threat to the planet, Blockware Solutions analyst Joe Burnett said: “I think Bitcoin mining is just not bad for the environment, period, I think if anything, it incentivizes more energy production, it improves grid reliability, and resilience and I think it will likely lower retail electricity rates in the long term.” According to Burnett, “Bitcoin mining is a bounty to produce cheap energy, and this is good for all of humanity.” Related: Texas a Bitcoin ‘hot spot’ even as heat waves affect crypto minersWill industrial Bitcoin mining catalyze the long-awaited “mass adoption” of crypto? Regarding Bitcoin mining dominance, the future of the industry and whether or not the growth of industrial mining could eventually lead to crypto mass adoption, Hashworks CEO Todd Esse said, “I believe that most of the mining down the road will be held in the Middle East and North America, and to some extent Asia. Depending upon how much they are eventually able to cut off. And that really speaks to the availability of natural resources and the cost of power.”While it is easy to assume that growing synergy between big energy companies and Bitcoin mining would add validity to BTC as an investment asset and possibly facilitate its mass adoption, Hansen disagreed. Hansen said: “No, certainly not, but it is going to be the thing that transforms everyone’s life whether they know it or not. By being that buyer of last resort and buyer of first resort for energy. It’s going to transform energy, energy markets and the way it is produced and consumed here in the US. And overall, it should significantly improve the human condition over time. Don’t miss the full interview on our YouTube channel and don’t forget to subscribe!Disclaimer. Cointelegraph does not endorse any content of product on this page. While we aim at providing you all important information that we could obtain, readers should do their own research before taking any actions related to the company and carry full responsibility for their decisions, nor this article can be considered as an investment advice.
Čítaj viac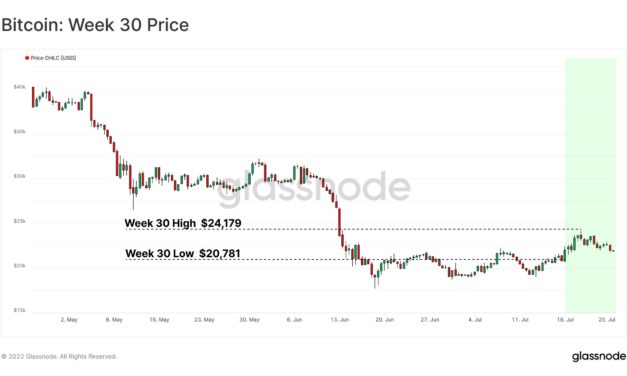
On July 26, Bitcoin (BTC) price dropped below $21,000, giving back the majority of the gains accrued in the previous week and returning to the $23,300 to $18,500 range that Glassnode analysts describe as “the Week 30 high and Week 30 low.” A handful of analysts and traders attribute the July 26 to July 27 Federal Open Market Committee (FOMC) meeting and the expected Federal Reserve rate hike as the primary reasons for the current sell-off. Barring the announcement that the United States economy has entered a recession, a few traders believe that the expected 75 to 100 basis point (BPS) hike will be followed by a relief rally that could see BTC, Ether and other large-cap altcoins snack back to the top of their current range. Of course, this sentiment reflects more speculation than sound analysis, so take it with a grain of salt. Bitcoin week 30 price range. Source: GlassnodeGiven that BTC price is simply continuing to trade in the same range that it has been in for the past 42 days, the real question is whether the market will bring more consolidation or another round of capitulation. In its July 26 on-chain newsletter, Glassnode analysts posit that investors can find their “conviction through confluence” of multiple technical and on-chain metrics which suggest the peak of capitulation has long past. According to the analysts, rapid deleveraging threw many metrics into “extreme statistical deviations” and with the worst of the selling possibly behind us, Bitcoin price returning to the high $20,000 zone was expected. Glassnode notes that the: “The June leg down in price action has produced the lowest 4-yr rolling Z-Score value on record.” And the analysts explained that the 4-year rolling MVRV Z-score “signaled undervaluation for all bear cycle bottoms, including 2015, 2018, and the March 2020 flash crash.” Bitcoin MVRV Z-Score 4 year Rolling chart. Source: GlassnodeWhen compared against various cohorts of long and short-term sellers, and metrics like Realised Price, Mayer Multiple and longer-term daily and weekly moving averages, Glassnode suggests that confluence in the indicators and historical data point to growing bullish momentum. On-chain data spots a bottom, but what does technical analysis say? From the perspective of technical analysis, Bitcoin’s move to $24,200 presented a brief breakout from the current range, but the inability to sustain momentum at this level presented the necessary alternative of a lower support retest at the range midline near the 20-day moving average ($21,500). According to independent market analyst Michaël van de Poppe, $21,600 was the area for BTC to hold and below this the asset’s price action is dependent upon commentary from this week’s FOMC comments. The markets are correcting and preferred was $21.6K to hold for #Bitcoin.That’s a crucial breaker now too if it breaks to the upside – > new highs.Looking at a $20.5K-20.7K area to hold for #Bitcoin going into FOMC tomorrow.If upwards after. pic.twitter.com/tueXPNprza— Michaël van de Poppe (@CryptoMichNL) July 26, 2022CryptoISO expressed a similar sentiment regarding the correlation of equities to Bitcoin and the importance of the $21,500 zone for BTC price.Part of longing the 21.5k zone on BTC was confluence w support on NQ.That is gone.Retesting a breakout now but all this looks like crap to be honest.Selling before tomorrow is interesting though.If you are bullish you want to see that but earnings is driving it so far. pic.twitter.com/rh5d3wKgjG— CryptoISO (@crypto_iso) July 26, 2022
Fractal lovers will note that the price action within the current range is eerily similar to the May 8 through July 12 range-bound trading and following breakdown that took place on July 12, but analysts would quickly point out that back-to-back calamities like Voyager, Celsius and 3AC blowing up played a significant role in that sell-off, whereas now there appears to be no discernible black swan events on the horizon. BTC/USDT daily chart. Source: TradingviewRegardless, both reflect periods of 34 to 42 days of sideways trading and on many occasions, veteran trader Peter Brandt has identified the current market structure as a “bearish rectangle” technical analysis pattern. Bearish rectangle breakdown. Source: MoneyControl.comIn the event that the pattern breaks to the downside from the current range, this would place the price in the $14,500 to $13,000 zone some traders have been lusting for.BTC/USDT daily chart. Source: TradingviewUltimately, last week’s range breakout to $24,200 (July 20) pierced the upper band of the Bollinger Bands momentum indicator and now that price is below the midline, there is an increased chance that BTC could trade down to the lower band which conveniently resides at the bottom of the current range ($24,200 to $18,600). Trading within range is not much to worry about until a breakout or breakdown catalyst emerges. Perhaps tomorrow’s (July 27) earnings from big tech companies, the state of the market at the opening bell and comments from the FOMC will determine the direction Bitcoin decides to take. The views and opinions expressed here are solely those of the author and do not necessarily reflect the views of Cointelegraph.com. Every investment and trading move involves risk, you should conduct your own research when making a decision.
Čítaj viac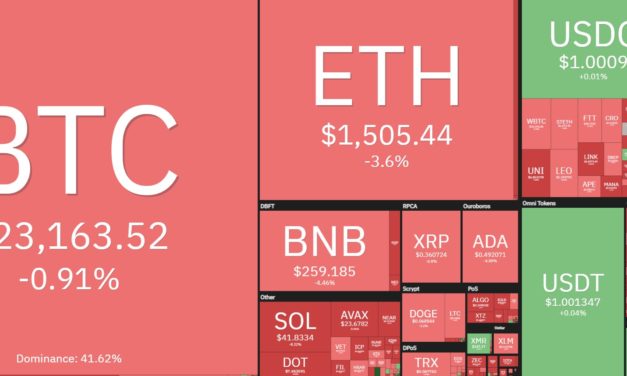
Easy come, easy go was the story on July 20 as the day started on a positive note with Bitcoin (BTC) climbing above $24,300, only to end the official trading day in the red after less than stellar Q2 earning news showed Tesla sold 75% of its Bitcoin and Minecraft reversed course by deciding to ban NFTs on its platform.Daily cryptocurrency market performance. Source: Coin360A potential source of the afternoon downturn can be traced to Tesla’s Q2 earnings data, which showed that the electric car company sold off 75% of its Bitcoin holdings in order to add $963 million in cash to its balance sheet. So, not only forced selling from 3AC, $LUNA & $UST, but also Voyager, BlockFi and Celsius have been causing the markets to crash.On top of that, Tesla did sell 75% of their #Bitcoin purchases towards cash. That’s what caused the crash.That’s also why we’re close to bottom.— Michaël van de Poppe (@CryptoMichNL) July 20, 2022Shortly after the Tesla news broke, Bitcoin price pulled back from its daily high at $24,280 to $22,900 before stabilizing around $23,500.Related: Bitcoin price hits $24K, but analysts say on-chain data points to an ‘inevitable’ pullbackTraders bullish estimates may have been prematureToday’s unexpected pullback may have also helped to bring a little bear market perspective to crypto traders who were ready to call for an end to the bear market. Lots of you guys haven’t gone through the early months of a bear market and it shows. You get excited over dead cat bounces and bull traps, act as if a quick pump is the end of the bear cycle. Sadly, there is only one way to learn.— Vlad “BTCTKVR.com” Costea ⚡️ (@TheVladCostea) July 19, 2022
While the pullback for Bitcoin has thus far been relatively mild, multiple altcoins experienced steeper declines as recent price runups created a nice opportunity for traders to book some gains. The Ethereum (ETH) layer-two solution Polygon (MATIC) has saw an 11.5% following a week in which the token increased by 87%. Arweave (AR) saw its token price tumble by 10.84% and Filecoin (FIL) experienced a pullback of 10.2%.On the flip side, the only tokens in the top 100 that have managed hold onto positive gains for the day are Steem (STEEM) and Reef (REEF), which recorded slight gains of 6.27% and 3.15% respectively. The overall cryptocurrency market cap now stands at $1.035 trillion and Bitcoin’s dominance rate is 42.7%.The views and opinions expressed here are solely those of the author and do not necessarily reflect the views of Cointelegraph.com. Every investment and trading move involves risk, you should conduct your own research when making a decision.
Čítaj viac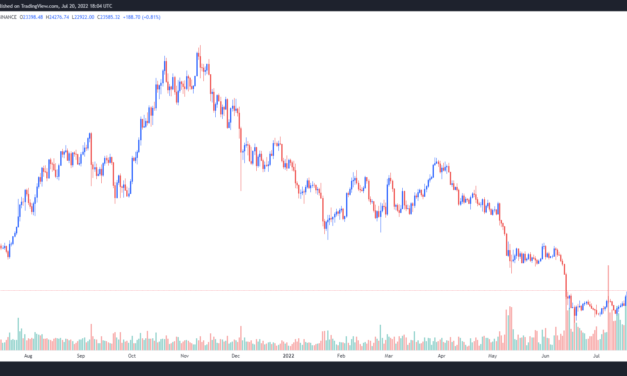
Cryptocurrency investors continue to enjoy this week’s bullish price action after Bitcoin (BTC), Ether (ETH) and a handful of altcoins rallied on July 20 alongside gains in the traditional markets. Data from Cointelegraph Markets Pro and TradingView shows that a midday rally by Bitcoin bulls managed to lift the top crypto to a daily high of $24,281, which sparked a new round of bullish proclamations on Crypto Twitter. BTC/USDT 1-day chart. Source: TradingViewWhile the week-long climb has helped boost investor sentiment, several analysts are warning traders to not get too far ahead of themselves because the market is still providing some red flags worth taking note of. Prepare for an inevitable pullbackBitcoin’s climb above $24,000 officially confirmed a breakout from the previous trading range between $18,000 and $22,500, according to market analyst Caleb Franzen, who posted the following chart noting the question the market now faces. BTC/USD 1-day chart. Source: TwitterFranzen said, “Regardless, my belief is that the next pullback will be a major test within this bear market. Will buyers step in aggressively on a pullback or capitulate?Whale wallets remain dormantOne reason to be wary of the current rally’s ability to sustain itself is the lack of whale wallet activity, according to on-chain research firm Jarvis Labs. Bitcoin divergence chart. Source: Jarvis LabsThe red and orange dots on the BTC divergence chart above represent buying activity by large and small whale wallets at different points in time. As shown in the red highlighted box, activity from whales has been almost non-existent over the past few months as Bitcoin trended down. Data from Jarvis Labs also showed that larger entities have yet to return to active buying, and the chart below shows the change in BTC whale holdings. BTC whale holding change. Source: Jarvis LabsJarvis Labs said, “We want to see this pattern of colored dots begin moving up and to the right. If we get it, then that’ll be a positive sign that any rally could have significant momentum behind it.”Based on the trends identified, Jarvis Labs stated that “it is hard to get too excited about a rally extending beyond the liquidity that sits around $28,000,” and instead suggested that “For now, the lower band at $25K seems most likely.”Related: Bitcoin may hit $120K in 2023, says trader as BTC price gains 25% in a weekThe high time frame trend remains bearishThe turnaround in sentiment over the past week was acknowledged by market analyst and swing trader il Capo of Crypto, who noted that the “Low timeframe trend is bullish, no doubt about it.”But before jumping all in on this rally, il Capo of Crypto also posted the following chart warning that the “high timeframe trend is still bearish and this is another lower high.” BTC/USD 12-hour chart. Source: TwitterIl Capo of Crypto said, “Ltf [low time frame] bearish confirmation is below $22K. Main target remains $15.8K-$16.2K.”The overall cryptocurrency market cap now stands at $1.062 trillion and Bitcoin’s dominance rate is 42.7%.The views and opinions expressed here are solely those of the author and do not necessarily reflect the views of Cointelegraph.com. Every investment and trading move involves risk, you should conduct your own research when making a decision.
Čítaj viac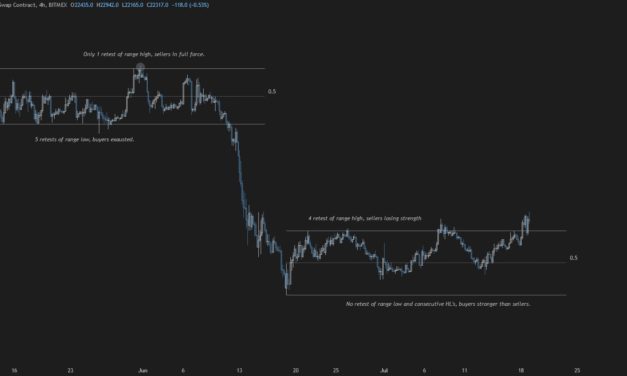
Similar to Stockholm syndrome where captives develop a psychological bond with their captors, crypto winters have a way of flipping even the most bullish cryptocurrency supporters bearish in a short period of time.Evidence of this reality was on full display on July 19 after the recovery of Bitcoin (BTC) back above $23,000 was met with widespread warnings that the move was merely a fakeout before the market heads for new lows $BTCNot bad. But keep in mind that this still can turn into a classical fake out.My general thesis still remains, bear market rally pic.twitter.com/VxnH4mo6hW— Jimie (@Your_NLP_Coach) July 19, 2022While the possibility of new lows being set in the future can’t be ruled out, here’s a look at analysts’ opinions on how this BTC breakout could be different than most investors expect.This time “it’s different”The pointed message of “this time is different” was offered by pseudonymous Twitter user Trader XM, who posted the following chart outlining why BTC is poised to head higher. BTC/USD 4-hour chart. Source: TwitterAs highlighted on the chart above, BTC price did not retest of the range low even as four retests of the range high took place, and this suggests that buyers are now stronger than sellers. In response to the post from Trader XM, Twitter user Justiinape replied “$27K-$28K seems imminent.” Trader XM said, “Agree my man, move to $27-28K then months of consolidation. Let’s enjoy this move before the long hibernation.”The next major resistance is at $27,100Further evidence that BTC could head higher was supplied by the on-chain data firm Whalemap, which posted the following chart highlighting the lack of buying demand between $23,000 and $27,000. Bitcoin volume profile. Source: TwitterWhalemap said, “$27,100 should be the first resistance on our way up. Big gap in supply between current prices and $27K.”Related: Bitcoin price moves toward $24K and traders expect further upside, after a support retestShorts get REKTProof that crypto traders had been lulled into an overly bearish outlook was provided by cryptocurrency analyst Dylan LeClair, who posted the following chart showing the effect that Bitcoin’s move above $23,000 had on the futures traders. BTC/USD 2-hour chart. Source: TwitterAs highlighted on the chart, there was a large amount of Bitcoin short positions opened between June 15 and July 15 and these traders now find themselves on the losing side of the trade. LeClair said,“Tens of thousands worth of BTC short open interest currently underwater.” While Bitcoin reversing course and heading lower once again remains a possibility, the current momentum suggests further upside in the short term.The overall cryptocurrency market cap now stands at $1.055 trillion and Bitcoin’s dominance rate is 42.1%.The views and opinions expressed here are solely those of the author and do not necessarily reflect the views of Cointelegraph.com. Every investment and trading move involves risk, you should conduct your own research when making a decision.
Čítaj viac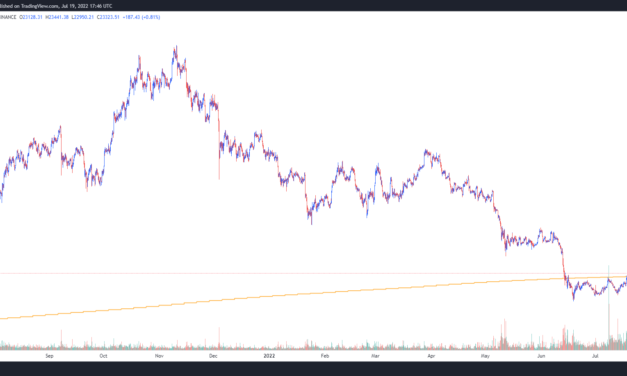
Crypto fans are rejoicing at the sight of green across the market on July 19 as the months of “down only” price action has finally come to an end after the market flashed its first substantial relief rally in at least a month. Data from Cointelegraph Markets Pro and TradingView shows that much of the newfound excitement is the result of Bitcoin (BTC) breaking above resistance at $23,000 to hit a daily high of $23,447, its first meaningful move above the 200-week moving average. BTC/USDT 1-day chart. Source: TradingViewWhile many have been quick predict a climb to the mid-$30,000 range, a few analysts caution that it could be another fakeout pump. Let’s take a look at traders’ perspectives on Bitcoin’s move toward $33,000.Bitcoin needs a weekly candle close above $22,800The move back above the 200-week MA has been a point of focus for cryptocurrency analyst Rekt Capital, who posted the following chart commenting that “For the first time in weeks, BTC is putting in a decent effort to try to reclaim the 200-week MA as support.”BTC/USD 1-week chart. Source: TwitterThe 200-week MA has been a highly watched metric in recent weeks because it has served as a reliable bear market indicator that has historically provided insight into when a bottom has been set. Rekt Capital said,“#BTC needs to Weekly Candle Close above $22800 to successfully confirm a reclaim of the 200-week MA as support.”There’s still room for a pullback to $18,000Further insight into what would need to happen to confirm a bullish perspective on the gains seen on July 19 was offered by Phoneix ICF, who provided the following chart highlighting the next major level of resistance to keep an eye on. BTC/USDT 1-day chart. Source: TwitterPhoenix ICF said, “Wait for the 1d candle to close above $23K and then place long bets. If that’s not the case, we’ll see it below $18K soon. Be patient & avoid emotional trading.”Related: Technicals suggest Bitcoin is still far from ideal for daily paymentsTraders expect resistance at $28,400The importance of the current price level was further explored by technical analyst Crypto Patel, who posted the following chart outlining the possible paths that BTC could take in the event of a sharp directional move from the current supply zone found between $21,700 and $22,800.BTC/USDT 1-day chart. Source: TwitterCrypto Patel said, “Scenario 1:- If Break $22,900 Level then Ready for Long with $28,400 TP [take profit]. Scenario 2:- But If failed to hold $$22,800 then High Possibility to test $12K Level.”Based on the current Bitcoin price, the chart above predicts a possible run-up to the resistance area near $28,400, followed by a consolidation or pullback before BTC attempts to take out the resistance found at $32,300. The overall cryptocurrency market cap now stands at $1.062 trillion and Bitcoin’s dominance rate is 42.1%.The views and opinions expressed here are solely those of the author and do not necessarily reflect the views of Cointelegraph.com. Every investment and trading move involves risk, you should conduct your own research when making a decision.
Čítaj viac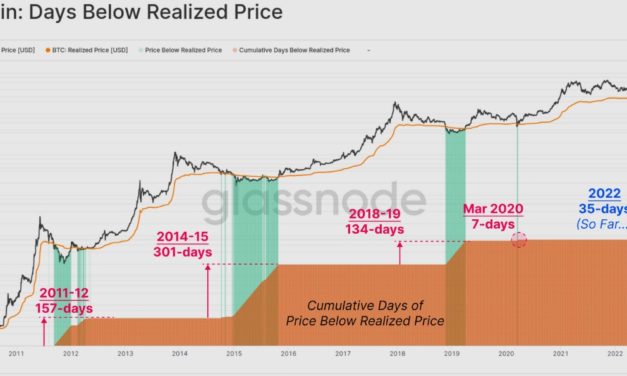
“When will it end?” is the question that is on the mind of investors who have endured the current crypto winter and witnessed the demise of multiple protocols and investment funds over the past few months.This week, Bitcoin (BTC) once again finds itself testing resistance at its 200-week moving average and the real challenge is whether it can push higher in the face of multiple headwinds or if the price will trend down back into the range it has been trapped in since early June. According to the most recent newsletter from on-chain market intelligence firm Glassnode, “duration” is the main difference between the current bear market and previous cycles and many on-chain metrics are now comparable to these historical drawdowns. One metric that has proven to be a reliable indicator of bear market bottoms is realized price, which is the value of all Bitcoin at the price they were bought divided by the number of BTC in circulation. Number of days Bitcoin price traded below the realized price. Source: GlassnodeAs shown on the chart above, with the exception of the flash crash in March 2020, Bitcoin has traded below its realized price for an extended period of time during bear markets. Glassnode said, “The average time spent below the Realized Price is 197-days, compared to the current market with just 35-days on the clock.”This would suggest that the current calls for an end of the crypto winter are premature because historical data suggests the market still has several months of sideways price action to go before the next major uptrend. Will the bottom be closer to $14,000?When it comes to what traders should be on the lookout for that would signify an end to the winter, Glassnode highlighted the Delta price and Balance price as “on-chain pricing models which tend to attract spot prices during late stage bears.”Bitcoin realized, balances and delta prices. Source: GlassnodeAs shown on the chart above, the previous major bear market lows were set after a “short-term wick down to the Delta price,” which is highlighted in green. A similar move in today’s market would suggest a BTC low near $14,215. These bearish periods also saw the BTC price trade in an accumulation range “between the Balanced Price (range low) and the Realized Price (range high),” which is where the price currently finds itself. One of the classic signs that a bear market is coming to an end has been a major capitulation event that exhausted the last remaining sellers. While some are still debating whether or not this has occurred, Glassnode highlighted the on-chain activity during the June plunge to $17,600 as a possible sign that capitulation has indeed taken place. Bitcoin total supply in loss. Source: GlassnodeAt the time that BTC fell to $17,600, there was a total volume of 9.216 million BTC holding an unrealized loss. Following the capitullation event on June 18, a month of consolidation and a price rally to $21,200, this volume has now declined to 7.68 million BTC. Glassnode said, “What this suggests is that 1.539M BTC were last transacted (have a cost-basis) between $17.6k and $21.2k. This indicates that around 8% of the circulating supply has changed hands in this price range.”Further evidence of capitulation having already taken place was the “staggering volume of BTC” that locked in a realized loss between May and July. Bitcoin 30-day sum realized losses. Source: GlassnodeThe collapse of Terra triggered a total realized loss of $27.77 billion while the June 18 plunge below the 2017 cycle all-time high resulted in a total realized loss of $35.5 billion. Related: Sub-$22K Bitcoin looks juicy when compared to gold’s market capitalizationIs this the end of the bear market?One final metric that suggests capitulation has already occurred is the Adjusted Spent Output Profit Ratio (aSPOR), which compares the value of outputs at the time they are spent to when they were created. Bitcoin adjusted SPOR. Source: GlassnodeAccording to Glassnode, when profitability is declining (as represented by the blue arrows), investors being to realize large losses which eventually leads to “a final waterfall moment of capitulation,” which is highlighted in red. Glassnode said, “The market eventually reaches seller exhaustion, prices start to recover, and investor pain starts to subside.”In order to verify that capitulation has indeed taken place and accumulation is underway, Glassnode indicated that the aSOPR value would ideally need to recover back above 1.0. The views and opinions expressed here are solely those of the author and do not necessarily reflect the views of Cointelegraph.com. Every investment and trading move involves risk, you should conduct your own research when making a decision.
Čítaj viac
Crypto traders found cause for celebration on July 18 as the total market capitalization climbed back above the $1 trillion mark following weeks of widespread selling after Bitcoin (BTC) price swept yearly lows below $18,000.The green day for cryptocurrencies largely tracks a positive day in the traditional markets, which are up modestly despite analyst estimates that the Federal Reserve intends to raise interest rates by at least 75 basis points at the Federal Open Market Committee meeting on July 27. Daily cryptocurrency market performance. Source: Coin360While traders will welcome July 18’s positive price action, many analysts caution that the upswing is nothing more than a bear market pump. Let’s take a look at the current top performers.Bitcoin holds a 16% gainData from Cointelegraph Markets Pro and TradingView shows that over the past week, Bitcoin has rallied significantly and at the time of writing BTC holds a 16% weekly gain from its recent low at $18,907. BTC/USDT 1-day chart. Source: TradingViewThe top cryptocurrency now finds itself running square into the resistance found at its 200-week moving average, which also happens to be the upper bound of the trading range BTC has been trapped in since the middle of June. This level has proven to be a tough nut to crack over the past five weeks as multiple attempts to break above it have been met with rejection. It remains to be seen if Bitcoin will manage to break free of this level and move higher or spend longer trading between $19,000 and $22,000. $BTC battling that 200 Week MA again. Rejected 3 times in the last 5 weeks here.Decision time imo.We either have a fat breakout or fat breakdown. $ETH has been leading the market so far, along with many other altcoins. Breakouts occurring everywhere.Can $BTC follow suit? pic.twitter.com/6Cz49po8CH— Taner ⚡️ (@Taner_Crypto) July 18, 2022Ethereum Merge surge presents a 43% rallyEthereum (ETH) has also experienced a boost in momentum and price over the past week, climbing 43% from a low of $1,005 on July 13 to a daily high at $1,530 on July 18, reaching its highest price since June 12.ETH/USDT 1-day chart. Source: TradingViewEther has been showing increased momentum since the successful July 6 completion of the Merge on the Sepolia testnet. A further boost to its price was provided on July 15 when it was announced that the mainnet Merge is predicted to take place on September 19.While the September 19 date is still tentative and should be considered as a roadmap projection and not a hard deadline, the prospect of the Merge finally taking place after years of preparation is exciting the community and possibly driving demand for Ether. Related: Bitcoin price nears critical 200-week moving average as Ethereum touches $1.5KMATIC keeps movingOn the altcoin front, Polygon (MATIC) continues to lead the pack higher following a week of several major announcements including being selected to participate in Disney’s 2022 Accelerator Program, gaining 32.4% over the past 24 hours and trading near resistance at $0.94. MATIC/USDT 1-day chart. Source: TradingViewOther notable gainers on the 24-hour chart include a 19.6% gain for STEPN (GMT), an 18.9% gain for Theta Fuel (TFUEL), and a 17.6% increase for Convex Finance (CVX). The overall cryptocurrency market cap now stands at $1.019 trillion and Bitcoin’s dominance rate is 41.6%.The views and opinions expressed here are solely those of the author and do not necessarily reflect the views of Cointelegraph.com. Every investment and trading move involves risk, you should conduct your own research when making a decision.
Čítaj viac

