Päť projektov, ktoré by mohli nahradiť Bitcoin
Tento príspevok bol pôvodne publikovaný na stránke...
Čítaj viac
Tento príspevok bol pôvodne publikovaný na stránke...
Čítaj viac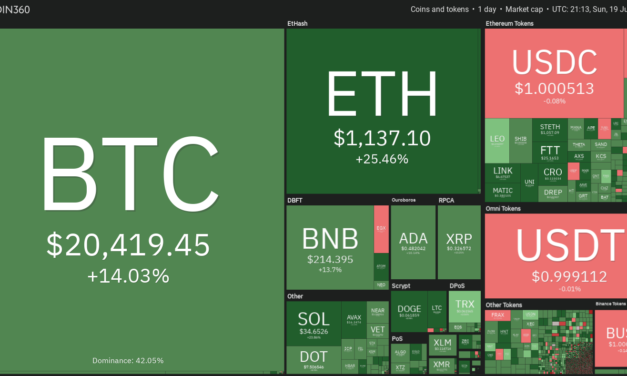
Bitcoin (BTC) plummeted to $17,622 on June 18. This marked the first time in Bitcoin’s history that it has fallen below its previous cycle high. The United States Federal Reserve’s aggressive monetary tightening, a crisis at crypto lending platform Celsius and liquidity issues at investment fund Three Arrows Capital are creating a sense of panic among traders.Markets commentator Holger Zschaepitz said that Bitcoin has crashed more than 80% four times in history. That puts the current fall of about 74% within historical standards. Previous bear markets have bottomed out just below the 200-week moving average, according to market analyst Rekt Capital. If history repeats itself, Bitcoin is unlikely to stay at the current depressed levels for a long time.Crypto market data daily view. Source: Coin360Coinglass data suggests that Bitcoin’s 39% loss in June of this year is the worst ever since 2013. While several investors expect Bitcoin to bottom out soon, crypto critic Peter Schiff warned that the selling could continue and the largest cryptocurrency may drop to $3,000.Could bulls arrest the decline in Bitcoin in the short term? If that happens, let’s study the charts of the top-5 cryptocurrencies that may outperform the other coins.BTC/USDTBitcoin plummeted below the crucial support of $20,111 on June 18, indicating the resumption of the downtrend. A minor positive is that the bulls purchased the dip as seen from the long tail on the day’s candlestick.BTC/USDT daily chart. Source: TradingViewThe buyers are attempting to push the price back above the breakdown level of $20,111. If they manage to do that, it will suggest that the drop to $17,622 on June 18 may have been a bear trap. The BTC/USDT pair could then rally to $23,362 where the bears may again mount a strong resistance.The relative strength index (RSI) has been trading in the oversold zone for the past few days which suggests a relief rally in the near term.This positive view could invalidate if the price turns down from $20,111. That will suggest the bears have flipped the level into resistance and increase the possibility of a break below $17,622. The next support on the downside is $16,000.BTC/USDT 4-hour chart. Source: TradingViewThe positive divergence on the RSI suggests that the bears may be losing their grip. The 4-hour chart shows that the price has recovered to the 20-exponential moving average. This is an important level for the bears to watch out for because a break and close above it could push the pair to the overhead resistance zone between the 50-simple moving average and $23,362. Conversely, if the price fails to sustain above the 20-EMA, it will suggest that bears are active at higher levels. The sellers will then again try to pull the pair to $17,622.SOL/USDTSolana (SOL) has been in a strong downtrend but the positive divergence on the RSI suggests that the bearish momentum could be weakening. SOL/USDT daily chart. Source: TradingViewThe bulls will try to push the price above the 20-day EMA ($36). If they succeed, it will suggest that the bulls are on a comeback. The SOL/USDT pair could thereafter rise to the 50-day SMA ($50) where the bears may again mount a strong defense.On the contrary, if the price turns down from the 20-day EMA, it will suggest that the bears are in no mood to surrender their advantage. The sellers will then again try to sink the price below $25 and start the next leg of the downtrend.SOL/USDT 4-hour chart. Source: TradingViewThe bulls have pushed the price above the moving averages on the 4-hour chart and will attempt to clear the overhead hurdle at the downtrend line. If they do that, it will suggest that the downtrend may have ended in the short term. The buyers will then try to push the price to $42.50 and later to $45.Conversely, if the price turns down from the current level or the downtrend line and breaks below the moving averages, it will suggest that bears continue to defend the overhead resistance aggressively. That could pull the price to $27.50 and later to $25.LTC/USDTThe bears attempted to sink Litecoin (LTC) below the strong support at $40 on June 18 but the long tail on the day’s candlestick suggests that the bulls are defending the level aggressively.LTC/USDT daily chart. Source: TradingViewThe relief rally has reached the 20-day EMA ($55) which is an important level to keep an eye on because a break and close above it could suggest a potential change in trend. The LTC/USDT pair could thereafter rise to the 50-day SMA ($68).Contrary to this assumption, if the price turns down from the 20-day EMA, it will suggest that the trend remains negative and traders are selling on rallies. The bears will then make another attempt to sink the pair below $40 and resume the downtrend.LTC/USDT 4-hour chart. Source: TradingViewThe price has broken out of a symmetrical triangle pattern on the 4-hour chart. Although this setup usually acts as a continuation pattern, sometimes it indicates a possible reversal. The moving averages have completed a bullish crossover, suggesting advantage to buyers. If buyers sustain the price above the triangle, the pair could rise to the pattern target of $62.This positive view could invalidate in the short term if the price turns down and re-enters the triangle. Such a move will suggest that the break above the triangle may have been a bull trap.Related: Elon Musk’s support for Dogecoin grows stronger following $258B lawsuitLINK/USDTChainlink (LINK) is in a downtrend but it is trying to form a bottom near $5.50. The bears pulled the price below this level on June 13, June 14 and June 18 but they could not sustain the lower levels. This suggests that bulls are buying on dips.LINK/USDT daily chart. Source: TradingViewThe positive divergence on the RSI suggests that the bearish momentum may be weakening. The buyers will try to push the price toward the downtrend line, which is likely to act as a stiff resistance.If the price turns down from the downtrend line, the bears will again attempt to sink and sustain the LINK/USDT pair below the $5.50 support. If that happens, it will suggest the resumption of the downtrend.Alternatively, if buyers thrust the price above the downtrend line, it will suggest a potential trend change. The pair could then rise to $10 and later to $12.LINK/USDT 4-hour chart. Source: TradingViewThe rebound in the pair has reached the 50-SMA which may act as a minor resistance. The 20-EMA is flattening out and the RSI is near the midpoint, suggesting that the bears may be losing their grip.If buyers push the price above the 50-SMA, the pair could rise to $7.51. A break and close above this resistance will complete a double bottom pattern in the short term. This reversal setup has a pattern target of $9.50.To invalidate this bullish view, the bears will have to pull and sustain the price below the strong support at $5.50. BSV/USDBitcoin SV (BSV) has formed a broadening pattern and the buyers are attempting to push the price above the resistance of the setup. The RSI is showing a positive divergence, indicating that the bearish momentum is weakening.BSV/USD daily chart. Source: TradingViewThe BSV/USD pair could rally to the resistance line where the bears may try to stall the recovery. If that happens, it will suggest that bears continue to sell on rallies. That could keep the pair stuck inside the broadening formation for some more time.Conversely, if bulls drive the price above the resistance line, it will suggest that the pair may have bottomed out. The pair could then start a new up-move which could push the pair to $80 and then $87. BSV/USD 4-hour chart. Source: TradingViewThe 4-hour chart shows that the pair has been trading inside a large range between $45 and $66. After a failed attempt by the bears to pull the pair below the range, the bulls will attempt to push the price above the resistance.If they succeed, the pair could start a new up-move. The pattern target of this setup is $87. Another possibility is that the price turns down from $66. If that happens, it will suggest that the pair may remain range-bound for some more time.The views and opinions expressed here are solely those of the author and do not necessarily reflect the views of Cointelegraph. Every investment and trading move involves risk, you should conduct your own research when making a decision.
Čítaj viac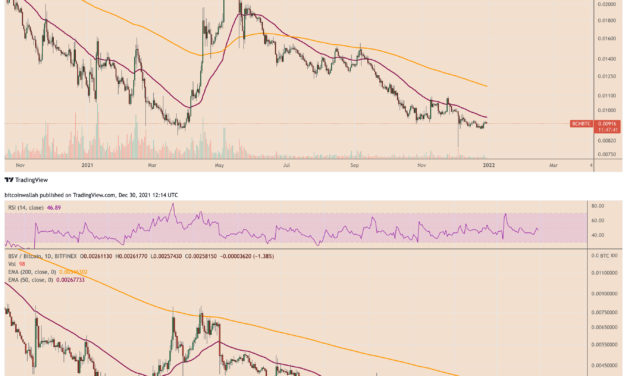
Bitcoin (BTC) looks set to beat its forked versions Bitcoin Cash (BCH) and Bitcoin SV (BSV) in terms of price-performance in 2021, market data shows.Notably, BTC’s year-to-date (YTD) returns sat near 60% at press time as its price wobbled near $47,500. In comparison, BCH rallied a little over 26% to $435.50, while the BSV price plunged over 25% to $122.30 in the same period.But the biggest takeaway remained the performance of Bitcoin Cash and Bitcoin SV against Bitcoin. In detail, the BCH/BTC rate declined over 22.50% YTD to 0.00916. Meanwhile, BSV/BTC dipped by nearly 55% YTD to 0.00258 BTC, signaling capital rotations out of Bitcoin forks.BCH/BTC and BSV/BTC daily candle price chart. Source: TradingViewMarket dominanceAdditionally, forked Bitcoin tokens — once counted among the top-ten cryptos by market capitalization — lost their positions to the emerging layer-one blockchain projects. Notably, the arrival of Solana (SOL), Cardano (ADA), Terra (LUNA), Avalanche (AVAX), and other protocols opened more avenues for crypto traders to park their money. On the other hand, Bitcoin Cash’s and Bitcoin SV’s main selling point remained claims of greater scalability, which didn’t gain traction with investors as Bitcoin’s transaction fees fell by over 50% this year. Performance of top 25 crypto assets as of Dec. 30, 1330 UTC. Source: MessariThat resulted in a decline in the market dominance of both Bitcoin Cash and Bitcoin SV. While the BCH’s share in the entire crypto market slipped to 0.37% from 0.84% at the beginning of this year, the BSV’s market portion also declined to 0.10% from 0.40% in the same period.Bitcoin, whose market dominance also slipped from 70% to under 40%, performed better than Bitcoin Cash and Bitcoin SV, nonetheless. That is primarily because of its rising adoption among retail and institutional investors as they searched for safe-havens against the central banks’ inflation-friendly loose monetary policies.Inflation keeps rising, debt keeps rising, interest rates near zero, and in some countries negative…Yeah, feels good to be a #bitcoin holder!— Lark Davis (@TheCryptoLark) December 19, 2021Abysmal development dataBitcoin also excelled over BCH and BSV based on developers’ activity.Data fetched by CryptoMiso.com showed that Bitcoin approved 2,937 changes suggested by over 100 contributors to its source code this year, the seventh-largest number of commits recorded on GitHub. In comparison, Bitcoin Cash and Bitcoin SV processed 1,099 and 496 commits in the same period.Bitcoin Cash and Bitcoin SV commits in 2021. Source: CryptoMisoA higher number of commits shows that more developers want to improve the open-source project in concern. Conversely, a lower count alerts about a slower rate of improvements on the protocol. In the end, Bitcoin SV turned out to be the worst-performer than Bitcoin Cash in terms of price-performance, as well as market dominance and developers activity. Investors also kept their distance as the Bitcoin SV network suffered three 51% attacks and its co-founder Craig Wright remained embroiled in a lawsuit, as Cointelegraph covered earlier.Now, BSV price may face more losses ahead should it break below a long-withstanding support level near $121.50, as shown in the chart below.BSV/USD weekly price chart. Source: TradingViewConversely, a pullback from the $121.50-support could have the BSV price test its 50-week exponential moving average (currently near $167) as the next upside target.Related: Top crypto winners and losers of 2021Likewise, the BCH price’s latest decline has brought it near its multi-year ascending trendline support. Therefore, a pullback from the said level could have the Bitcoin Cash token eye approximately $600 as its next upside target, as shown via Fibonacci levels below.BCH/USD weekly price chart. Source: TradingViewOtherwise, breaking below the long-term support level risks puts the BCH price en route to near $195, a level with a history of sending prices higher.The views and opinions expressed here are solely those of the author and do not necessarily reflect the views of Cointelegraph.com. Every investment and trading move involves risk, you should conduct your own research when making a decision.
Čítaj viac

