
Tento príspevok bol pôvodne publikovaný na stránke https://cointelegraph.com/news/price-analysis-8-7-spx-dxy-btc-eth-bnb-xrp-ada-doge-sol-ltc a autorom článku je Cointelegraph By Rakesh Upadhyay. Tento článok je iba kópia originálneho článku.
https://images.cointelegraph.com/cdn-cgi/image/format=auto,onerror=redirect,quality=90,width=840/https://s3.cointelegraph.com/uploads/2023-08/df1e4825-4496-4a20-88e6-63b0dfdd1ec6.jpgBitcoin’s failure to rebound off strong support may open further downside as bears may be tempted to sell.

Price Analysis
Bitcoin (BTC) has been trading near the $29,000 level for the past few days. This suggests a lack of strong demand at higher levels but the only solace for the bulls is that they have managed to sustain the price above the immediate support.
The uncertainty about the next directional move may have tempted short-term traders to book profits. CoinShares said in its latest weekly report that Bitcoin investment products witnessed $111 million in outflows, the largest weekly outflows since March.
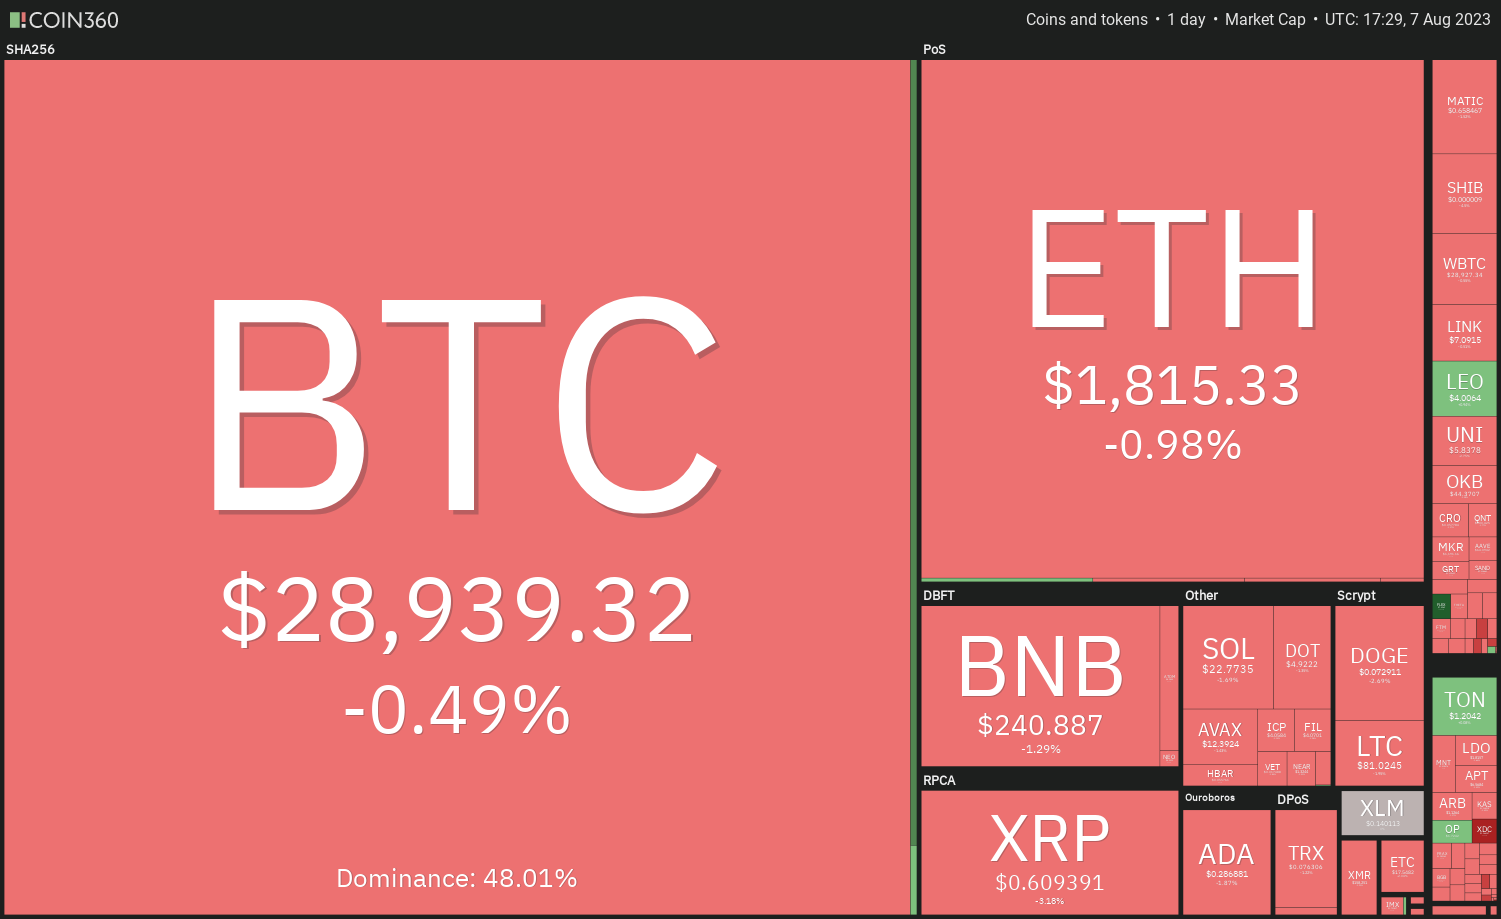
While the short-term price action remains uninspiring, crypto bulls remain confident that Bitcoin will rally before its next halving in 2024. Blockstream CEO Adam Back said in a conversation on X (previously known as Twitter) that Bitcoin will hit $100,000 by the end of March.
Could Bitcoin extend its decline in the near term or will it turn up? Will the altcoins outperform Bitcoin over the next few days? Let’s analyze the charts to find out.
S&P 500 Index price analysis
The S&P 500 Index (SPX) is witnessing a tough battle between the bulls and the bears near the 20-day exponential moving average (4,511). Sellers pulled the price below the 20-day EMA on Aug. 2, indicating that the bullish momentum is weakening.
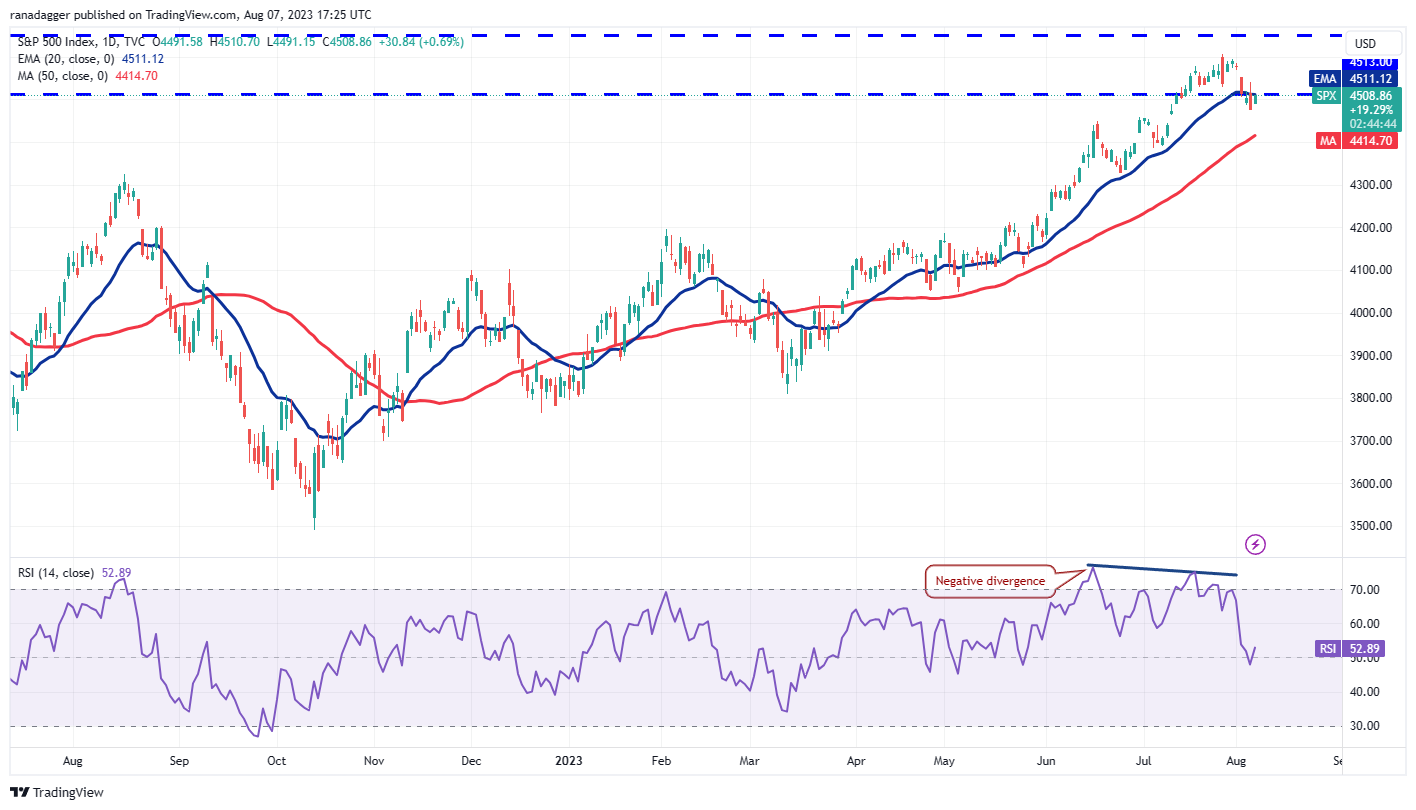
The bulls pushed the price back above the 20-day EMA on Aug. 4 but the bears aggressively sold the rally. This suggests that the bears are pouncing on relief rallies. The index could decline to the 50-day simple moving average (4,414), which could act as a strong support.
The 20-day EMA is flattening out and the relative strength index (RSI) is near the midpoint, indicating a balance between supply and demand. If the price rebounds off the 50-day SMA, it will suggest that lower levels continue to attract buyers. The index may then swing between the 50-day SMA and 4,650 for some time.
U.S. dollar index price analysis
Buyers pushed the U.S. dollar index (DXY) above the 50-day SMA (102) on Aug. 2 but they could not build upon this strength.
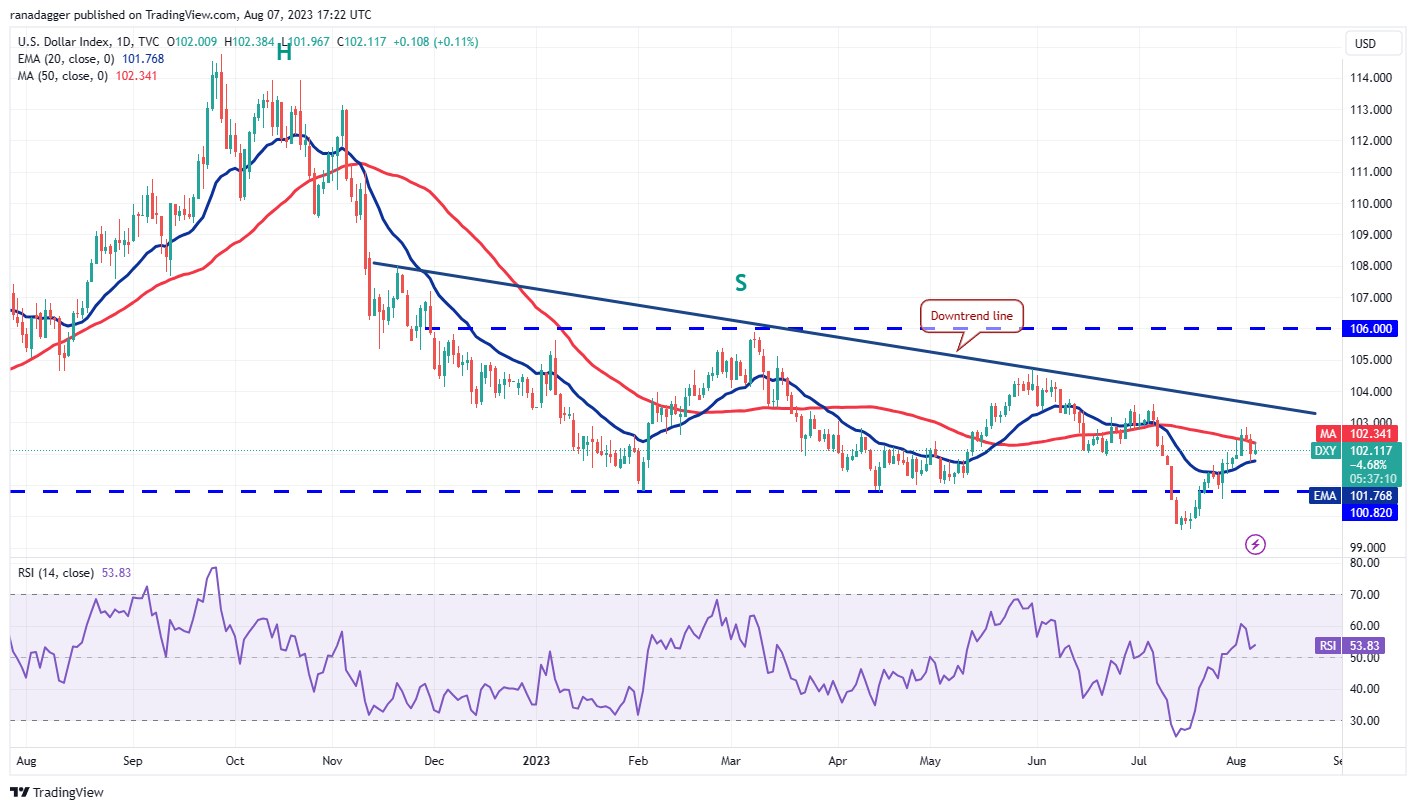
The bears pulled the price back below the 50-day SMA on Aug. 4. A minor positive is that the bulls have kept the price above the 20-day EMA (101). If buyers drive the price above the 50-day SMA, the index could retest the downtrend line. This remains the key level to watch on the upside because a break above it could open the doors for a rally to 106.
If bears want to gain the upper hand, they will have to sink and sustain the price below the 20-day EMA. The index could then slide to the strong support at 100.82.
Bitcoin price analysis
Bitcoin’s price is getting squeezed between the 20-day EMA ($29,387) and the horizontal support at $28,861. This low volatile period is likely to be followed by an expansion in volatility.
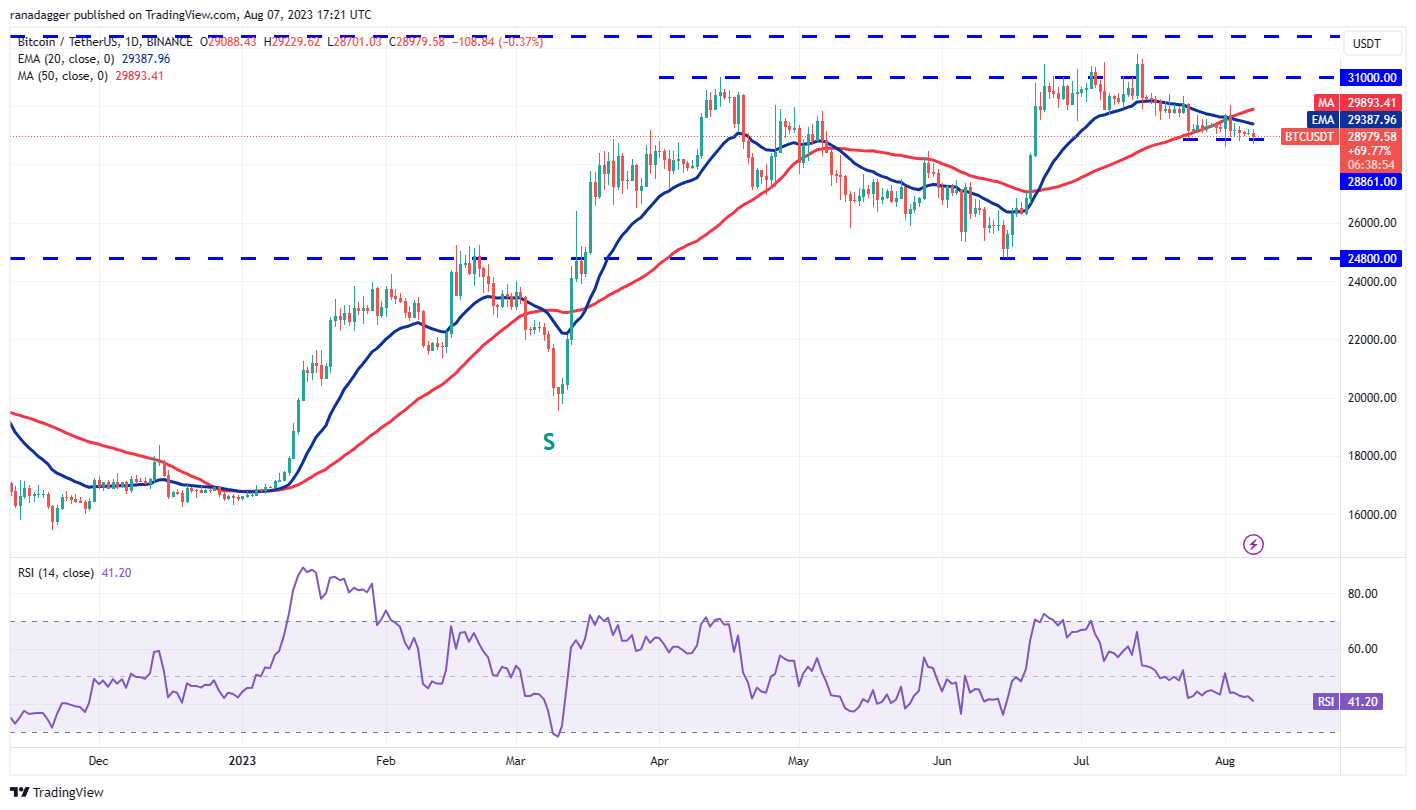
If the price plunges and sustains below $28,861, it will suggest that the uncertainty has resolved in favor of the bears. The BTC/USDT pair could then start a decline to $26,000 and eventually to $24,800.
Contrarily, if the price turns up and breaks above the 50-day SMA ($29,893), it will suggest that the bulls have overpowered the bears. That could start a rally to the overhead resistance zone between $31,500 and $32,400.
Ether price analysis
The bulls managed to keep Ether (ETH) above the immediate support at $1,816 for the past few days but they are struggling to start a strong recovery. This suggests that demand dries up at higher levels.
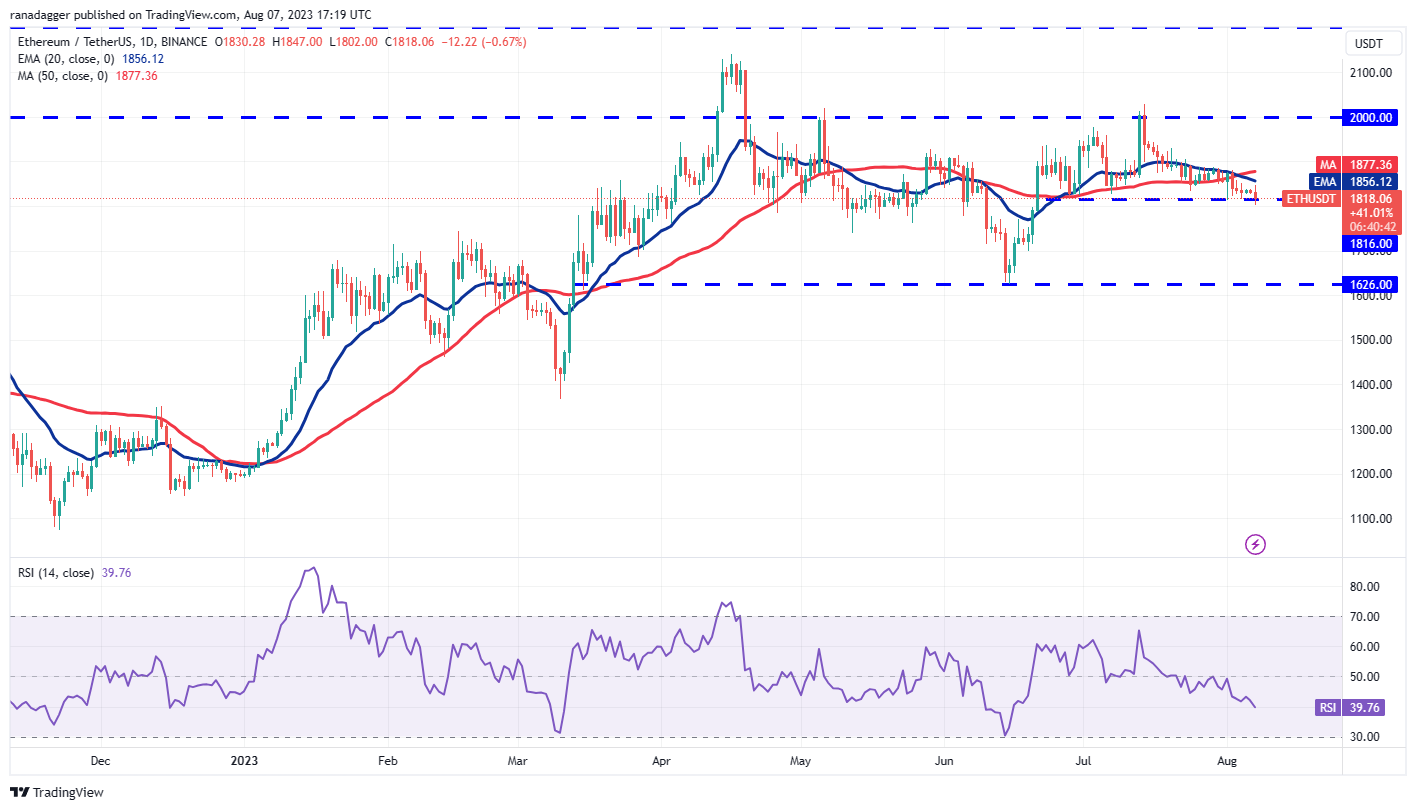
The downsloping 20-day EMA ($1,856) and the RSI in the negative territory indicate that bears have the upper hand. If the price slips and sustains below $1,816, the ETH/USDT pair could slump $1,700 and then to the crucial support at $1,626.
If bulls want to make a comeback, they will have to quickly kick the price above the 50-day SMA ($1,877). If they do that, the pair could start its northward march toward the overhead resistance at $2,000.
BNB price analysis
The price action inside a symmetrical triangle pattern is usually random and volatile. BNB (BNB) has been oscillating inside the triangle with no clear advantage either to the bulls or the bears.
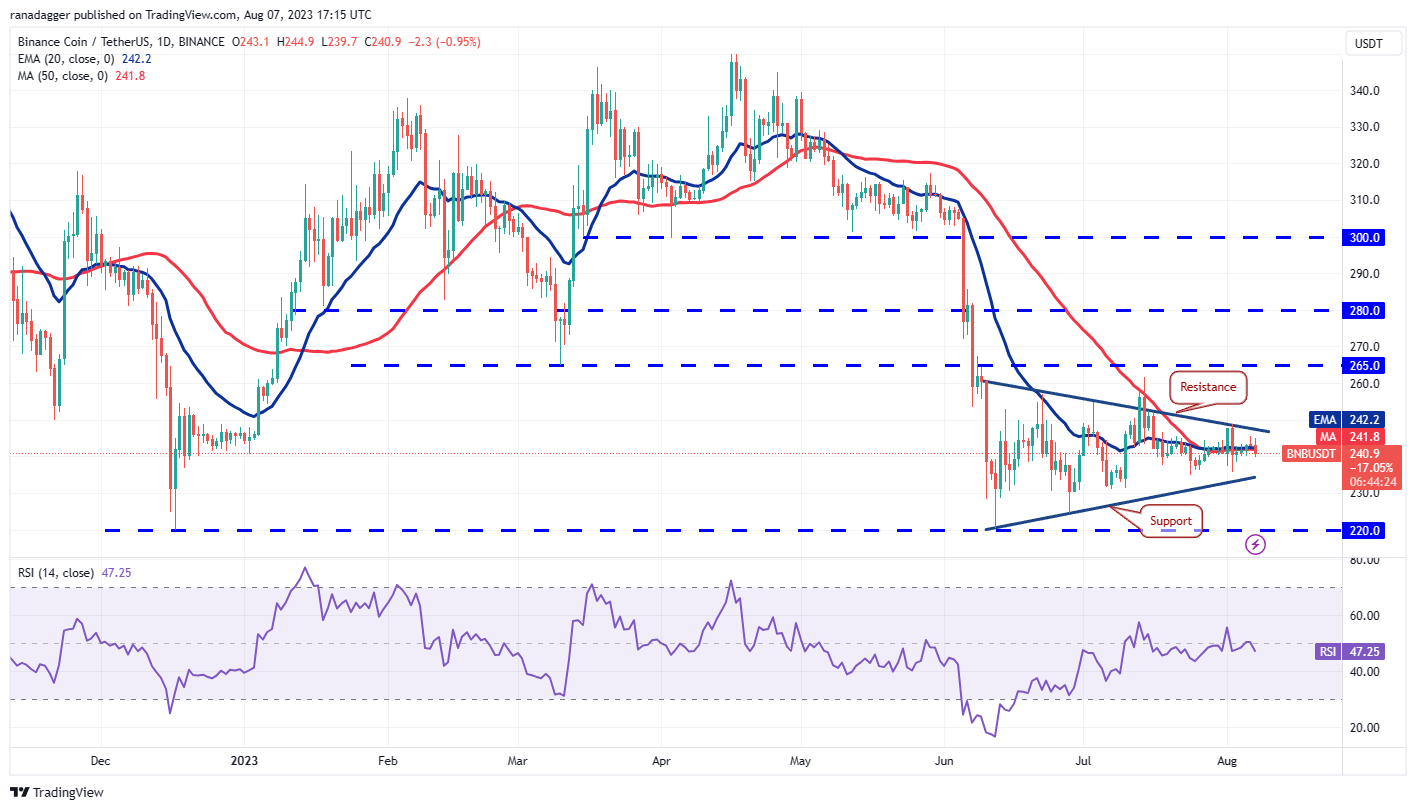
Typically, the symmetrical triangle behaves as a continuation pattern but in some cases, it can also start a reversal.
If the price rises above the triangle, it will suggest that the bulls have the upper hand. The BNB/USDT pair could then rise to the overhead resistance at $265. If this level is cleared, the pair may surge to $288.
Another possibility is that the price tumbles below the triangle. The pair may then descend to $220. If this support cracks, the pair may fall to the pattern target of $194.
XRP price analysis
XRP (XRP) continued its correction and dipped below the 61.8% Fibonacci retracement level of $0.64 on Aug. 4. This indicates that the bulls are losing their grip.
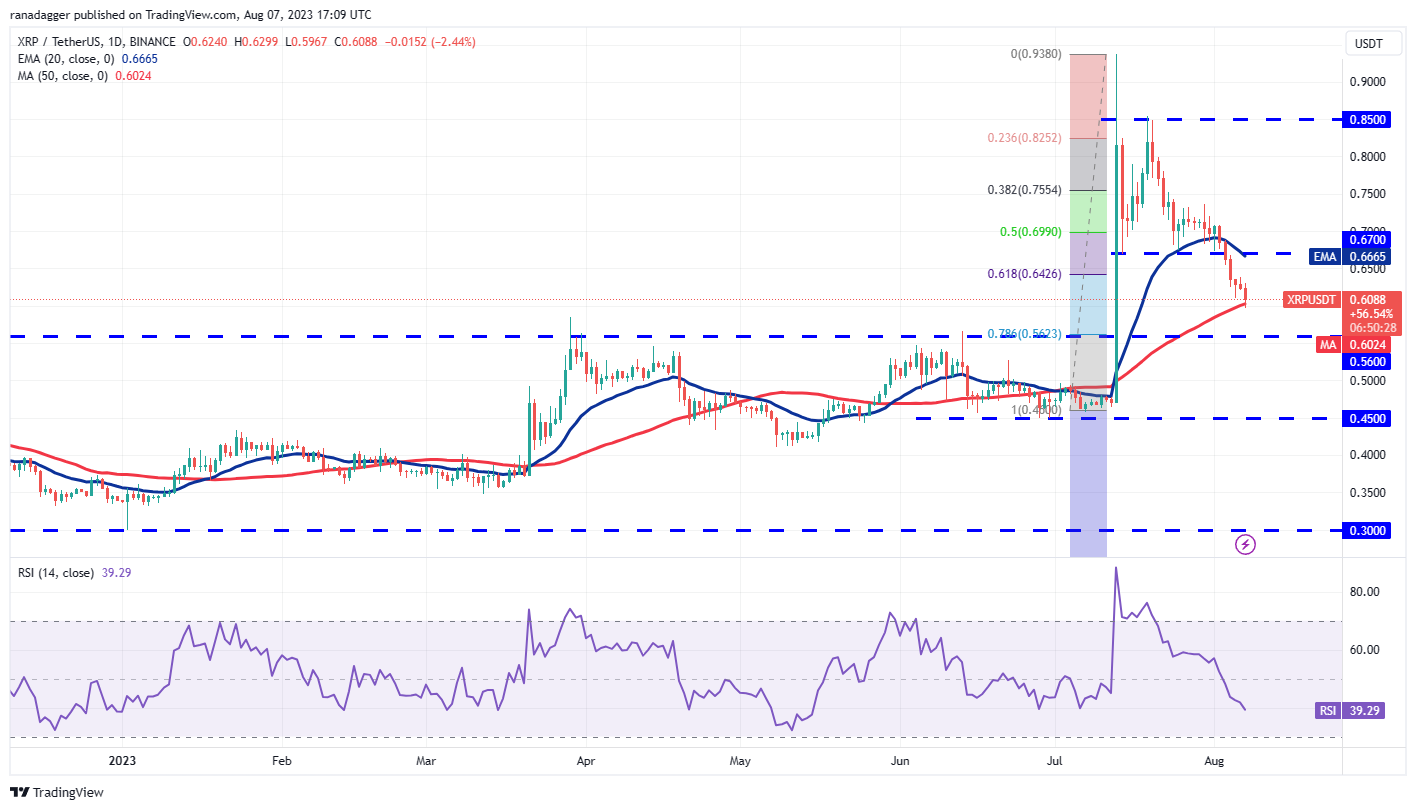
The price has reached the 50-day SMA ($0.60), which is an important level to watch out for. If the price bounces off the current level, the XRP/USDT pair may reach the 20-day EMA ($0.67), which could again act as a major obstacle.
If the price turns down from the current level or the 20-day EMA and breaks below the 50-day SMA, it will indicate that bears are in command. The pair could then slide to the breakout level of $0.56 and even risk a fall to $0.45.
Cardano price analysis
Buyers failed to push Cardano (ADA) back above the uptrend line in the past few days, indicating that the bears are trying to flip the level into resistance.
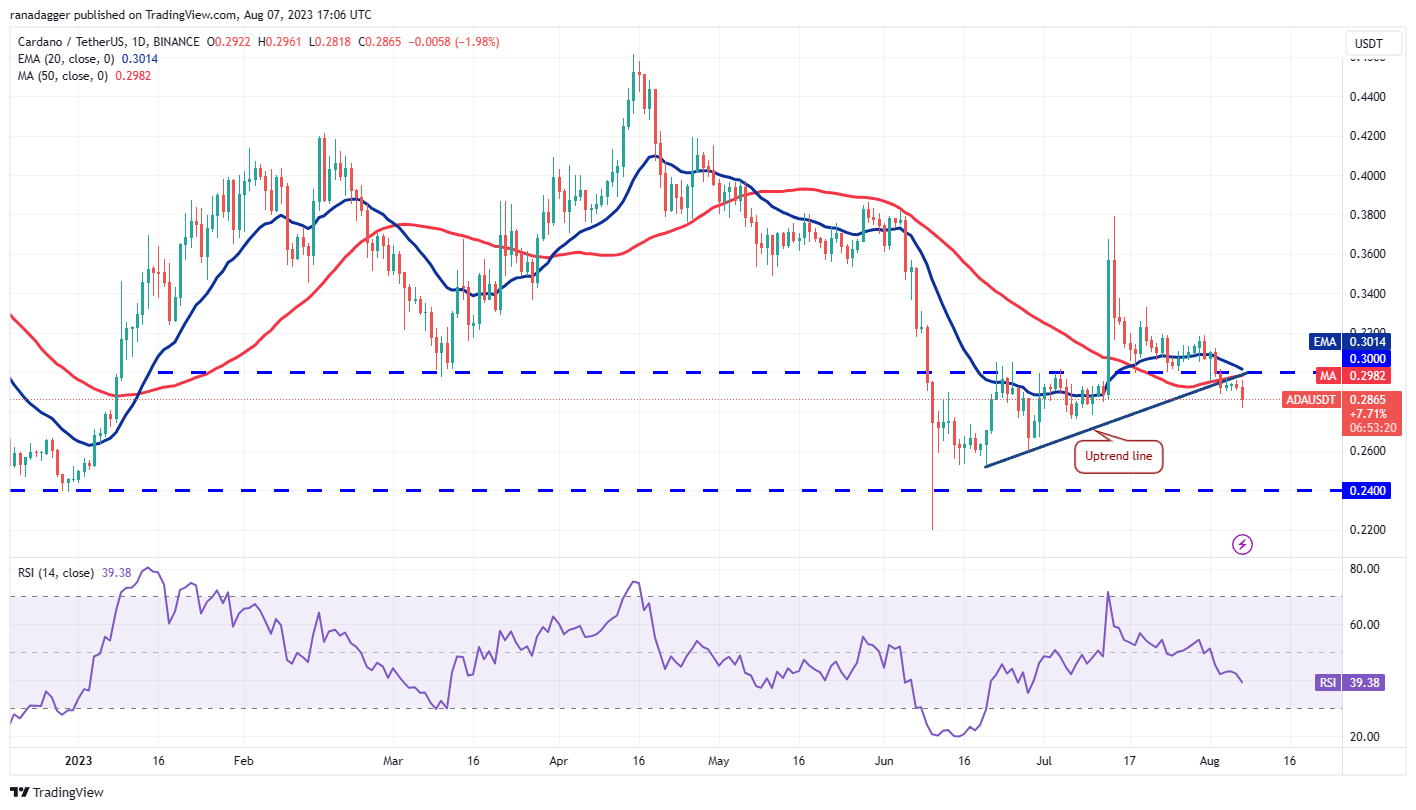
The bears yanked the price below the support near $0.29, signaling the resumption of the pullback. The ADA/USDT pair could plummet to the next support at $0.26 and eventually to the crucial level at $0.24.
This negative view will invalidate in the near term if the price turns up and rises above the 20-day EMA ($0.30). That could indicate solid buying at lower levels. The pair may then attempt a rally to $0.32 and later to $0.34.
Related: Bitcoin faces ‘endless spot selling’ as BTC price dips below $28.7K
Dogecoin price analysis
Dogecoin (DOGE) has been correcting inside an ascending channel pattern for the past few days. Generally, in an ascending channel, traders buy near the support of the channel and sell near the resistance.
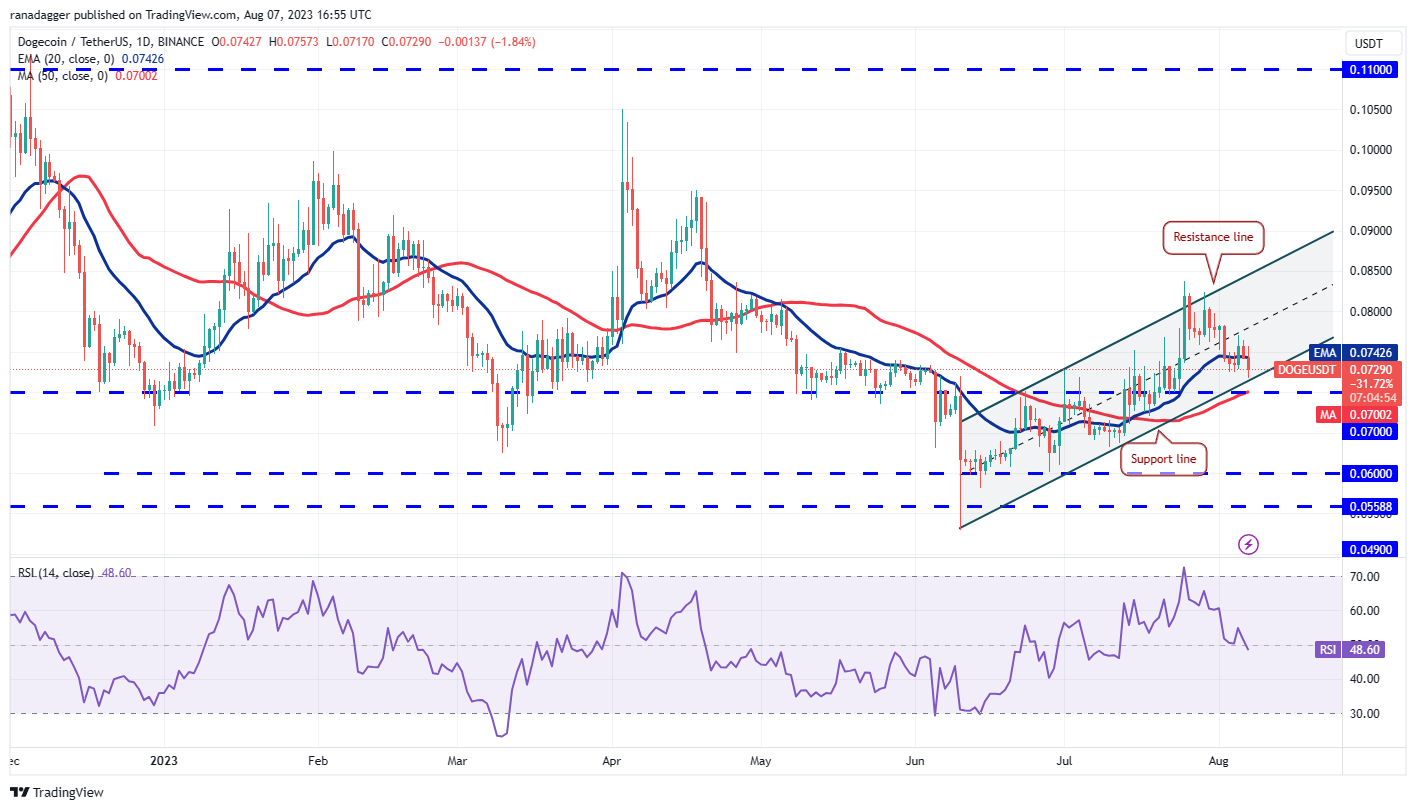
If the price turns up from the support line, it will suggest that the sentiment remains positive and traders are buying on dips. The bulls will then attempt to push the price to $0.08 and thereafter to the resistance line of the channel.
Instead, if the price dives below the channel, it will suggest that the bears are back in the game. There is a strong support at the breakout level of $0.07 but if this level gives way, the pair may drop to $0.06.
Solana price analysis
The bulls are trying to drive Solana (SOL) above the 20-day EMA ($23.58) while the bears are attempting to sink the price below the $22.30 support.
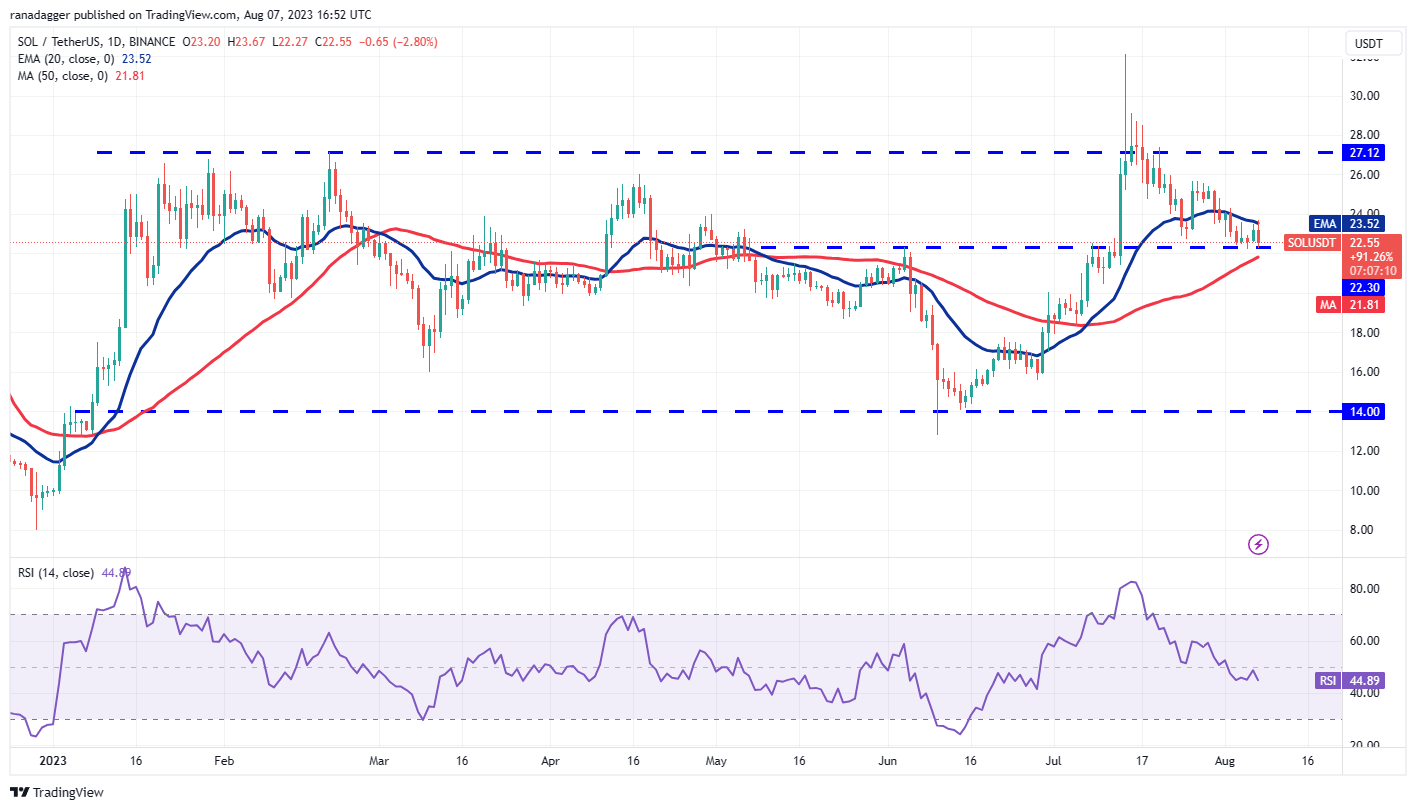
If the price climbs and sustains above the 20-day EMA, it will suggest that the SOL/USDT pair may remain range-bound between $22.30 and $27.12 for a while longer. Buyers will have to overcome the barrier at $27.12 to seize control.
Alternatively, if the price turns down from the 20-day EMA and breaks below the 50-day SMA ($21.81), it will signal that bears are trying to flip the 20-day EMA into resistance. That could start a deeper correction to $18.
Polygon price analysis
Polygon’s (MATIC) pullback has reached the first strong support at $0.64. Buyers have held this level but have failed to propel the price above the moving averages.
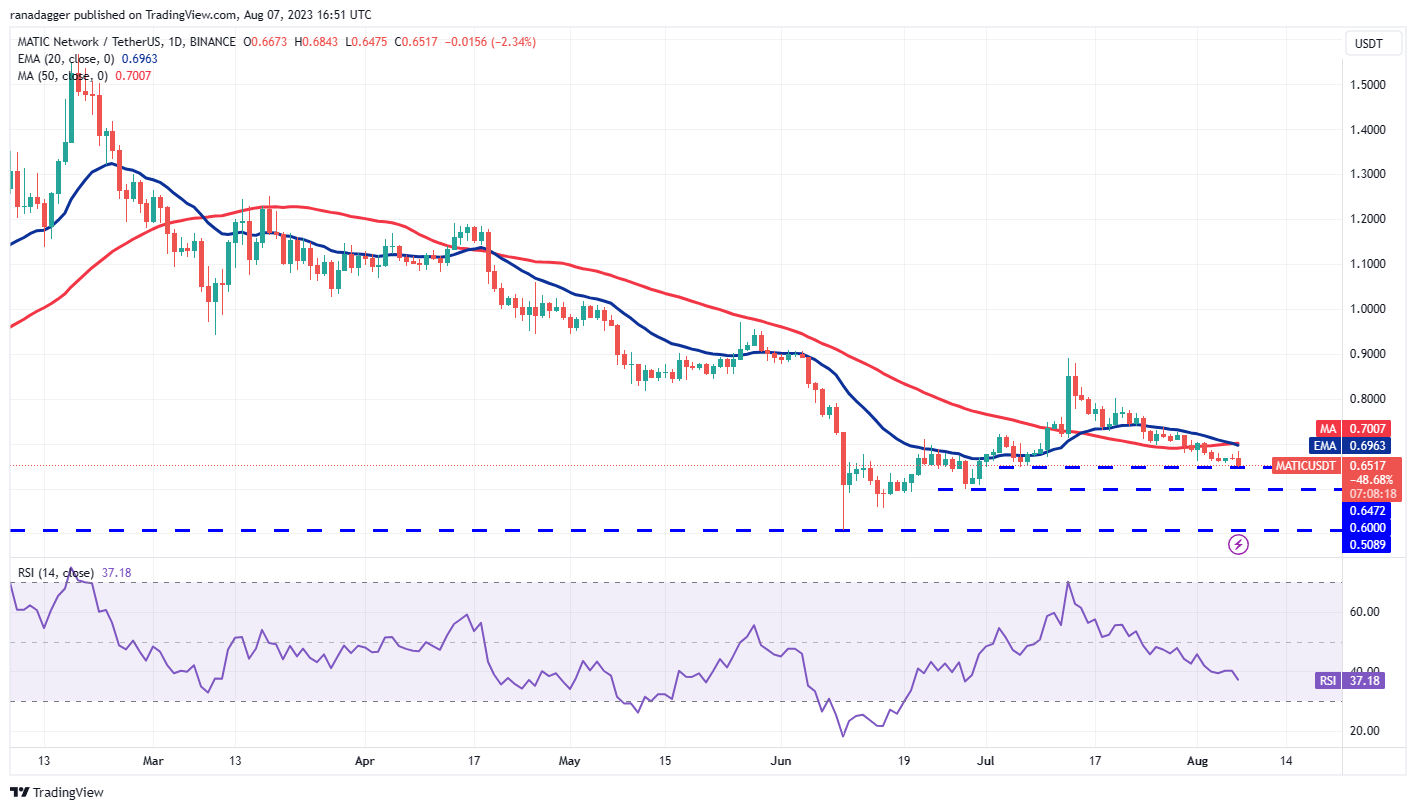
The 20-day EMA ($0.69) is turning down gradually and the RSI is in the negative territory, indicating that the path of least resistance is to the downside. If the price skids below $0.64, the MATIC/USDT pair could reach $0.60.
If bulls want to prevent the decline, they will have to quickly thrust the price above the moving averages. That could start a recovery, which may first hit $0.80 and subsequently $0.90.
This article does not contain investment advice or recommendations. Every investment and trading move involves risk, and readers should conduct their own research when making a decision.

