
Tento príspevok bol pôvodne publikovaný na stránke https://cointelegraph.com/news/price-analysis-8-4-btc-eth-bnb-xrp-doge-ada-sol-matic-ltc-dot a autorom článku je Cointelegraph By Rakesh Upadhyay. Tento článok je iba kópia originálneho článku.
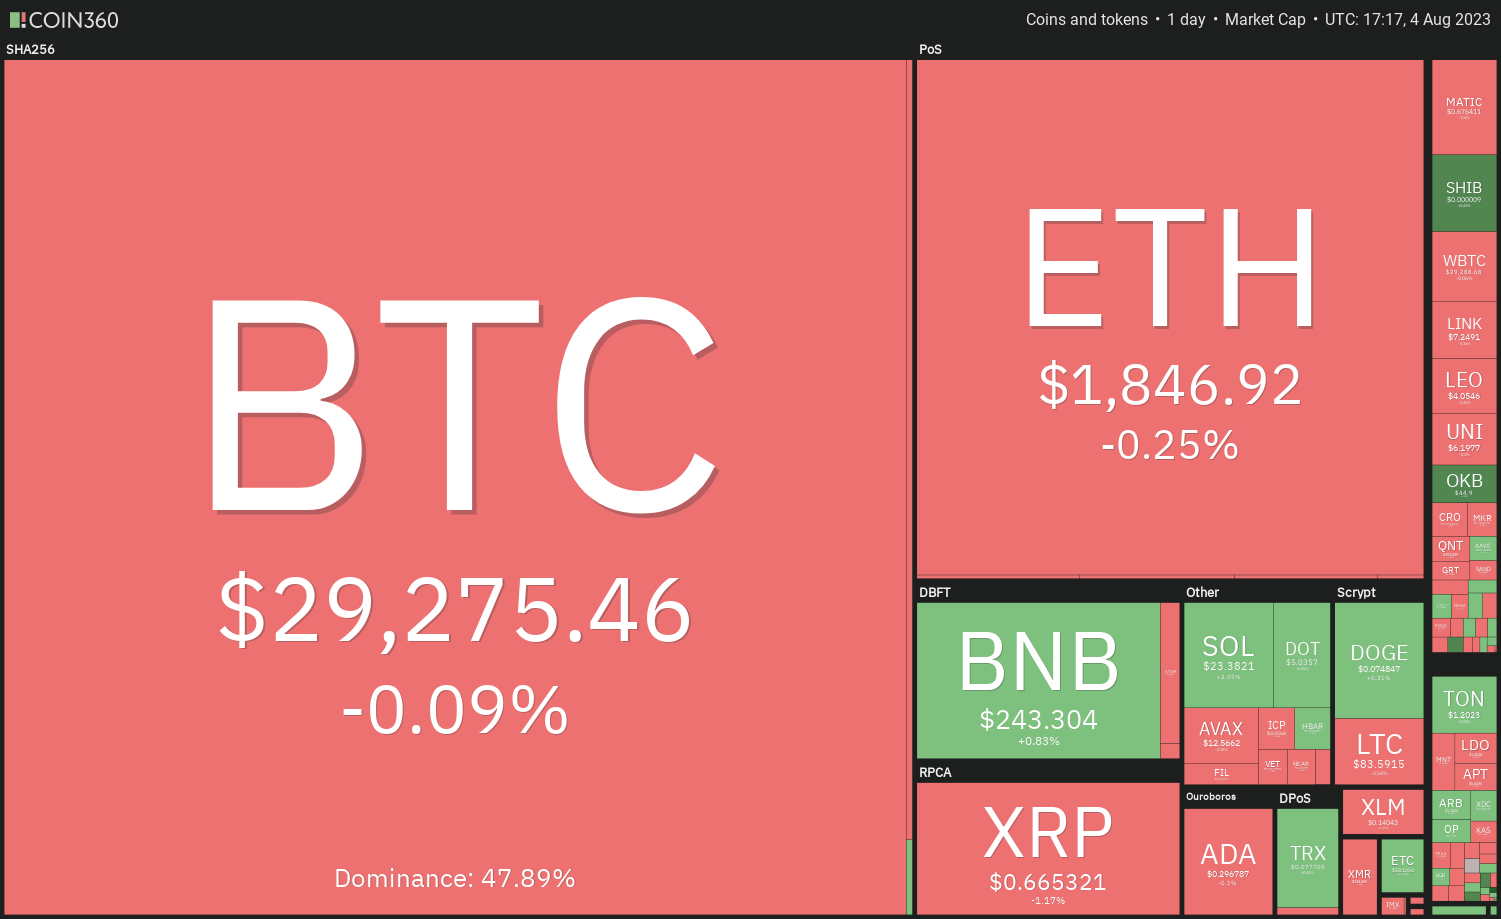
https://images.cointelegraph.com/cdn-cgi/image/format=auto,onerror=redirect,quality=90,width=840/https://s3.cointelegraph.com/uploads/2023-08/43395301-ee77-4a22-b96f-e708896525f8.jpgBitcoin continues to range trade, and altcoin traders are starting to view BTC’s price consolidation as a positive sign for the rest of the crypto market.

Price Analysis
Bitcoin continues to frustrate traders who have been predicting a breakout on either side, but investors should keep a close watch because the longer the time spent inside the range, the stronger the eventual breakout from it.
The July jobs report released on Aug. 4 was a mixed bag. Hence, it could not shake Bitcoin (BTC) from its range. The report showed the addition of 187,000 jobs, fewer than the 200,000 expected by economists. But average hourly wages remained strong, showing an increase of 0.4% for the month against expectations of a 0.3% rise.
Although the price remains stuck inside a range, analysts are putting out bullish projections for the second half of the year. A recent report from Matrixport projected a target of $45,000 by the end of this year and $125,000 by the end of 2024.
Bitcoin’s long-term story remains intact, but traders should keep a close eye on any possible shocks from regulators, as that could cause a knee-jerk reaction to the downside. What are the important support and resistance levels to watch out for in Bitcoin and altcoins? Let’s study the charts of the top 10 cryptocurrencies to find out.
Bitcoin price analysis
Bitcoin’s price is getting squeezed between the 20-day exponential moving average (EMA) of $29,523 and the horizontal support at $28,861.
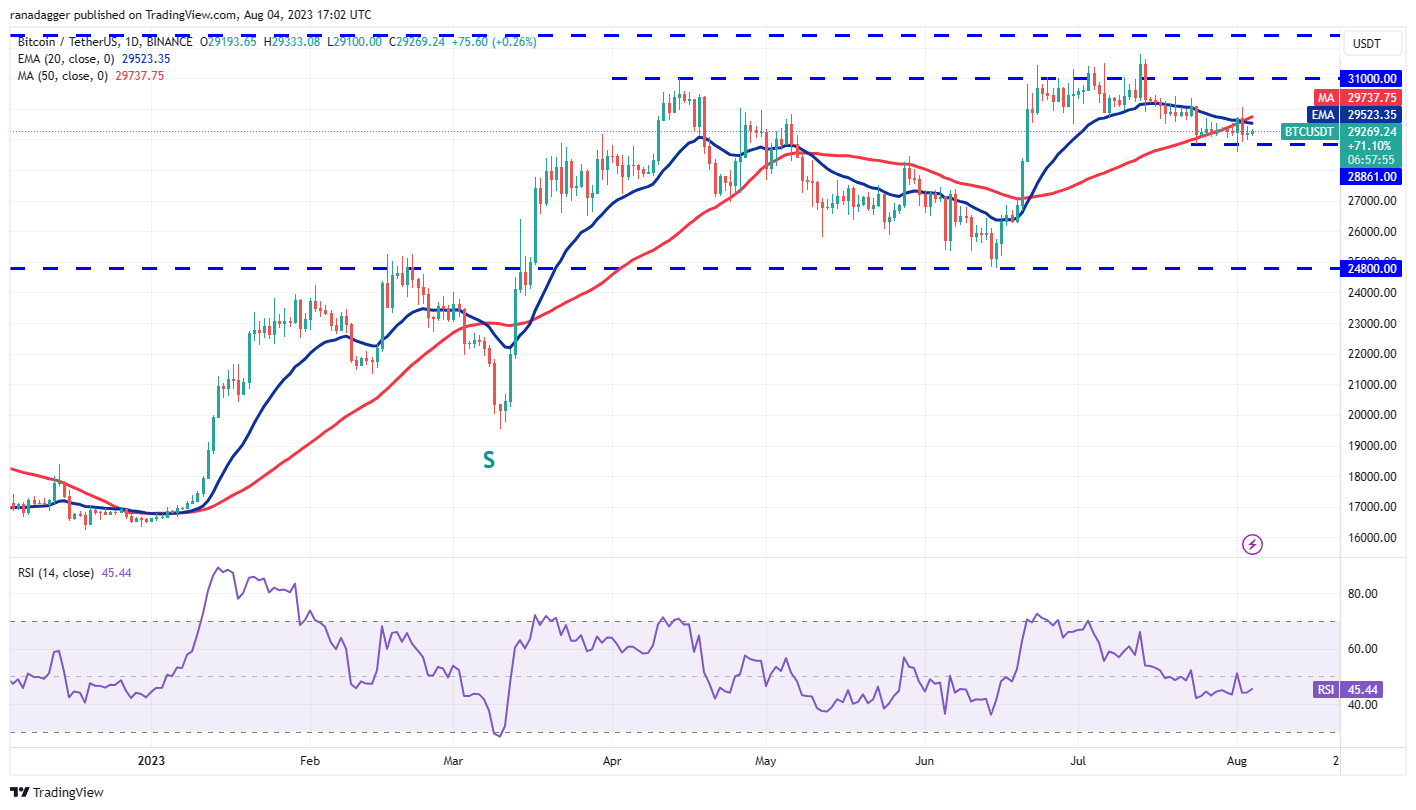
The downsloping 20-day EMA and the relative strength index (RSI) in the negative zone indicate that bears have a slight edge. If the price plummets and sustains below $28,861, the BTC/USDT pair may collapse to $27,500 and then to $26,000.
On the contrary, if the price bounces off $28,861, it will indicate that the bulls are protecting this level with all their might. A break and close above $30,000 will signal a comeback by the bulls. The pair may then climb to the overhead resistance zone between $31,804 and $32,400.
Ether price analysis
Ether (ETH) slumped below the 50-day simple moving average (SMA) of $1,871 on Aug. 2, which suggests that the bears are trying to gain the upper hand.
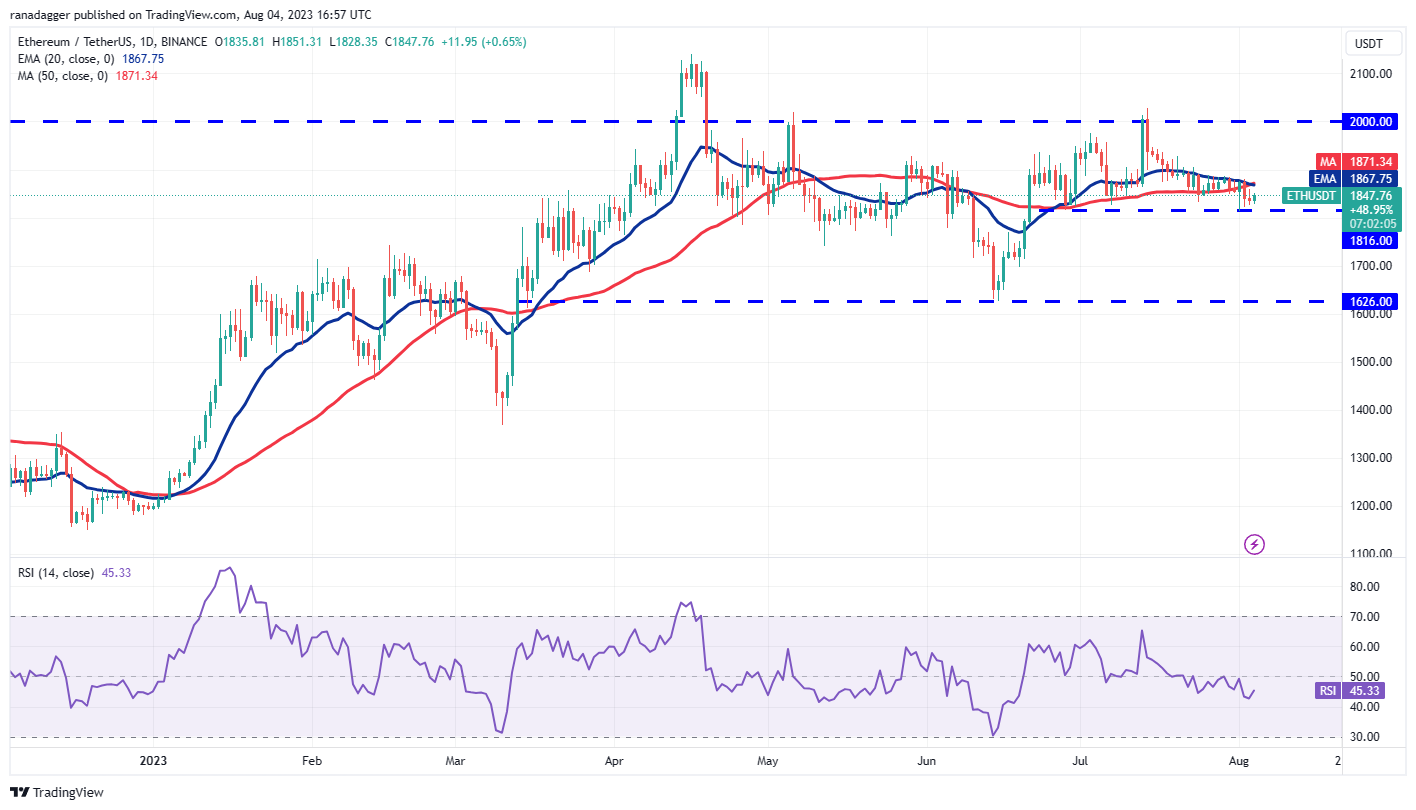
The bulls are trying to arrest the decline near the strong support at $1,816, but the failure to achieve a solid rebound suggests a lack of aggressive buying near the level. The downsloping 20-day EMA ($1,867) and the RSI just below the midpoint indicate that the path of least resistance is to the downside.
If the price skids below $1,816, the ETH/USDT pair may plunge to $1,698. This negative view will invalidate in the near term if bulls push and sustain the price above the 20-day EMA. In that case, the pair may swing between $1,816 and $2,000 for some time.
BNB price analysis
BNB (BNB) turned down from the resistance line of the symmetrical triangle pattern on Aug. 2, indicating that the bears are fiercely defending the level.
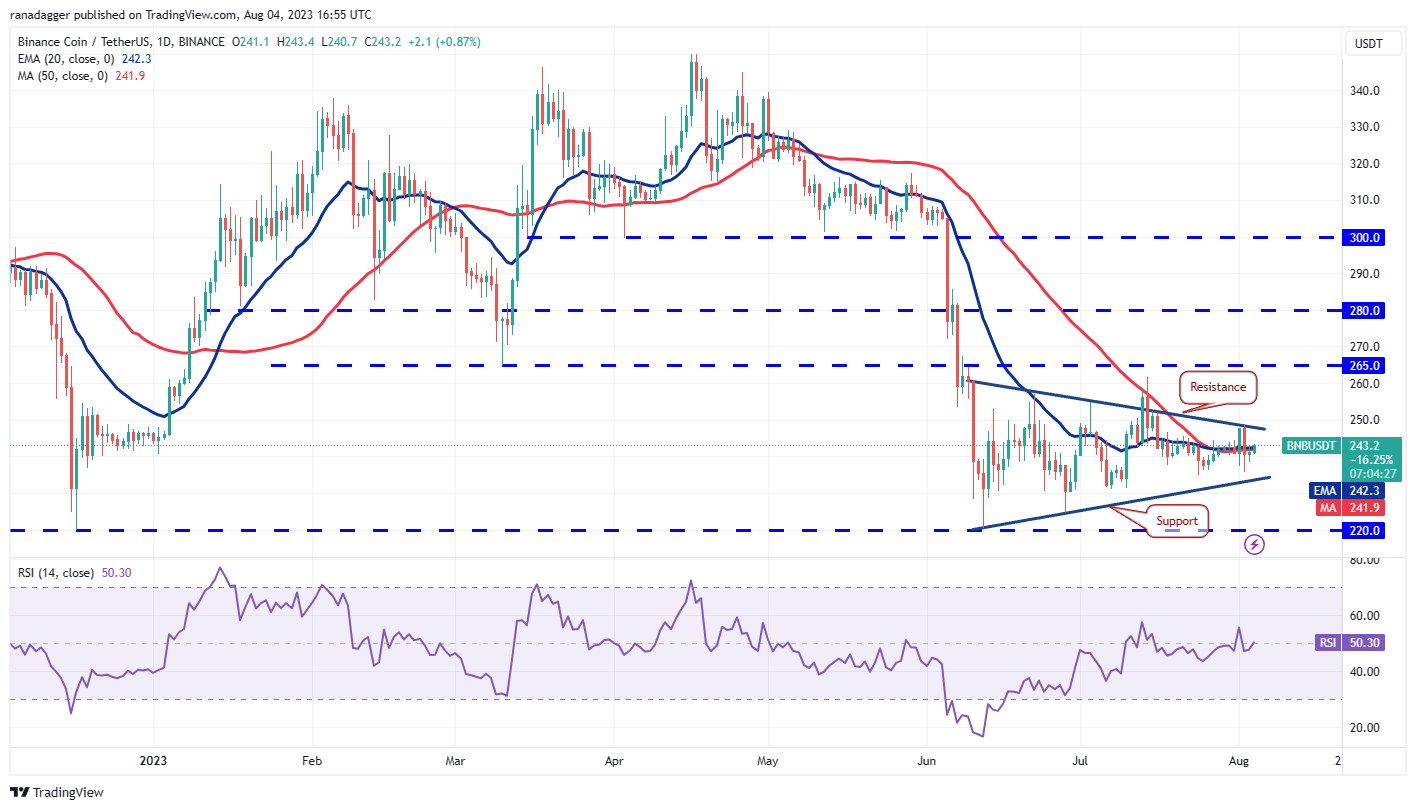
Both moving averages have flattened out and the RSI is near the midpoint, indicating a balance between supply and demand. This equilibrium will tilt in favor of the bulls if the price catapults above the triangle. The BNB/USDT pair could then attempt a rally to $265, where the bears may again pose a strong challenge.
Conversely, if the price turns down and breaks below the triangle, it will signal that bears are on a roll. The pair could then retest the crucial support at $220. If this level gives way, the pair may start the next leg of the downtrend.
XRP price analysis
XRP (XRP) tumbled below the 20-day EMA ($0.68) on Aug. 2 and followed that up with another slide on Aug. 3. That sent the price tumbling below the strong support at $0.67.
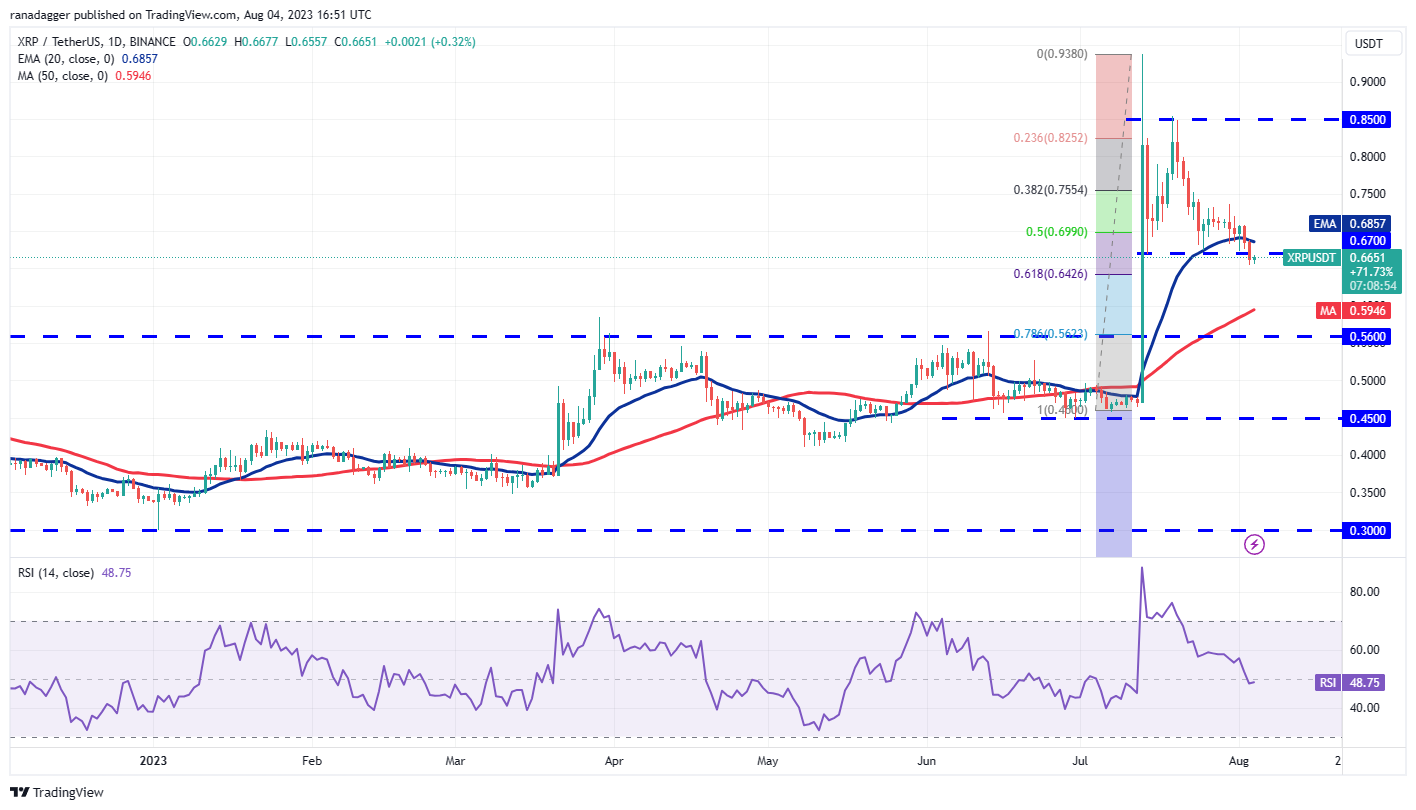
The bulls will try to protect the 61.8% Fibonacci retracement level of $0.64 because if this level breaks down, the XRP/USDT pair may collapse to the breakout level of $0.56. The 50-day SMA ($0.59) could act as temporary support, but it is likely to be broken.
Contrarily, if the bulls push the price back above the 20-day EMA, it will suggest solid demand at lower levels. That will increase the likelihood of the pair remaining inside the $0.67 to $0.85 range for a while longer.
Dogecoin price analysis
Dogecoin (DOGE) turned down and broke below the 20-day EMA ($0.07) on Aug. 2, indicating that higher levels are attracting sellers.
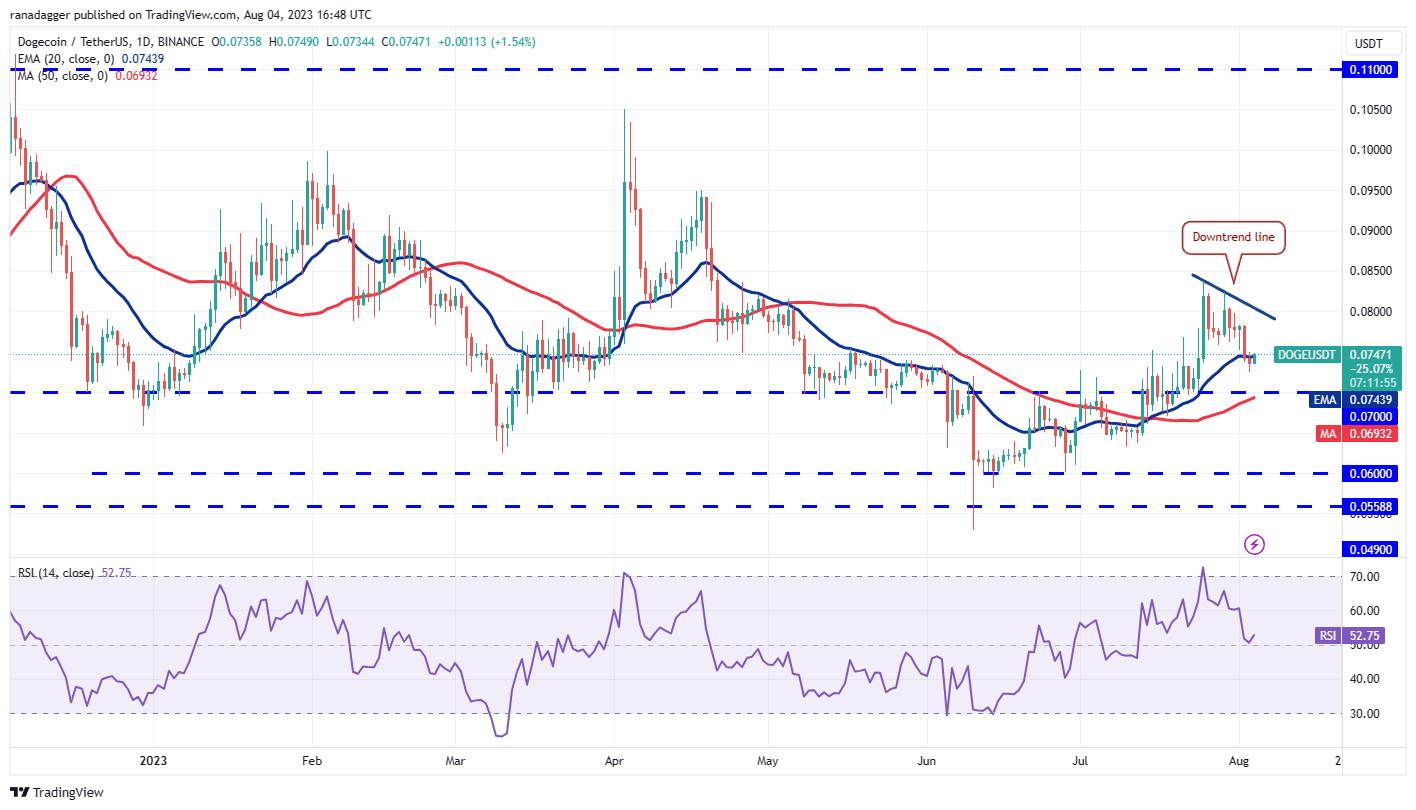
The bulls are trying to push the price back above the 20-day EMA on Aug. 4. If they succeed, the DOGE/USDT pair could rise to the downtrend line. This level is likely to attract selling by the bears.
If the price reverses direction from the downtrend line, it will signal that the trend is turning negative and the relief rallies are being sold. The bears will then again try to sink the price below the 20-day EMA and challenge the breakout level at $0.07.
On the other hand, a break and close above the downtrend line will suggest the start of a strong up move toward $0.10.
Cardano price analysis
Cardano (ADA) broke below the 20-day EMA ($0.30) on Aug. 2 and the 50-day SMA ($0.30) on Aug. 3. This suggests that the bears are trying to seize control.
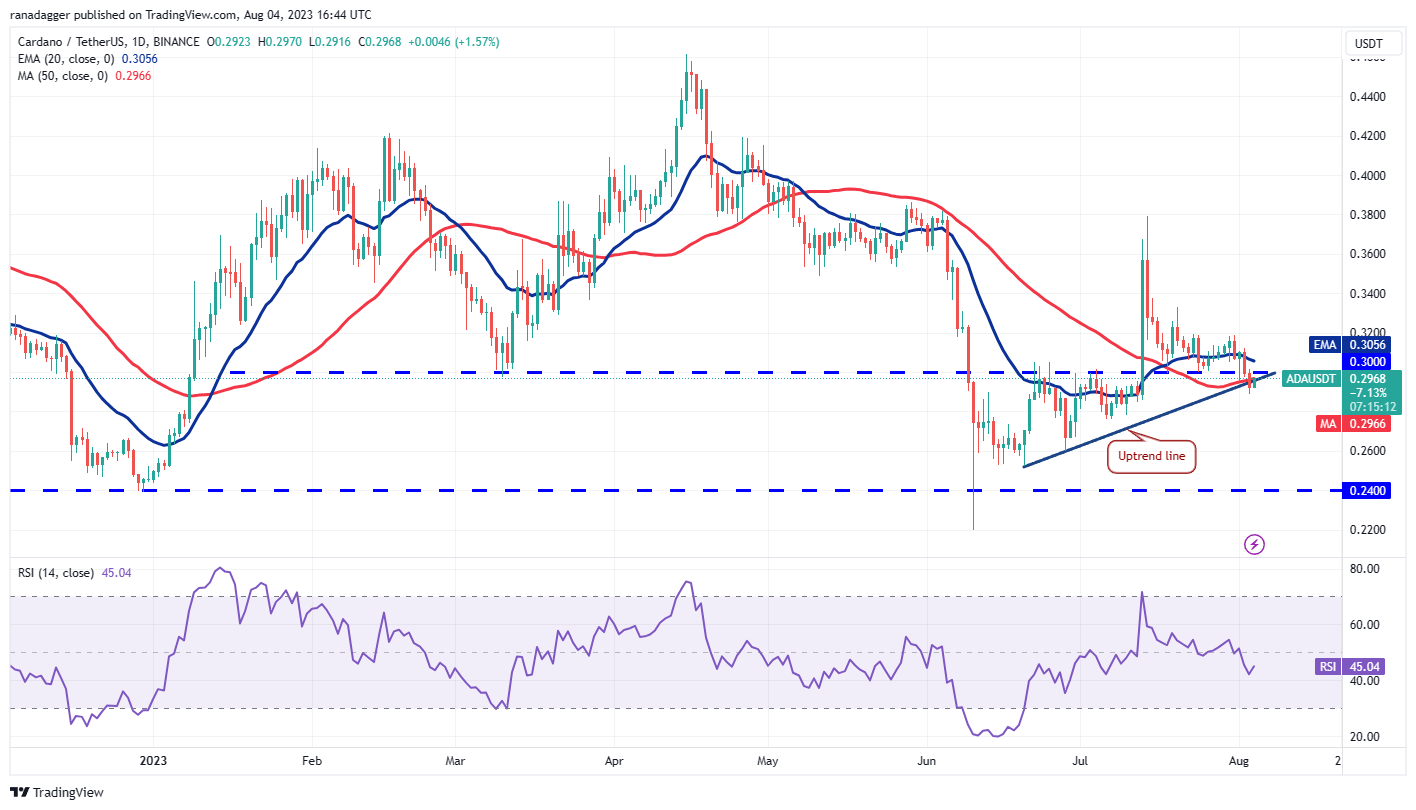
If the price sustains below the uptrend line, the selling may pick up and the ADA/USDT pair could plunge to $0.26 and then to the vital support at $0.24. The buyers are expected to guard this level with vigor.
If the bulls want to make a comeback, they will have to quickly drive the price above the moving averages and the overhead resistance at $0.32. The pair could then travel to $0.34 and eventually to $0.38.
Solana price analysis
Solana (SOL) rebounded off the strong support at $22.30 on Aug. 4, indicating that the bulls continue to protect this level with vigor.
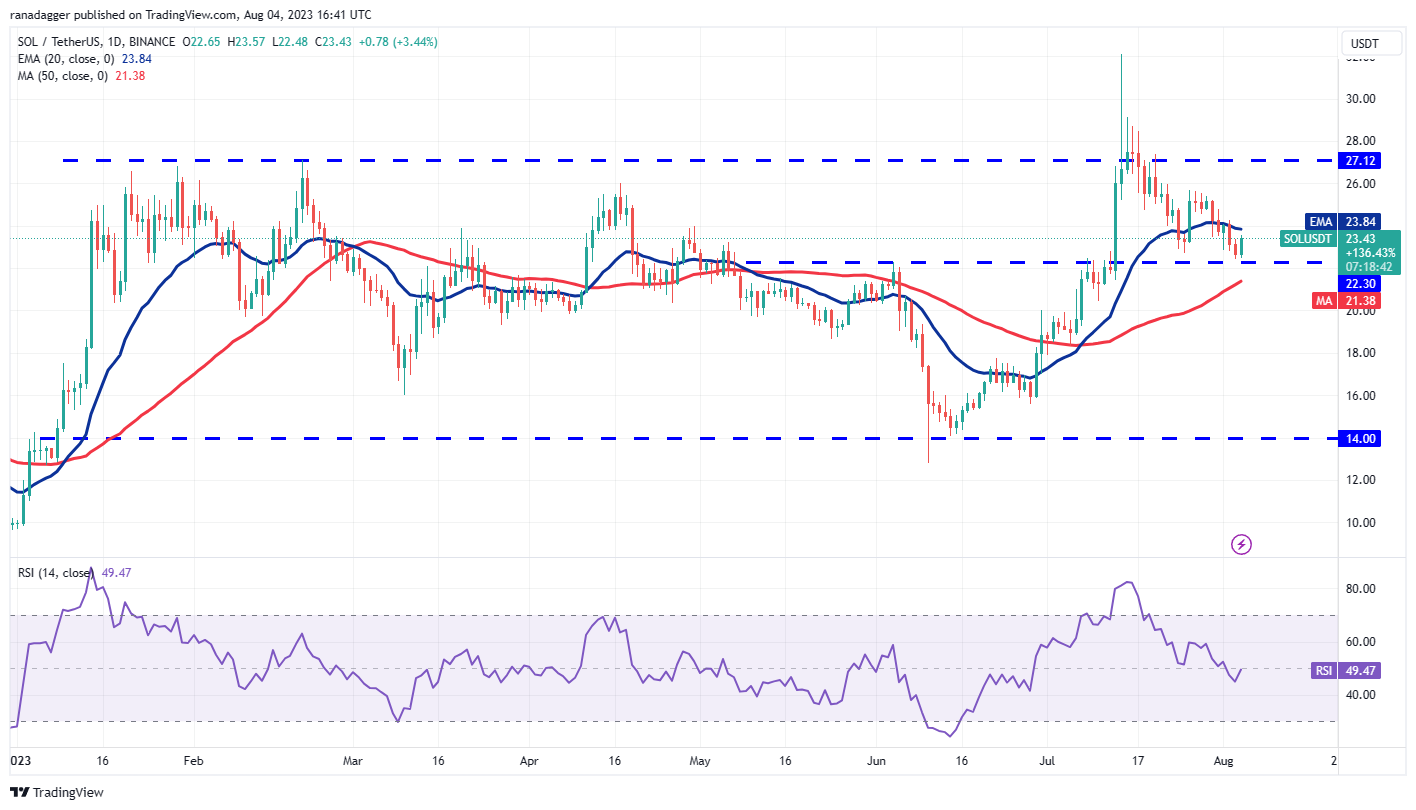
If the price rises above the 20-day EMA ($23.84), it will suggest that the SOL/USDT pair could march toward $25.68 and subsequently to $27.12. This remains the key resistance to watch for on the upside because a break above it will signal a potential new uptrend.
Meanwhile, the bears are likely to have other plans. They will try to sell the recovery to the 20-day EMA and sink the pair below the support zone between $22.30 and the 50-day SMA ($21.38). If they manage to do that, the pair may tumble to $18.
Related: Germany is dragging Europe’s economy down — and that’s great for crypto
Polygon price analysis
Polygon (MATIC) has been sliding since hitting the local high of $0.89 on July 13, which shows a lack of buying at lower levels.
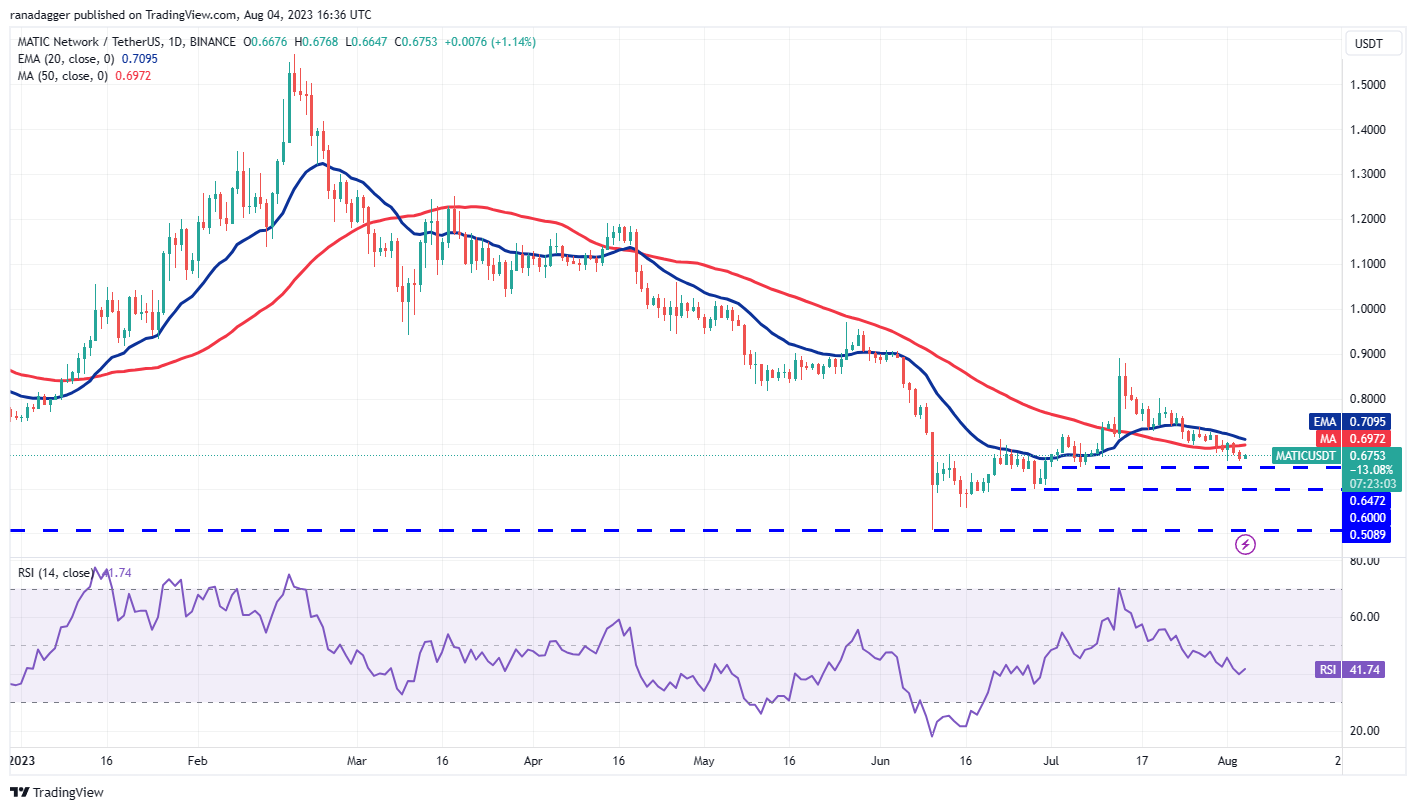
The MATIC/USDT pair has reached the support near $0.65, where the bulls are likely to mount a strong defense. If the price rebounds off the support and climbs above the moving averages, it will clear the path for a possible rise to $0.80.
On the contrary, if the price skids below $0.65, it will indicate that bears remain in command. The pair could next slump to the support at $0.60. This level may again attract strong buying by the bulls.
Litecoin price analysis
Litecoin’s (LTC) range resolved to the downside on Aug. 2, and that was followed by another fall on Aug. 3, which completed a 100% retracement of the rally that started from $82.91 on July 29.
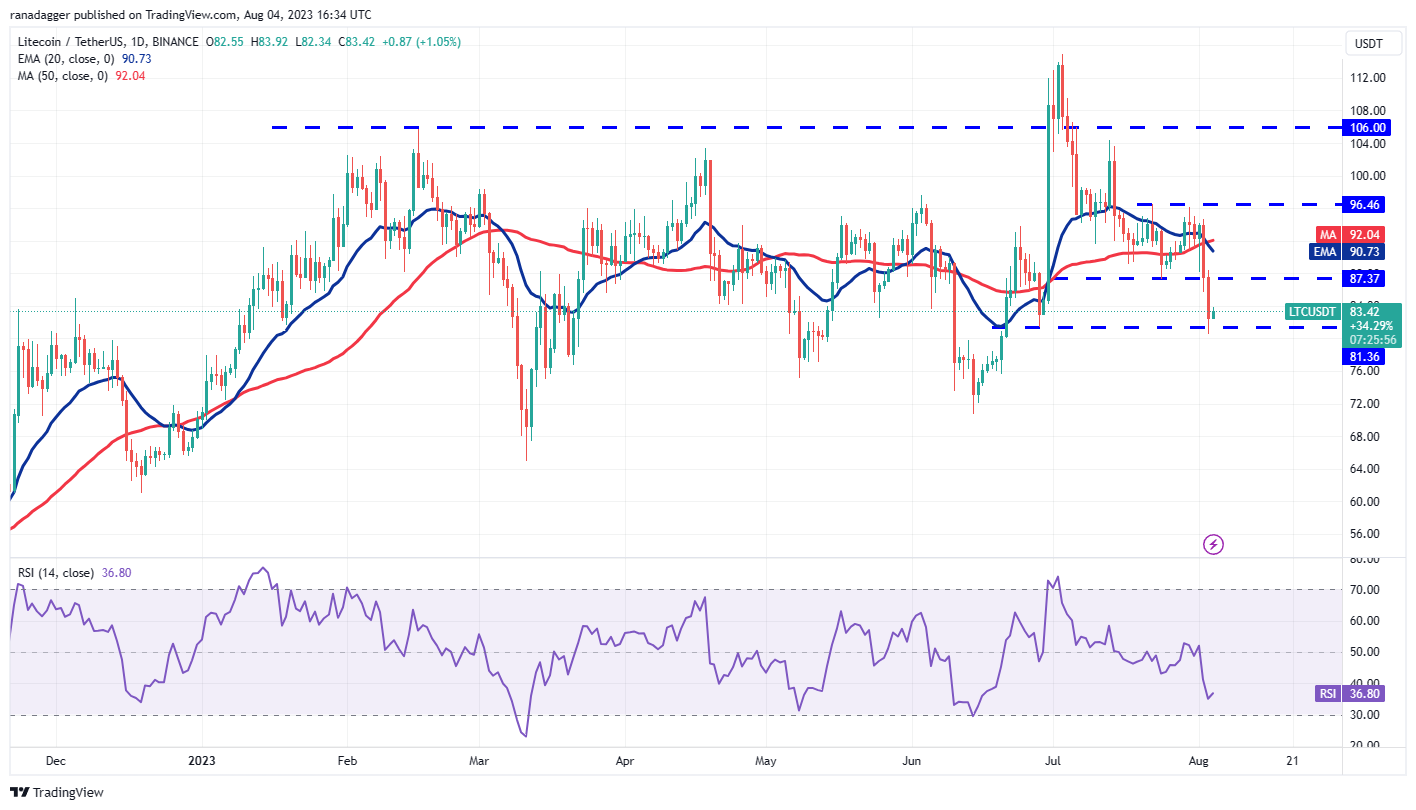
The bulls are trying to protect the support at $81.36, but the bears are unlikely to give up their advantage easily. If the price breaks below $81.36, the selling could intensify and the LTC/USDT pair may plummet to $76.
Alternatively, if the price rebounds off the current level, the pair may reach the overhead resistance at $87.37. A break above this level will suggest that the pair may remain range-bound between $81.36 and $96.46 for some time.
Polkadot price analysis
Polkadot (DOT) has been range-bound between $5 and $5.65 for the past several days. The price has reached the support of the range, which may witness a tough battle between the bulls and the bears.
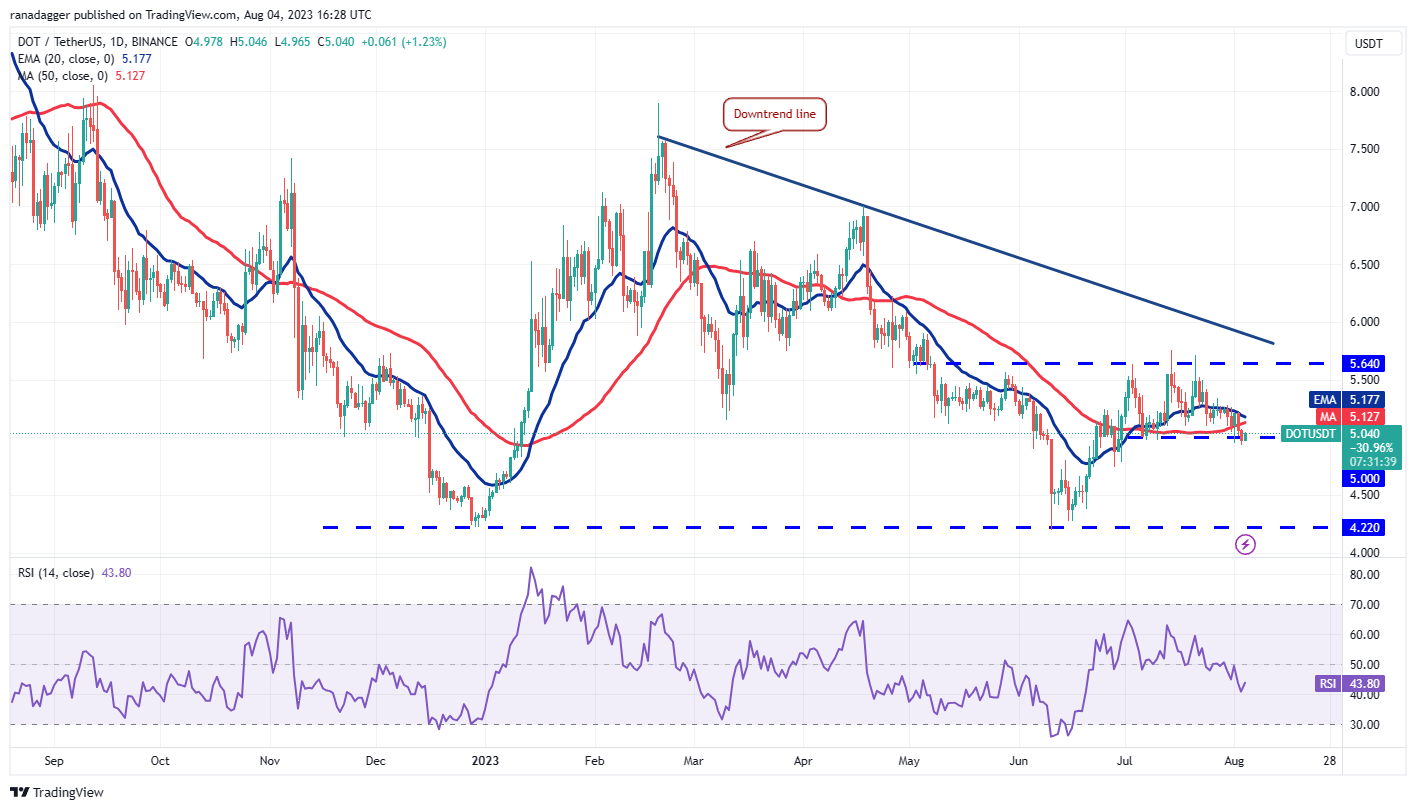
The 20-day EMA ($5.17) has started to turn down and the RSI is in the negative territory, indicating a minor advantage to the bears. If the price slides and sustains below $5, it may start a deeper pullback to $4.74 and then to $4.60.
Instead, if the price rebounds off the current level and breaks above the 20-day EMA, it will signal that the range remains intact. The DOT/USDT pair could then rise to $5.33 and thereafter to the overhead resistance at $5.64.
This article does not contain investment advice or recommendations. Every investment and trading move involves risk, and readers should conduct their own research when making a decision.

