
Tento príspevok bol pôvodne publikovaný na stránke https://cointelegraph.com/news/price-analysis-8-16-btc-eth-bnb-xrp-doge-ada-sol-matic-ltc-dot a autorom článku je Cointelegraph By Rakesh Upadhyay. Tento článok je iba kópia originálneho článku.
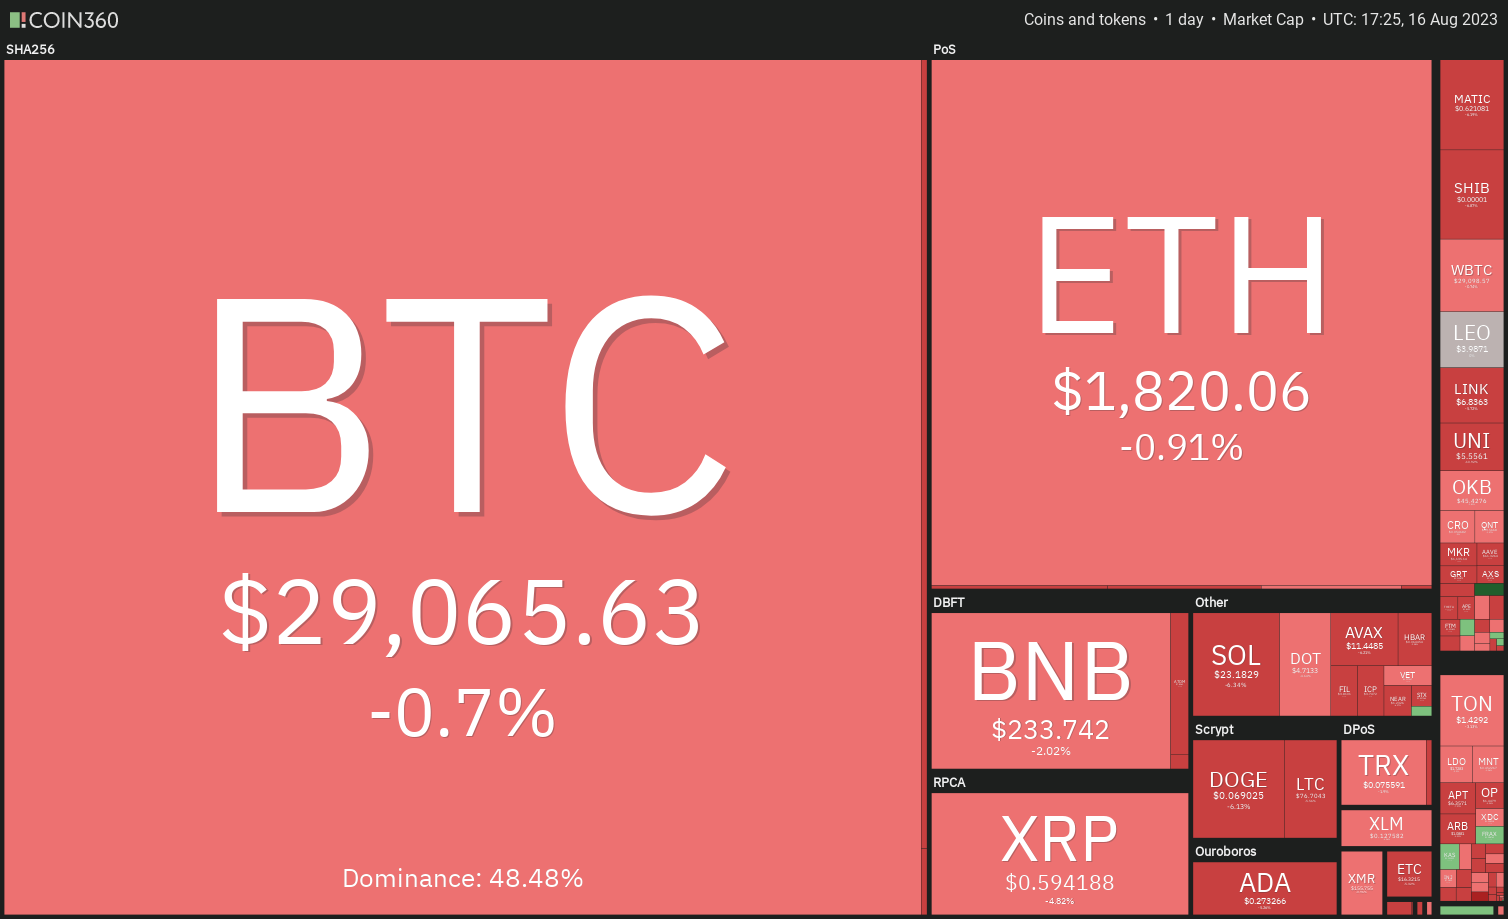
https://images.cointelegraph.com/cdn-cgi/image/format=auto,onerror=redirect,quality=90,width=840/https://s3.cointelegraph.com/uploads/2023-08/5ede84aa-36d1-4a90-b00c-59e0fc65b194.JPGMarkets continue to slump, giving advantage to the bears and hinting at a trend change to the downside.

Price Analysis
Bitcoin continues to trade inside a narrow range with no clear signs of a breakout from it. Trading platform QCP Capital said in its latest market update that Bitcoin (BTC) may remain quiet for a few more weeks before making its move in September.
Delphi Digital co-founder Kevin Kelly believes that the cryptocurrency markets are in the early stages of a new bull cycle. Based on a study of Bitcoin’s four-year cycle patterns, Kelly expects Bitcoin to hit a new all-time high by the fourth quarter of 2024 and a new cycle peak by Q4 2025.
Similarly, Bitcoin investor and author Jesse Myers also maintains a bullish view for the long term, but he does not expect Bitcoin to reach $100,000 before the next halving. Myers believes that the market will take 12-18 months after the halving to price in the effects.
Will Bitcoin and the major altcoins remain range-bound in the near term, or is a breakout on the horizon? What are the important levels to watch out for? Let’s study the charts of the top 10 cryptocurrencies to find out.
Bitcoin price analysis
Bitcoin rose above the 20-day exponential moving average EMA of $29,383 on Aug. 14, but the long wick on the candlestick shows selling at higher levels.
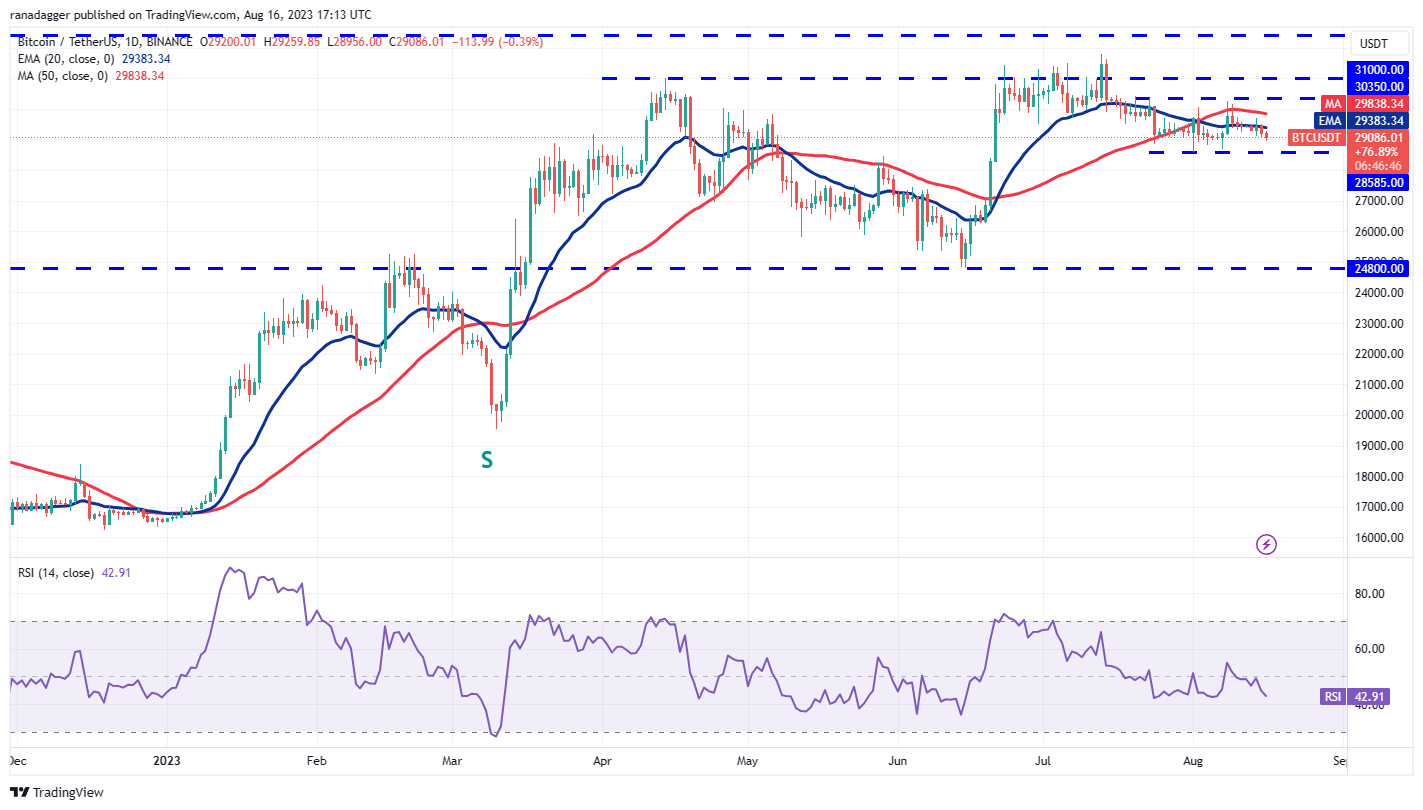
The BTC/USDT pair remains below the 20-day EMA, and the relative strength index (RSI) is in the negative territory. This suggests a minor advantage to the bears. The pair could slide to the important support at $28,585.
If the price rebounds off this level with strength and rises above the 20-day EMA, it will signal that the pair may continue to oscillate between $28,585 and $30,350 for some more time.
The bears will come out on top if they sink and sustain the price below $28,585. That could start a decline toward $26,000.
Ether price analysis
The failure to propel Ether (ETH) above the 20-day EMA ($1,847) in the past few days may have attracted selling. That has pulled the price to the critical short-term support at $1,816.
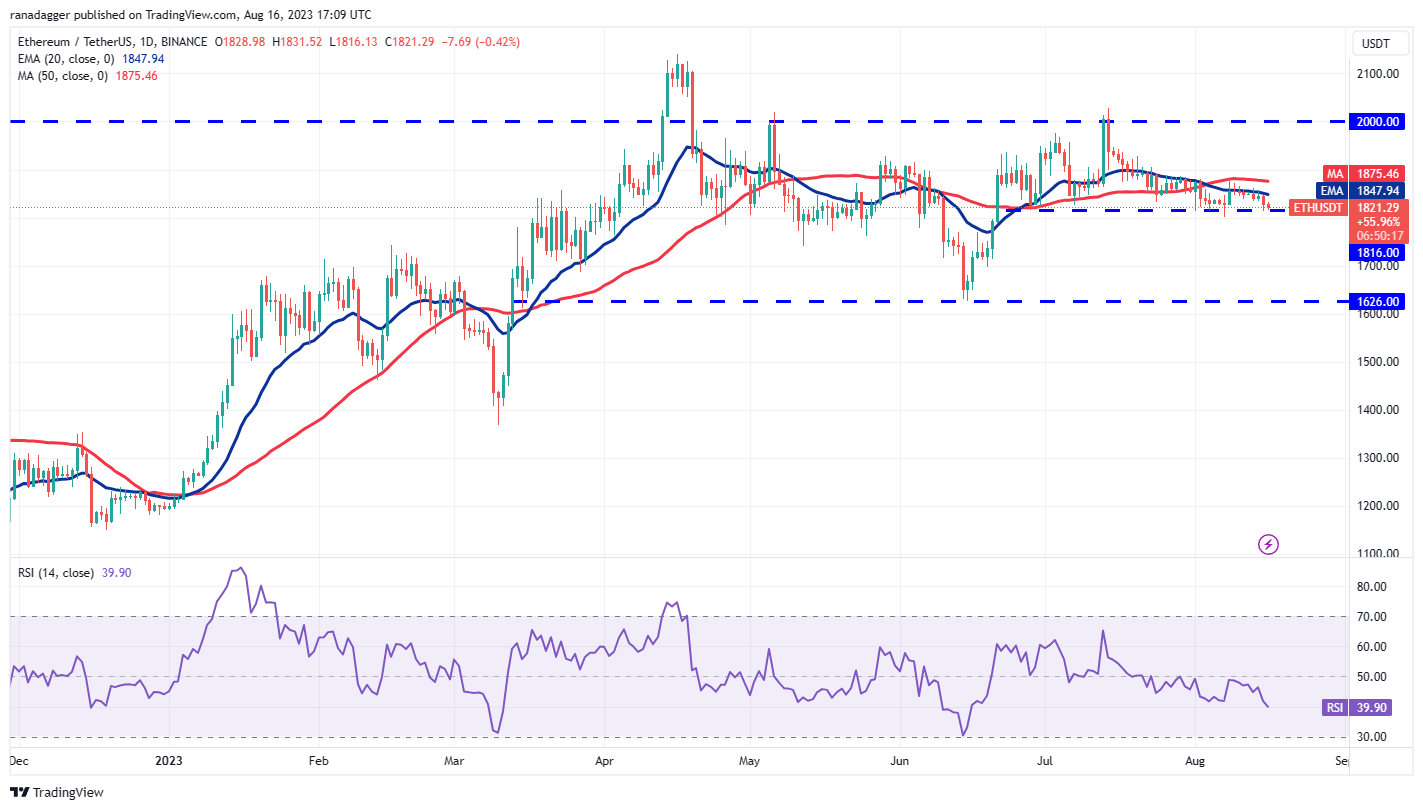
The 20-day EMA has started to turn down gradually, and the RSI is in negative territory. This suggests that bears have the upper hand. If the price skids and sustains below $1,816, the selling could intensify further and the ETH/USDT pair may drop to $1,700.
Time is running out for the bulls. If they want to salvage the situation, they will have to quickly drive the price above the 50-day simple moving average (SMA) of $1,875. If they do that, the pair may start its journey toward $1,930 and then $2,000.
BNB price analysis
BNB (BNB) turned down and plunged below the support line of the symmetrical triangle pattern on Aug. 15. This shows that the uncertainty between the bulls and the bears resolved to the downside.
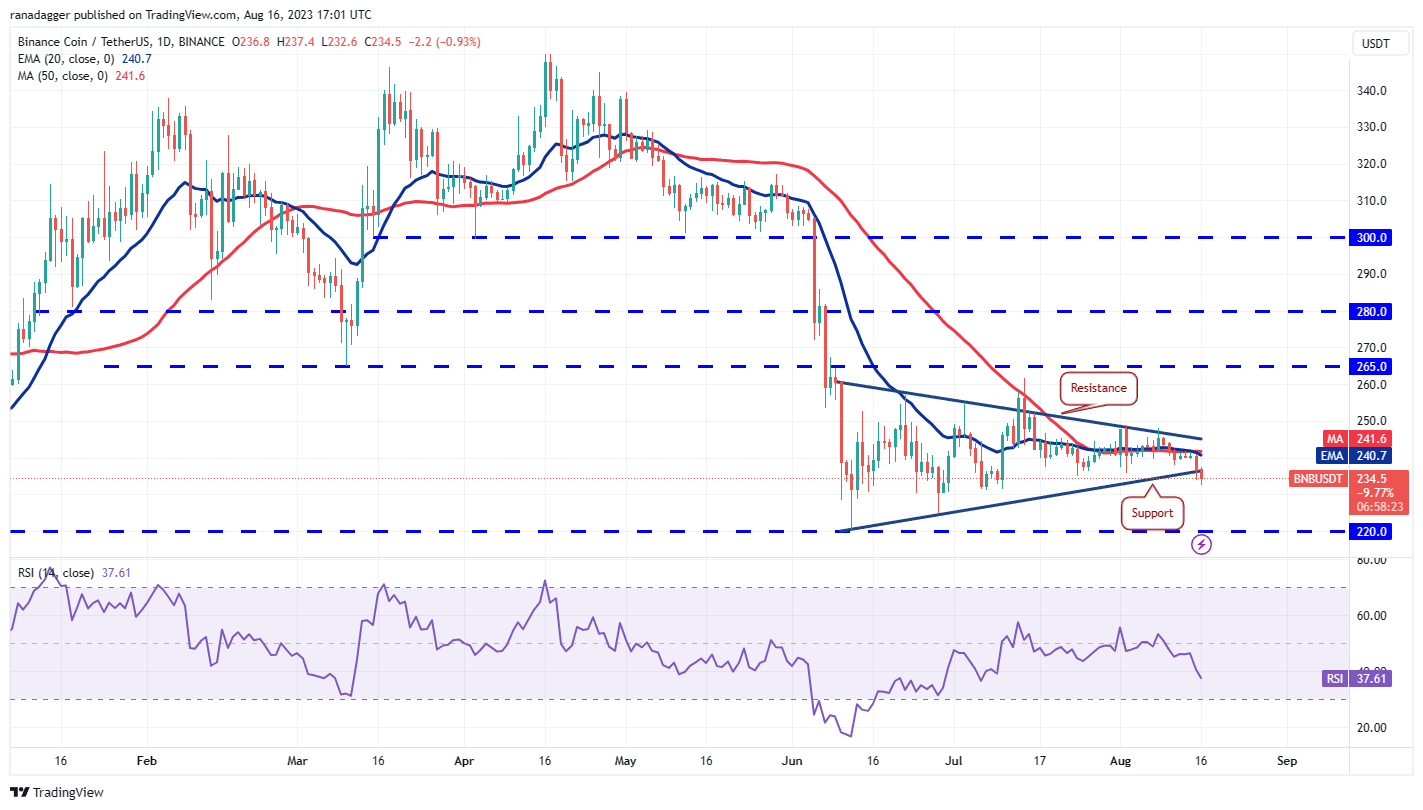
If the price sustains below the triangle, the BNB/USDT pair could drop to the vital support at $220. This level is likely to attract aggressive buying by the bulls. If the price rebounds off this level and rises above the moving averages, it will indicate that the pair may continue to swing between $265 and $220 for a while longer.
Alternatively, if the price continues lower and breaks below the $220 support, it will indicate the resumption of the downtrend. The pair may then slump to the pattern target of $196.
XRP price analysis
XRP (XRP) broke and closed below the 50-day SMA ($0.62) on Aug. 15, signaling that the bears remain in control.
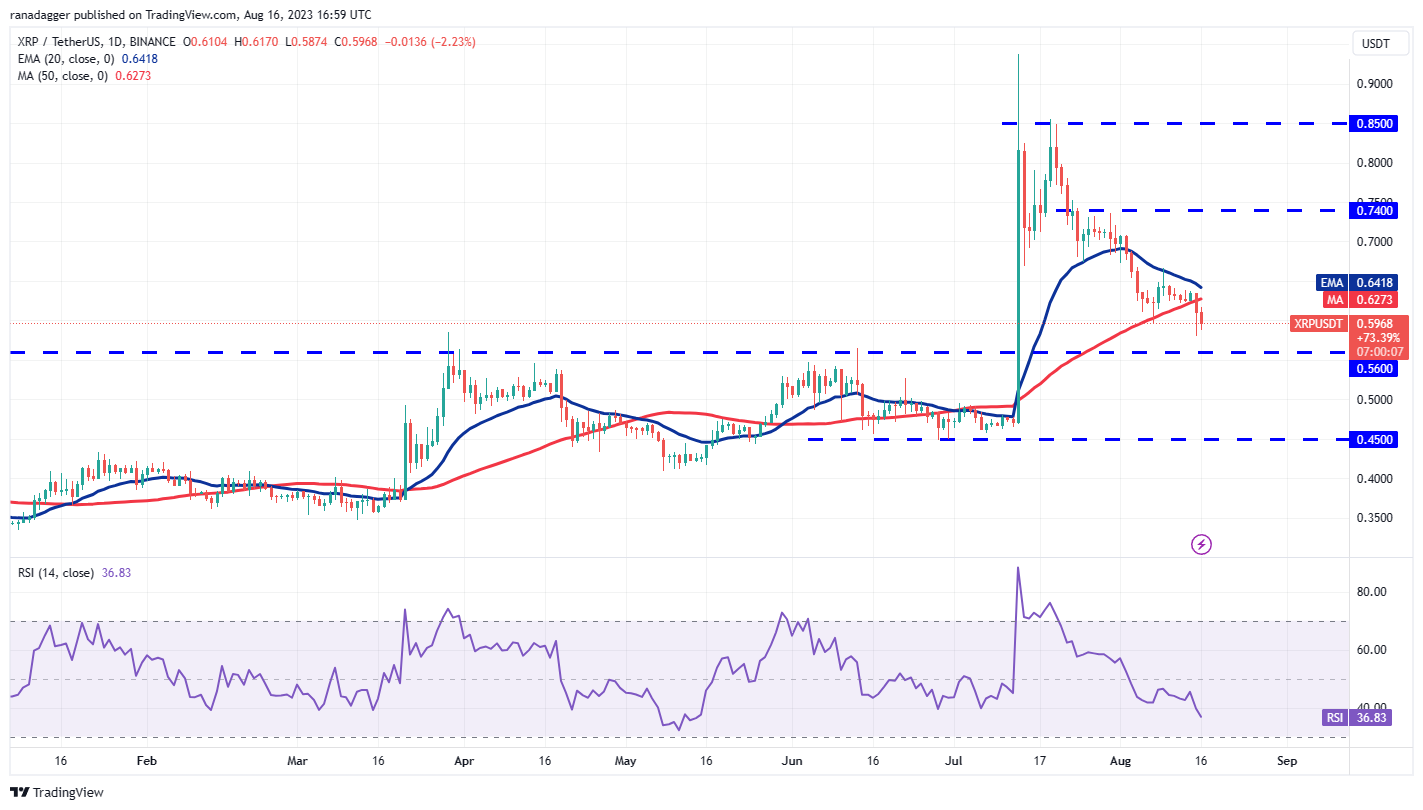
The XRP/USDT pair could descend to the breakout level of $0.56. This remains the key level for the bulls to defend because if this support gives way, the selling could pick up and the pair may dive to $0.45.
Contrarily, if the price rebounds off $0.56, it will suggest that the bulls are trying to flip the level into support. Buyers will have to overcome the barrier at the moving averages to start a stronger recovery to $0.74.
Dogecoin price analysis
The bears yanked Dogecoin (DOGE) below the support line of the ascending channel pattern on Aug. 15, which tilted the advantage in favor of the bears.
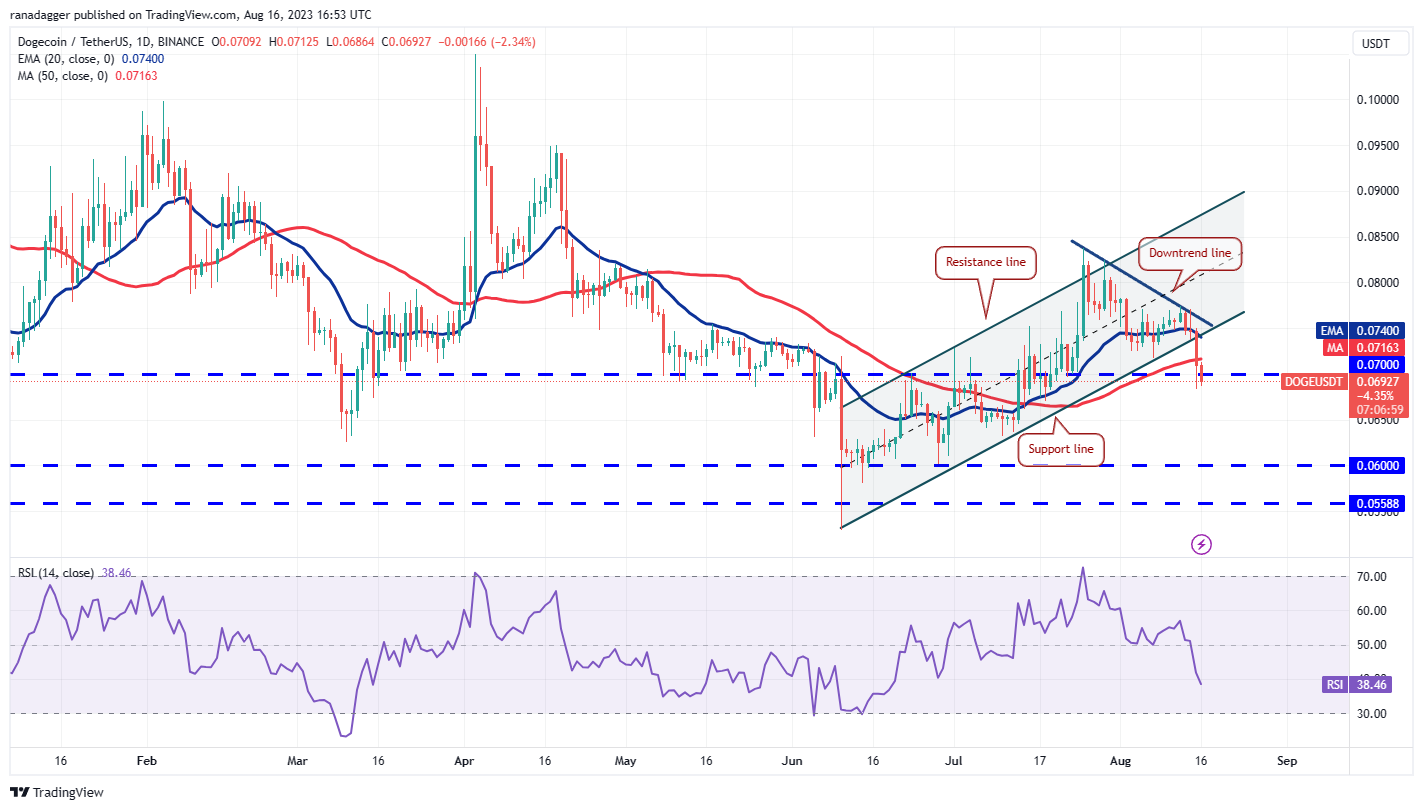
The bulls are likely to guard the breakout level of $0.07. If the price rebounds off this level, the DOGE/USDT pair may climb to the 20-day EMA ($0.07) and later to the downtrend line. If the price turns down from this resistance, it will increase the likelihood of a drop below $0.07. If that happens, the pair could nosedive to $0.06.
If bulls want to prevent a collapse, they will have to quickly push the price back above the downtrend line. If they succeed, the pair may rally to $0.08.
Cardano price analysis
Cardano (ADA) continues to fall inside a descending channel pattern. This shows that the bears remain firmly in the driver’s seat.
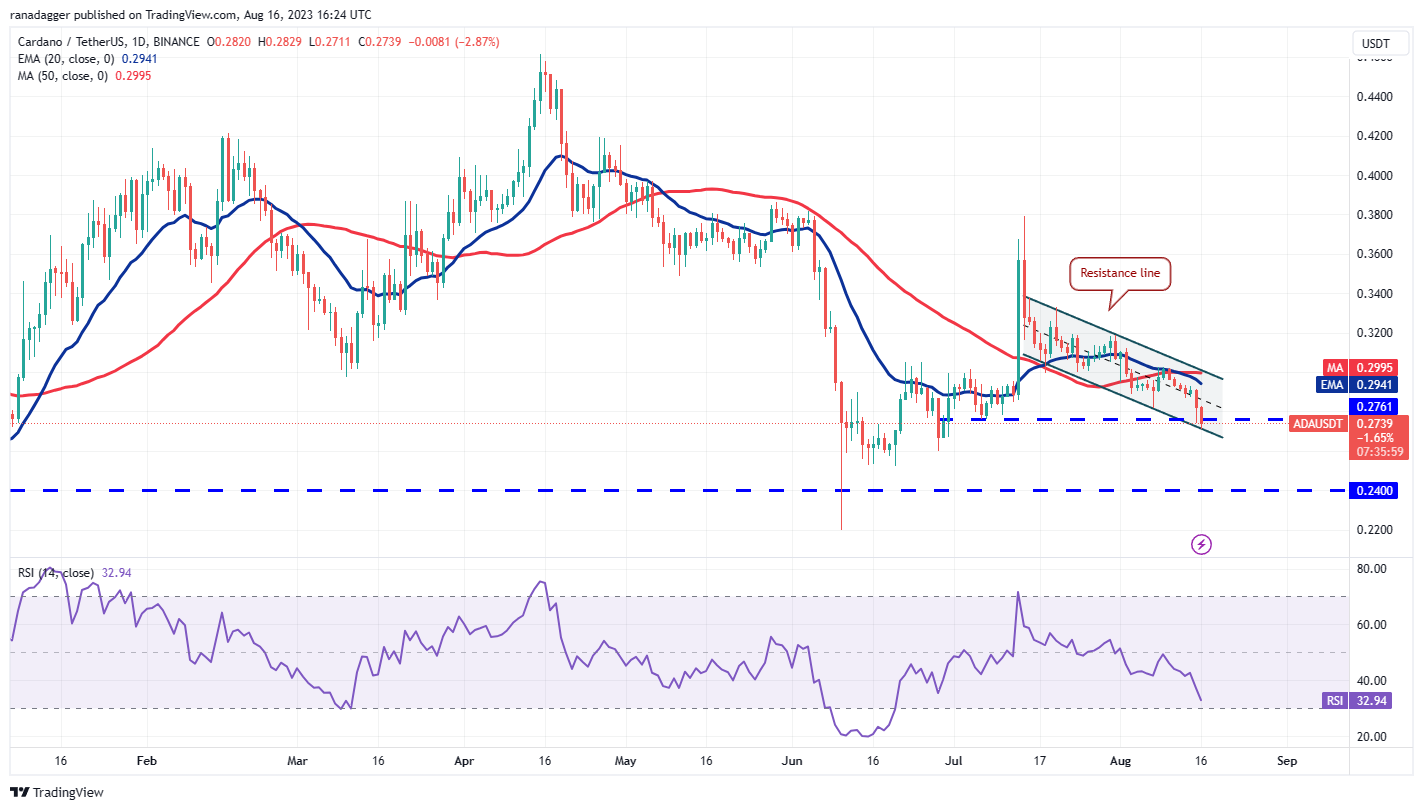
The ADA/USDT pair has reached the support line of the channel. If this support gives way, the pair could tumble to $0.26 and subsequently to $0.24. The bulls are expected to guard this level with all their might because if this support crumbles, the pair could resume the downtrend.
This negative view will be invalidated in the near term if the price turns up from the current level and rises above the channel. That may open the doors for a relief rally to $0.34.
Solana price analysis
Solana (SOL) turned down and slipped below the 20-day EMA ($23.99) on Aug. 15. The bears are trying to build upon this by sustaining the price below the 50-day SMA ($23.20).
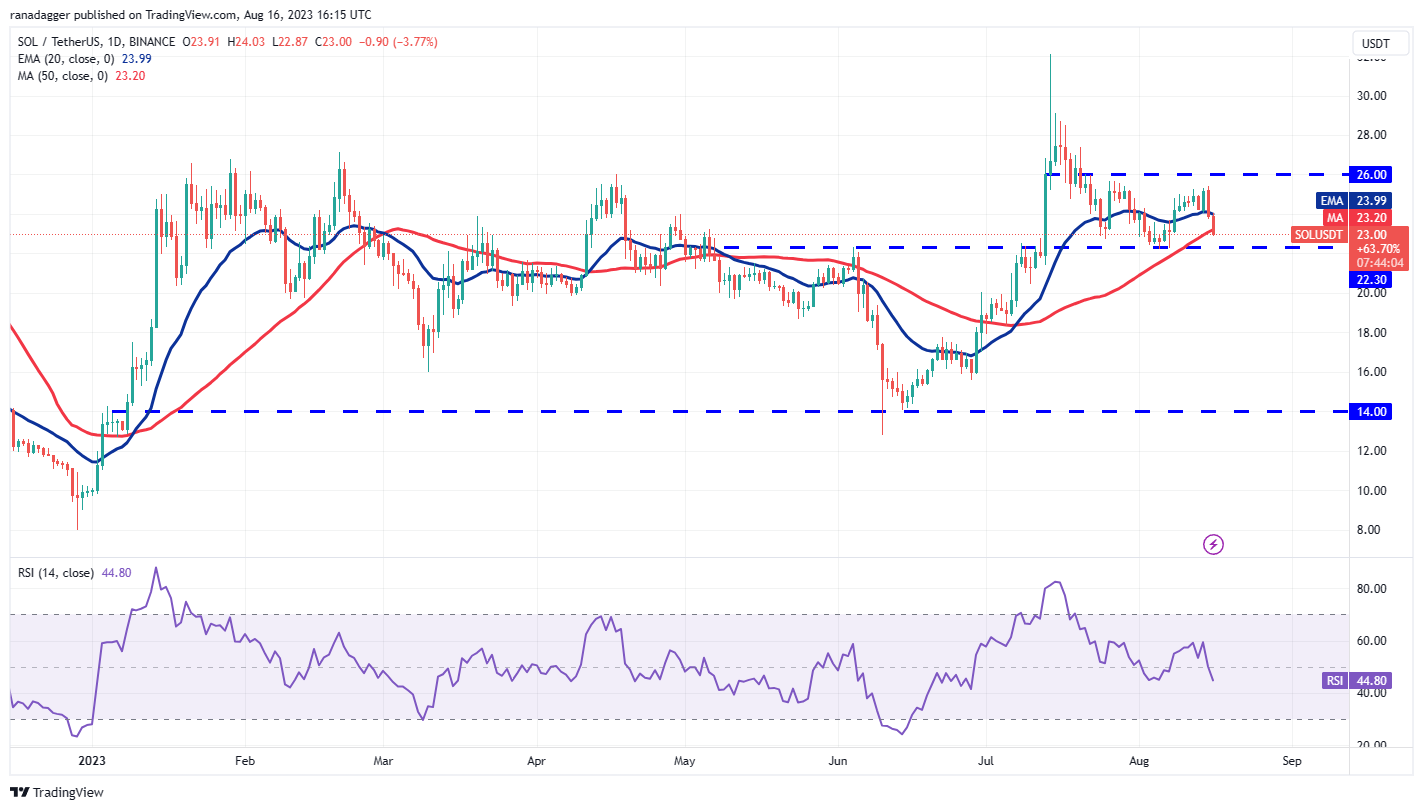
The SOL/USDT pair could skid to the vital support at $22.30. If the price bounces off this level, the pair may face strong selling at the moving averages. If the price turns down from the moving averages, it will enhance the prospects of a fall below $22.30. The pair may then tumble to $18.
Contrarily, if the price turns up and breaks above the 20-day EMA, it will suggest that the $26 to $22.30 range remains intact. The pair could then gradually climb to the overhead resistance at $26. A break and close above this level will suggest that the bulls are on a comeback.
Related: Why is Litecoin’s price down today?
Polygon price analysis
The repeated failure of the bulls to propel Polygon (MATIC) above the 20-day EMA ($0.68) may have intensified selling. That pulled the price below the support near $0.65 on Aug 15. The next support to look for on the downside is $0.60.
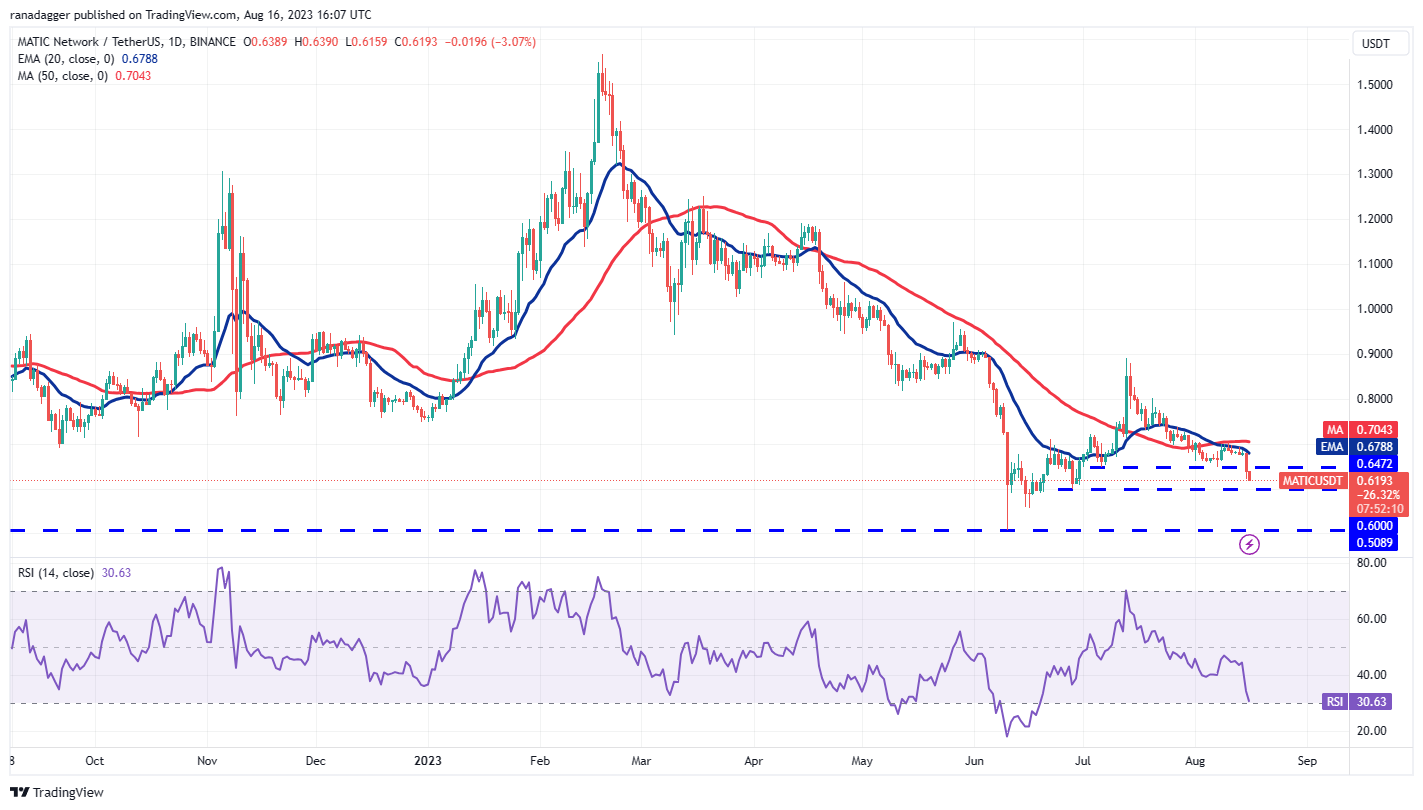
The RSI is nearing the oversold levels, indicating that the selling may have been overdone in the near term. Buyers will try to start a rebound that could reach $0.65 and then the 50-day SMA ($0.70).
If the price turns down from the overhead resistance, it will signal that bears have the upper hand. That could increase the likelihood of a drop below $0.60. The pair may then nosedive toward $0.50.
If the bulls want to make a comeback, they will have to kick and sustain the price above the moving averages.
Litecoin price analysis
Litecoin (LTC) tumbled and closed below the strong support at $81.36 on Aug. 15, indicating that the bears are in command.
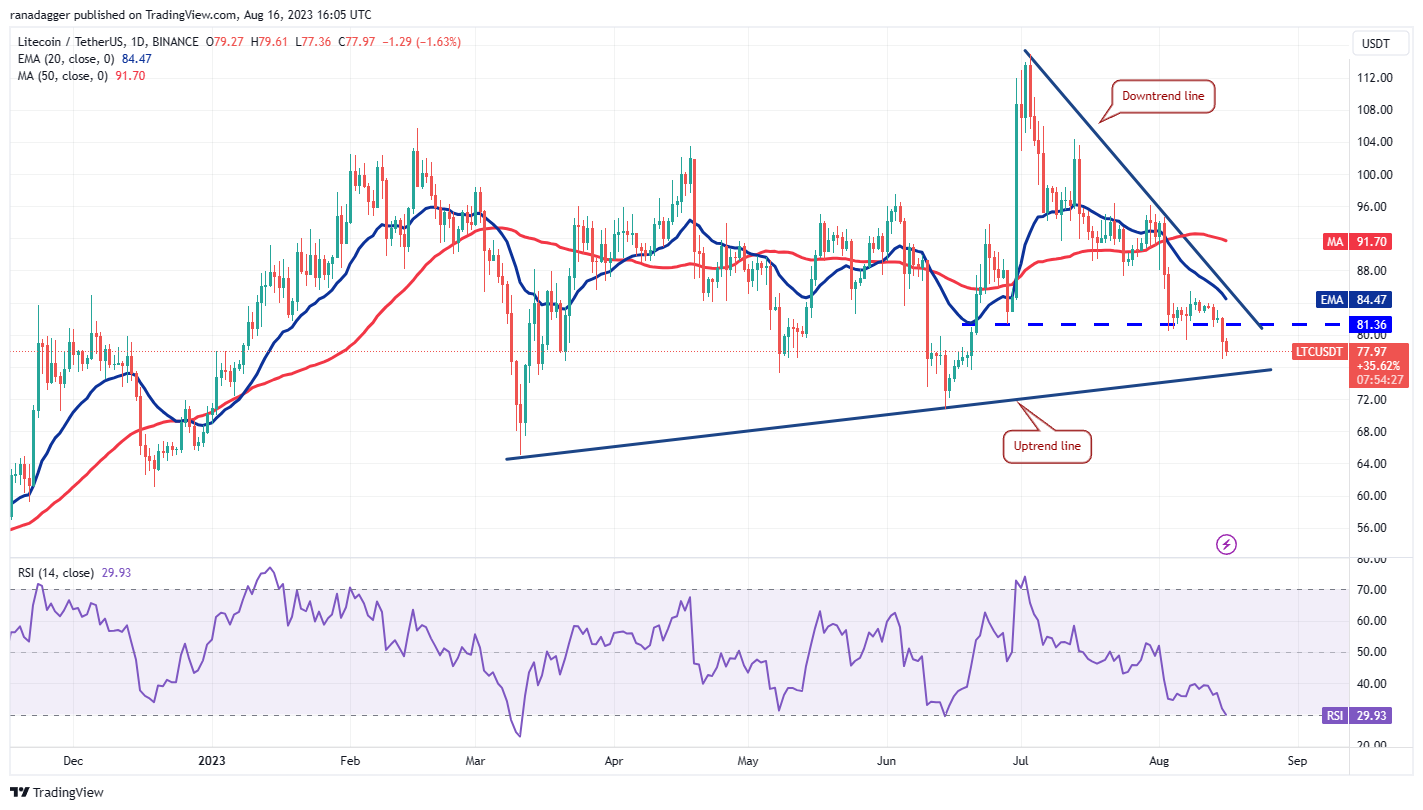
The RSI is in the oversold territory, indicating that a consolidation or a bounce may be around the corner. The bulls may try to defend the uptrend line. If the price snaps back from this level, it could face selling at $81.36 and then again at the downtrend line.
If the LTC/USDT pair turns down from the overhead obstacle, it will indicate that the sentiment remains negative and traders are selling on rallies. That will increase the possibility of a drop to $70.
The first sign of strength will be a break and close above the downtrend line. That could clear the path for a possible rally to the 50-day SMA ($91.70).
Polkadot price analysis
The failure of the bulls to achieve a strong bounce off the $5 support in Polkadot (DOT) may have attracted selling by the bears. That tugged the price below the support on Aug. 15.
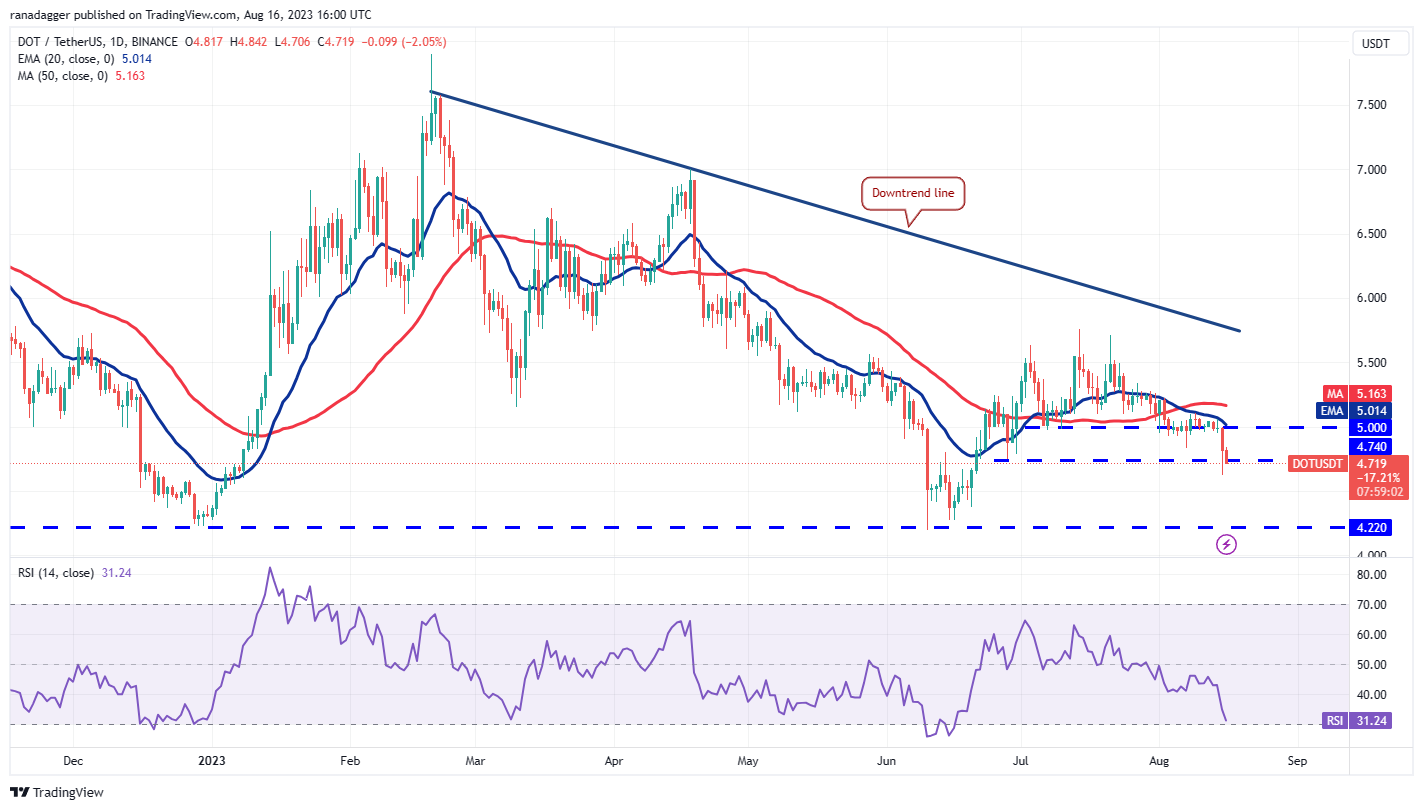
The bulls purchased the dip below the next support at $4.74, but they are struggling to sustain the recovery. This suggests that the bears continue to sell on every minor relief rally. If the price continues lower and dips below $4.60, it will suggest that the DOT/USDT pair is in a firm bear grip. That could result in a decline to $4.22.
Buyers are likely to fiercely defend the zone between $4.22 and $4.37. On the upside, the bulls will have to thrust the price above the 50-day SMA ($5.16) to signal a comeback. The pair could then surge to the downtrend line.
This article does not contain investment advice or recommendations. Every investment and trading move involves risk, and readers should conduct their own research when making a decision.

