Tento príspevok bol pôvodne publikovaný na stránke https://cointelegraph.com/news/price-analysis-1-28-btc-eth-bnb-ada-sol-xrp-luna-doge-dot-avax a autorom článku je Cointelegraph By Rakesh Upadhyay. Tento článok je iba kópia originálneho článku.
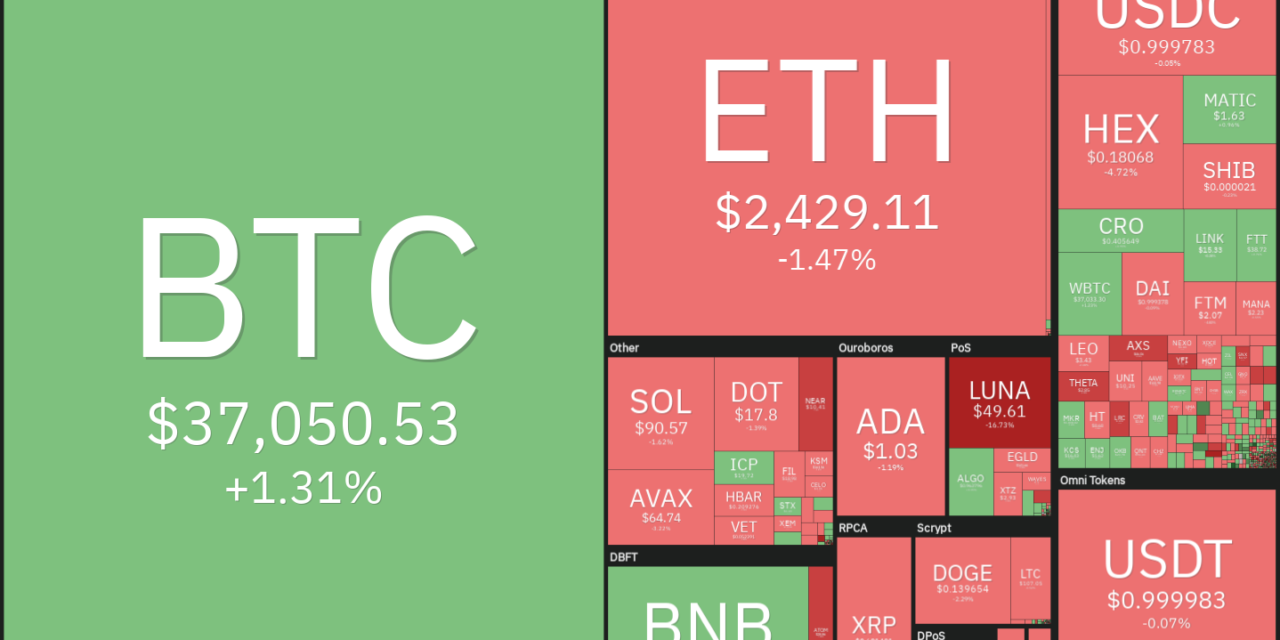
https://images.cointelegraph.com/images/840_aHR0cHM6Ly9zMy5jb2ludGVsZWdyYXBoLmNvbS91cGxvYWRzLzIwMjItMDEvZWUzNmRmMDEtZTY5OC00M2NlLWJiZjItZjQyNDcxYTgzZjA3LmpwZw==.jpgBitcoin (BTC) and most major altcoins are turning down from overhead resistance levels, indicating that the sentiment remains negative and traders are selling on every available opportunity.
Decentrader analyst Philip Swift said that the on-chain spent profit output ratio (SOPR) metric, which aggregates the price of purchase versus price sold during a given period, indicates that traders are selling their Bitcoin holdings for a loss.
Another metric that is worrying traders is the funding rates, which has further slipped into the negative territory following comments by the U.S. Federal Reserve. Crypto research firm Delph Digital expects Bitcoin to “make a lower low after recently testing the $34K level.”
Among several bearish projections, there was an uber bullish long-term forecast by Cathy Wood’s Ark Invest. The report projected Bitcoin’s price to cross $1 million by 2030 and Ether to reach between $170,000 to $180,000 during the same period.
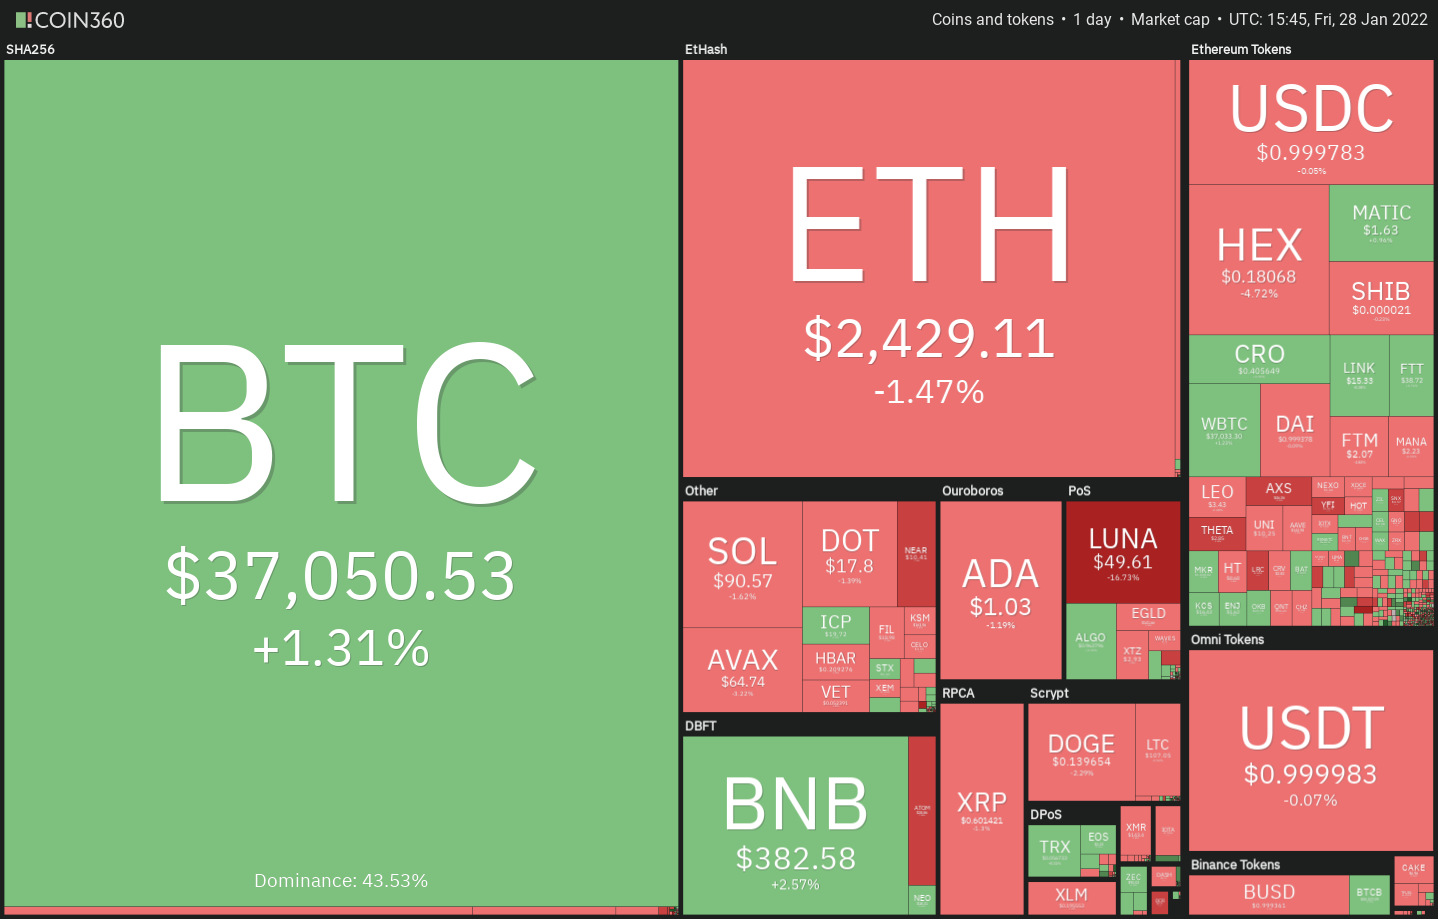
Could Bitcoin and most major altcoins bottom out near current levels? Let’s study the charts of the top-10 cryptocurrencies to find out.
BTC/USDT
Bitcoin is facing stiff resistance in the overhead zone between $37,332.70 to $39,600. This suggests that bears are unwilling to let go of their advantage and are selling on rallies.
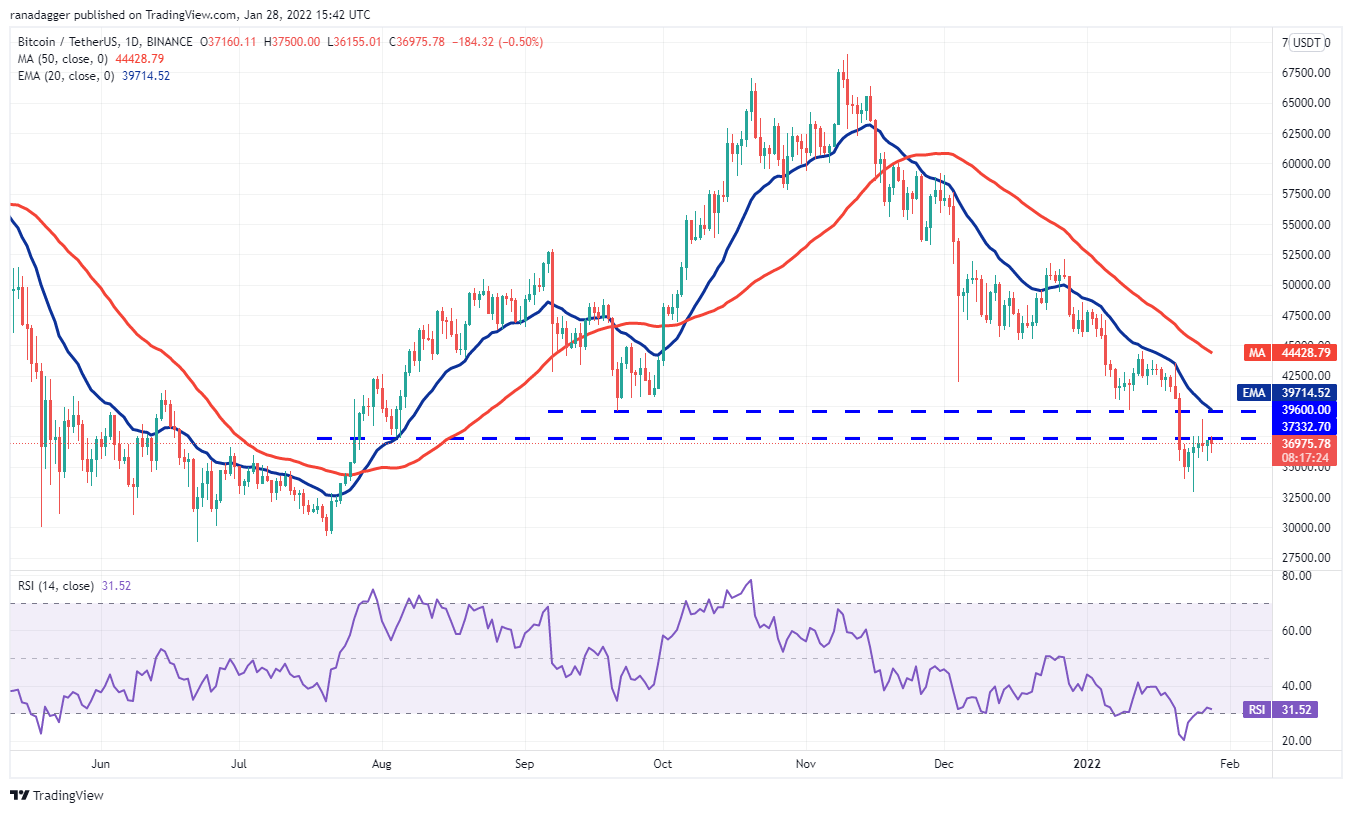
The pullback of the past few days has resolved the oversold levels in the relative strength index (RSI). The bears will now attempt to resume the downtrend by pulling the BTC/USDT pair below $32,917.17. If they succeed, the next stop could be $30,000.
Alternatively, if the price turns up from the current level and rises above $37,332.70, it will suggest accumulation at lower levels.
The buyers will then attempt to push the price above the 20-day exponential moving average ($39,714) and challenge the 50-day simple moving average ($44,428). A break and close above this resistance will signal that the downtrend could be over.
ETH/USDT
Ether (ETH) surged above the overhead resistance at $2,652 on Jan. 26 but the bears sold aggressively at higher levels and pulled the price back below the channel.
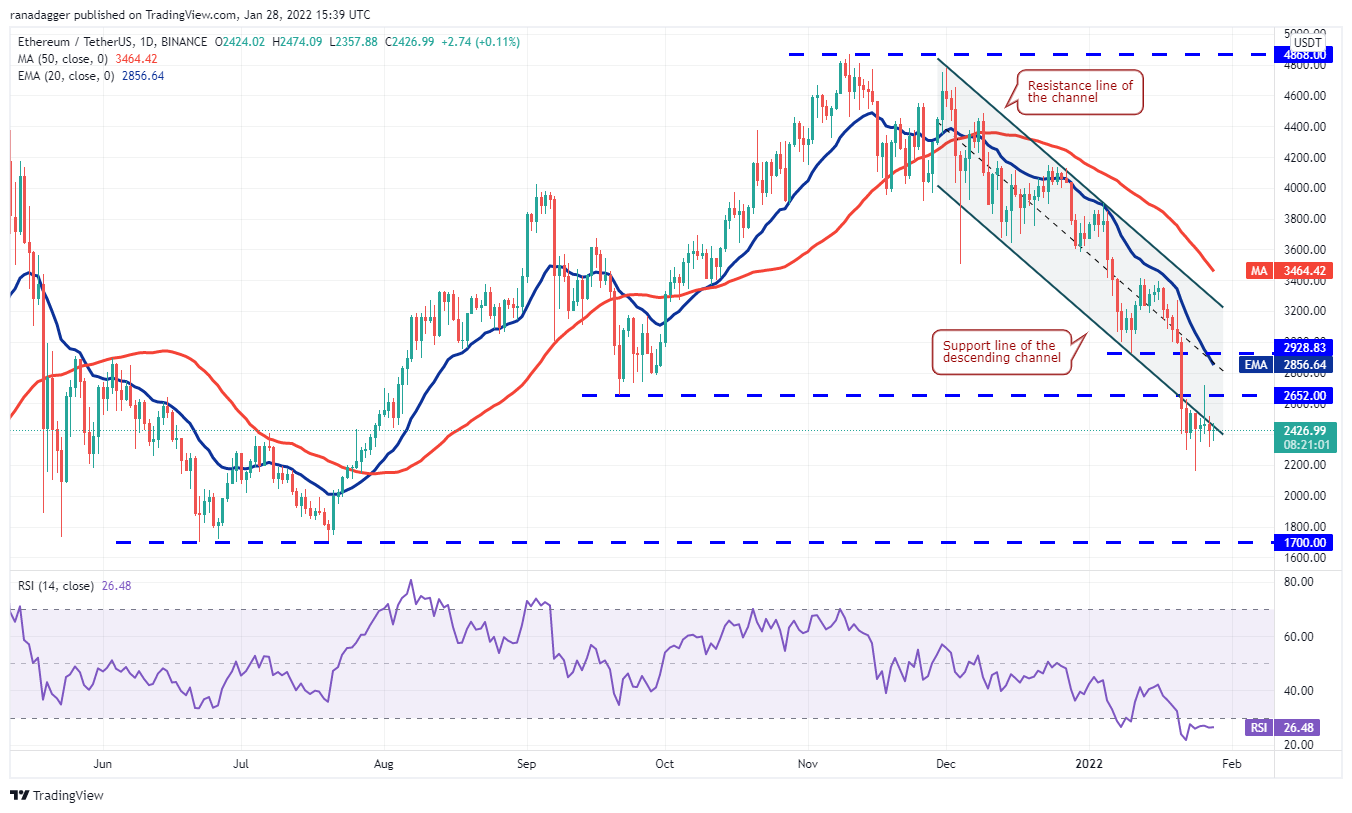
Since then, buyers have struggled to push the price back inside the channel. The bears will now try to resume the downtrend by pulling the price below the Jan. 24 intraday low at $2,159. If they succeed, the ETH/USDT pair could drop to $2,000 and then to $1,700.
The RSI is stuck inside the oversold zone for the past few days, suggesting that the selling may have been overdone in the near term. Therefore, the bulls may again attempt a relief rally, which could reach the 20-day EMA ($2,856).
This is an important hurdle for the bulls to cross because the previous three relief rallies had turned down from the 20-day EMA.
BNB/USDT
Binance Coin (BNB) rebounded off the $330 support and re-entered the descending channel on Jan. 25 but the bulls are struggling to push the price toward the 20-day EMA ($424). This suggests a lack of demand at higher levels.
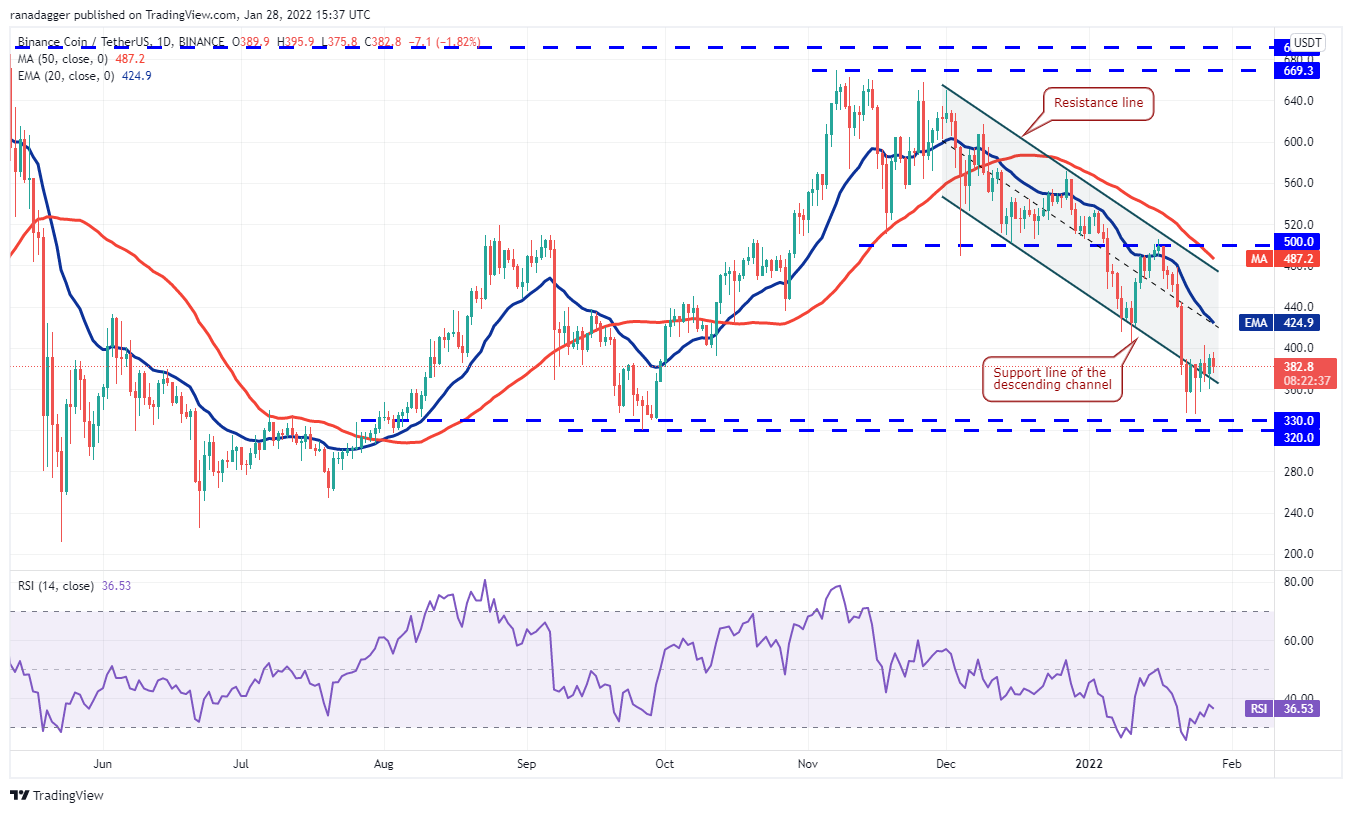
The bears will sense an opportunity and try to pull the price back toward the strong support zone at $330 to $320. This is an important zone for the bulls to defend because if it cracks, the BNB/USDT pair could plummet to $250.
Contrary to this assumption, if the price rises from the current level, the bulls will try to thrust the pair above the 20-day EMA. If they succeed, the pair could rally to the resistance line of the channel. A break and close above the channel will signal that the downtrend could be over.
ADA/USDT
Cardano (ADA) has been trading near the psychological support at $1 for the past few days. This suggests that bulls are defending the support but have failed to push the price higher.
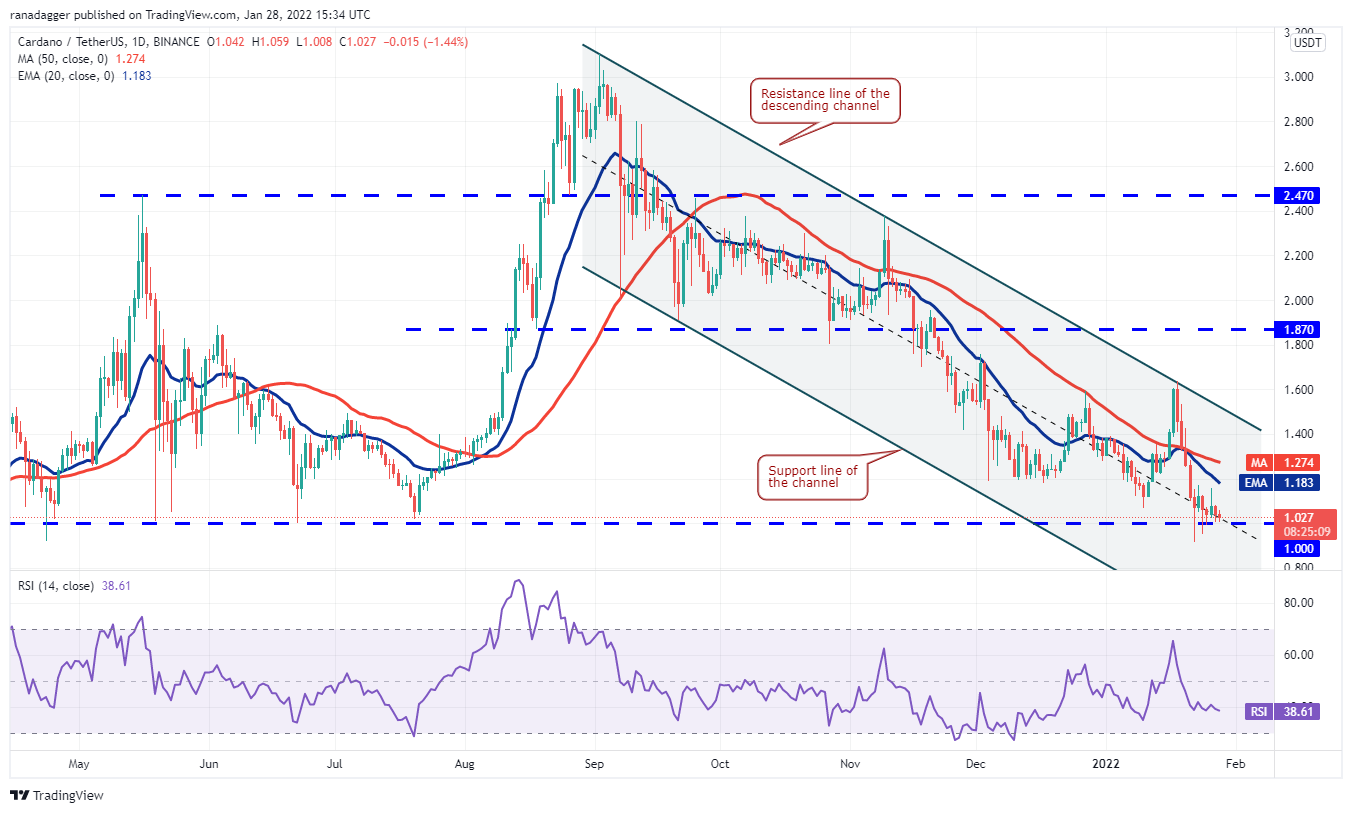
The downsloping moving averages and the RSI in the negative territory suggest that the path of least resistance is to the downside. If bears sink and sustain the price below $1, the ADA/USDT pair could drop to $0.80.
This negative view will invalidate in the short term if the price bounces off the current level and breaks above the moving averages. The pair could then test the resistance line of the channel. The bulls will have to clear this barrier to signal a possible change in trend.
SOL/USDT
Solana (SOL) has been trading close to the support line of the descending channel for the past few days. This suggests that bulls are defending the support line but haven’t been able to achieve a strong rebound off it.
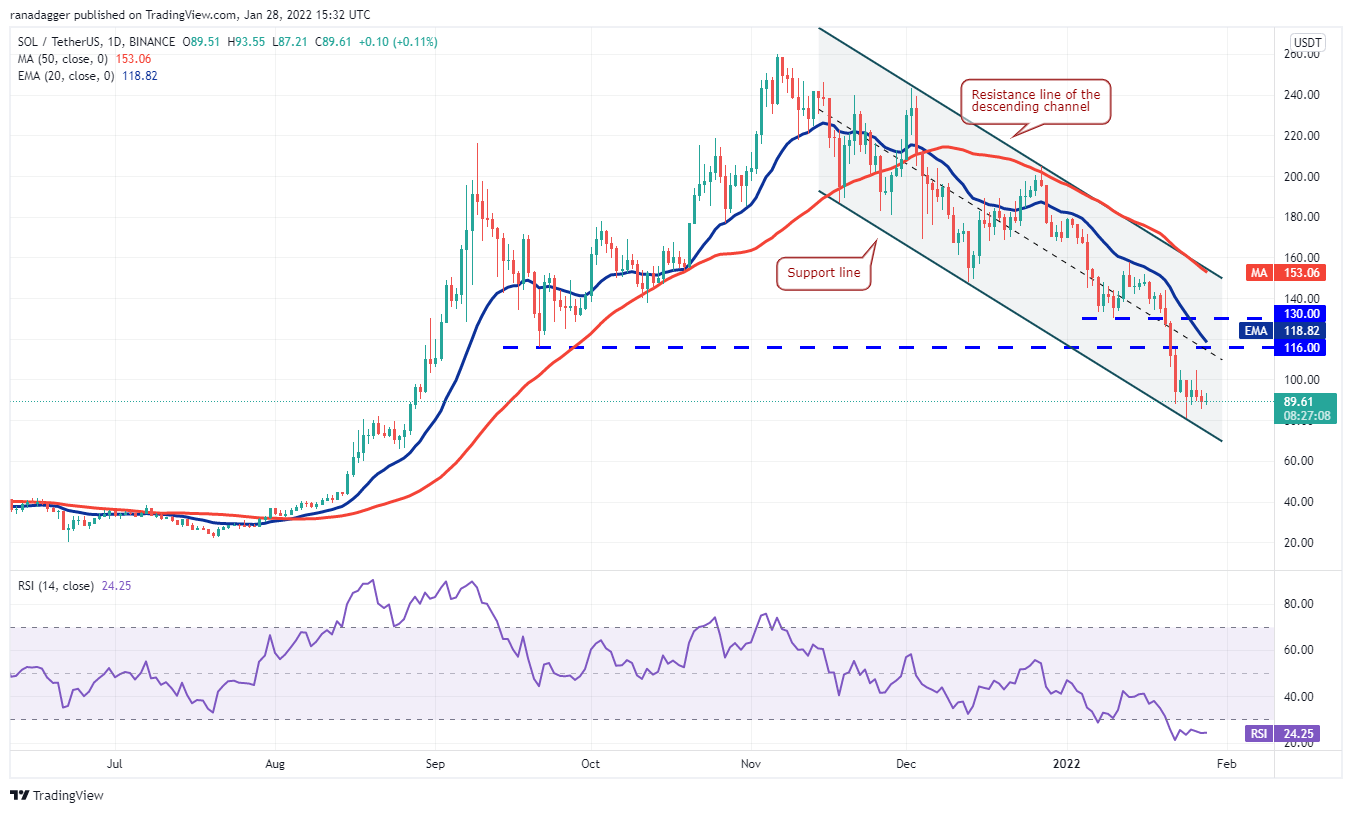
The RSI has been trading in the oversold territory for the past few days, signaling that the correction may have been overdone in the short term. This indicates the possibility of a consolidation or minor pullback in the next few days.
If that happens, the SOL/USDT pair could rise to the 20-day EMA ($118). A break and close above this level could clear the path for a possible rally to the resistance line of the channel.
This short-term positive view will invalidate if the price turns down and dives below the channel. The pair could then drop to $66.
XRP/USDT
The bulls attempted to push Ripple (XRP) above the overhead resistance at $0.65 but the long wick on the day’s candlestick suggests that bears are in no mood to relent.

Both moving averages are sloping down and the RSI is in the oversold territory, indicating that bears are in command. The sellers will now attempt to sink the XRP/USDT pair below $0.54 and challenge the psychological support at $0.50.
This negative view will invalidate if bulls push and sustain the price above the 20-day EMA ($0.68). Such a move will be the first sign that the selling pressure could be reducing. The pair may then rally to the overhead resistance at $0.75.
LUNA/USDT
Terra’s LUNA token has again slipped to the support line of the descending channel. This suggests that traders continue to sell on rallies.
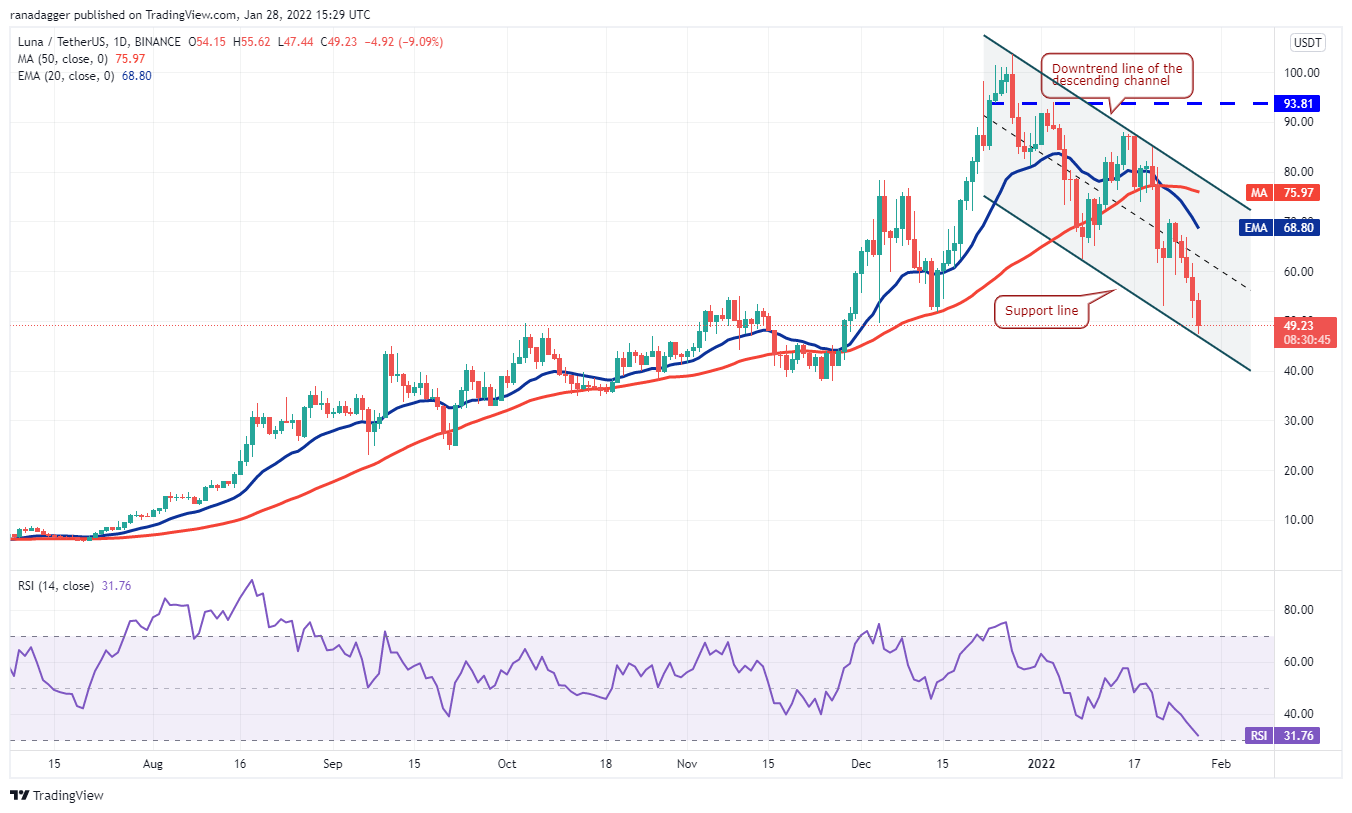
The downsloping 20-day EMA ($68.8) and the RSI near the oversold territory indicate that bears have the upper hand. If bears sink the price below the support line of the channel, the selling could intensify and the LUNA/USDT pair may plummet to $37.82.
Contrary to this assumption, if the price rebounds off the current level, the bulls will make one more attempt to push the pair to the 20-day EMA. This level is again likely to act as a stiff resistance but if the bulls overcome it, the pair may rally to the downtrend line.
Related: Defying the bear market, this automated strategy is up 15% so far in 2022
DOGE/USDT
Dogecoin (DOGE) turned down from the 20-day EMA ($0.15) on Jan. 26, indicating that bears are selling near this overhead resistance. The price is back inside the tight range at $0.15 to $0.13.
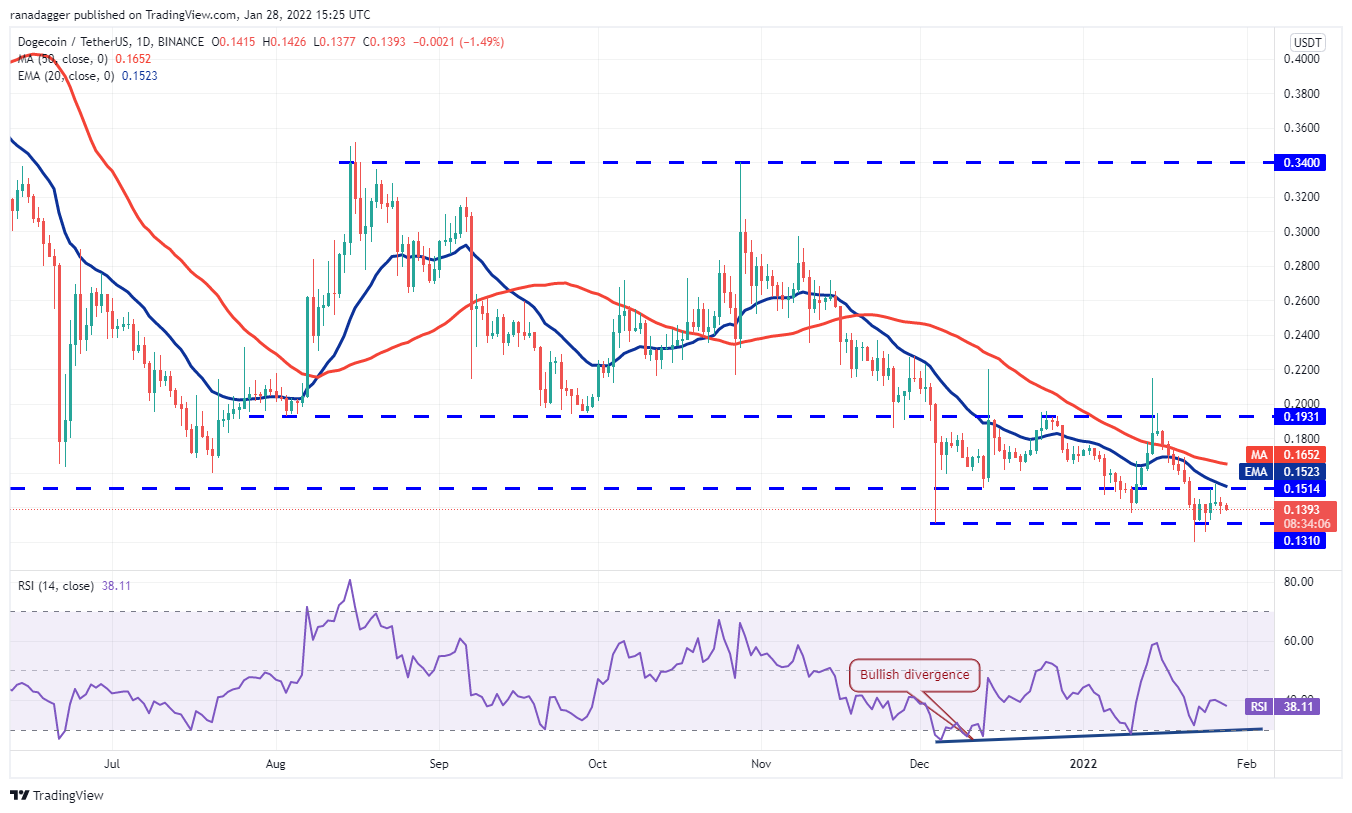
While the downsloping 20-day EMA indicates advantage to bears, the bullish divergence on the RSI suggests that the selling pressure could be reducing. This state of uncertainty is unlikely to continue for long.
If bulls push and sustain the price above the 20-day EMA, the DOGE/USDT pair could rise toward the overhead resistance at $0.19. Conversely, if the price slips and closes below $0.13, the pair could drop to the psychological support at $0.10.
DOT/USDT
Polkadot (DOT) has been trading near the strong support at $16.81 for the past few days but a minor negative is that the bulls have not been able to achieve a powerful rebound off it. This indicates a lack of demand at higher levels.
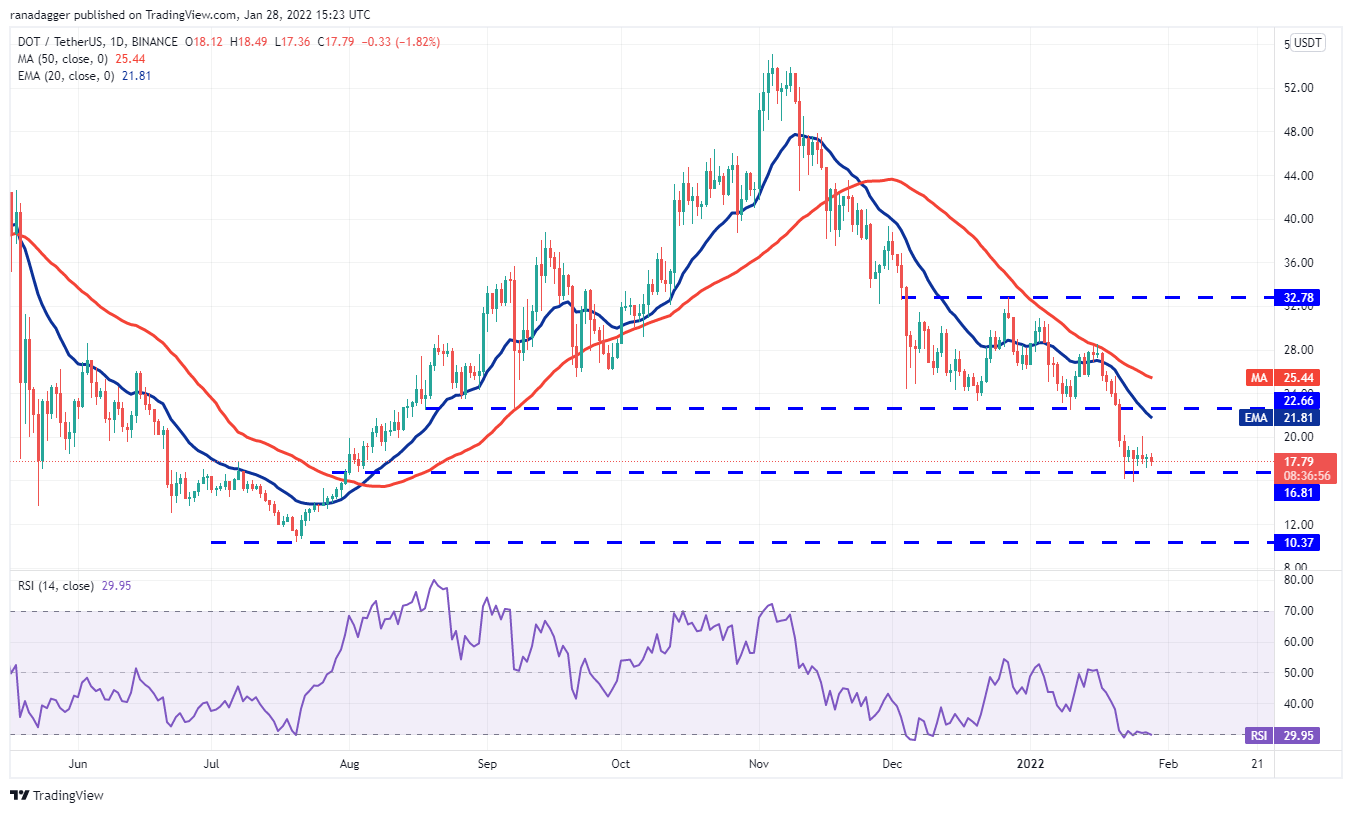
The bears will now try to pull and sustain the price below $16.81. If they manage to do that, the selling could intensify and the DOT/USDT pair may drop toward the next major support at $10.37. The downsloping moving averages and the RSI in the oversold zone suggest the path of least resistance is to the downside.
Conversely, if bulls drive the price above $20.16, it will suggest a pick-up in demand. The pair may then rise to the 50-day SMA ($25.44). This is an important level to watch out for because a break above it will signal a possible change in trend.
AVAX/USDT
The long wick on Avalanche’s (AVAX) Jan. 26 candlestick shows that bears are defending the breakdown level at $75.50. The bears will now try to pull the price to the strong support at $51.04.
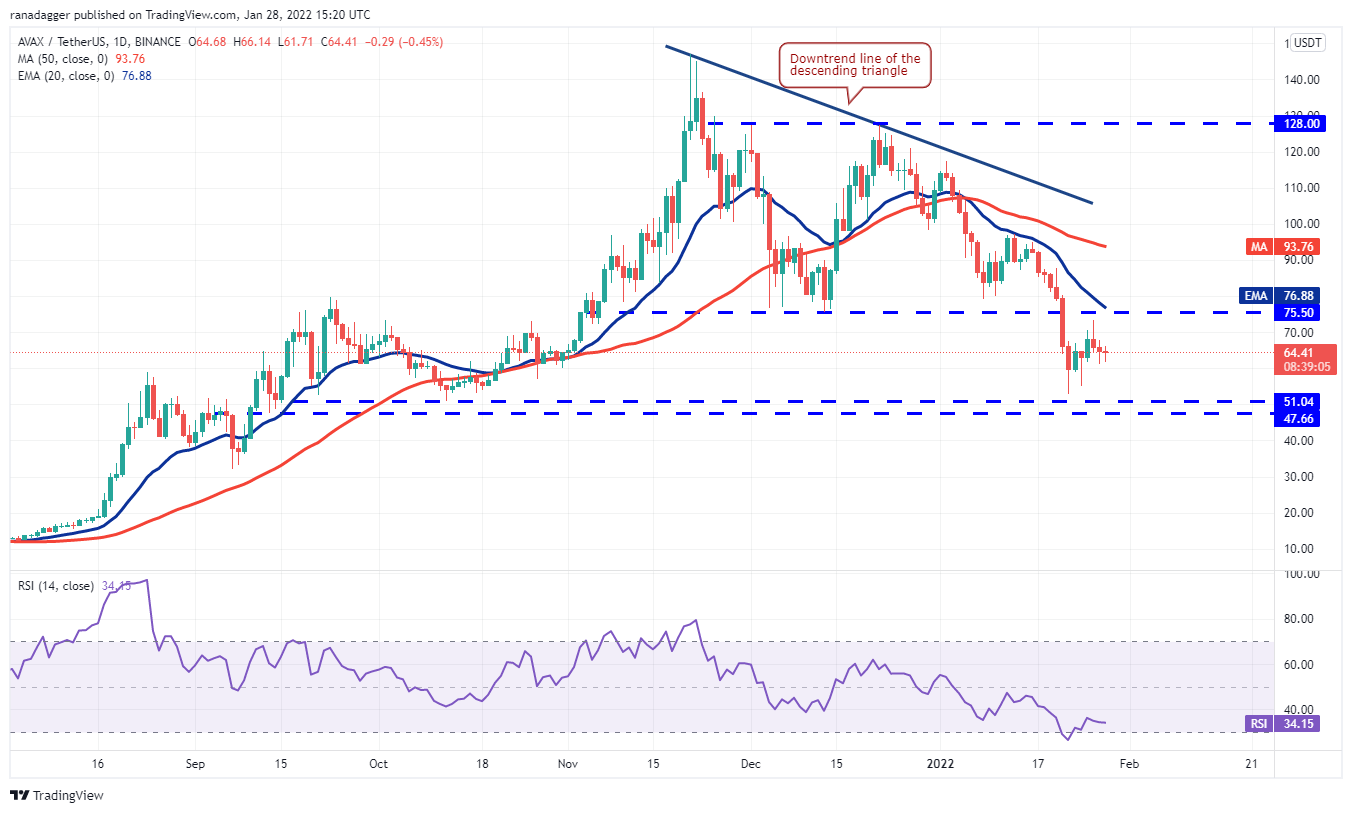
If the price rebounds off $51.04, it will suggest that bulls are buying on dips to this level. That could keep the AVAX/USDT pair range-bound between $75.50 and $51.04 for a few days.
A break and close above $75.50 will be the first indication that the correction could be over. The pair could then rise to the downtrend line.
Alternatively, if the price breaks below $47.66, the next leg of the downtrend could begin. Until then, the pair could remain volatile inside the range.
The views and opinions expressed here are solely those of the author and do not necessarily reflect the views of Cointelegraph. Every investment and trading move involves risk. You should conduct your own research when making a decision.
Market data is provided by HitBTC exchange.

