Tento príspevok bol pôvodne publikovaný na stránke https://cointelegraph.com/news/here-are-the-most-predictable-tokens-of-2021-for-those-who-knew-where-to-look a autorom článku je Cointelegraph By Beau Linighan. Tento článok je iba kópia originálneho článku.
https://images.cointelegraph.com/images/840_aHR0cHM6Ly9zMy5jb2ludGVsZWdyYXBoLmNvbS91cGxvYWRzLzIwMjItMDEvOTg0Yzc3OTUtOGNhMy00MGI2LWExNmUtNzIyYjliODVmNDY2LmpwZw==.jpgDigital assets’ past performance is never a guarantee of future price movement. There are never two identical situations in the crypto marketplace, so even historically similar patterns of a token’s behavior can be followed by starkly different price action charts.
Still, crypto assets’ individual history of price action often rhymes, giving those who can ready this history right a massive edge over other traders. And, importantly, some tokens are much more likely than others to exhibit recurring behavior, which makes their bullish setups more recognizable ahead of time.
Cointelegraph Markets Pro, a subscription-based data intelligence platform whose job is to search for regularities in crypto assets’ past trading behavior and alert traders to historically bullish conditions around individual assets, has been live for almost an entire year now. Based on a year’s worth of tokens’ performance data, here are the assets that exhibited historically bullish trading conditions most frequently, along with their subsequent price dynamics.
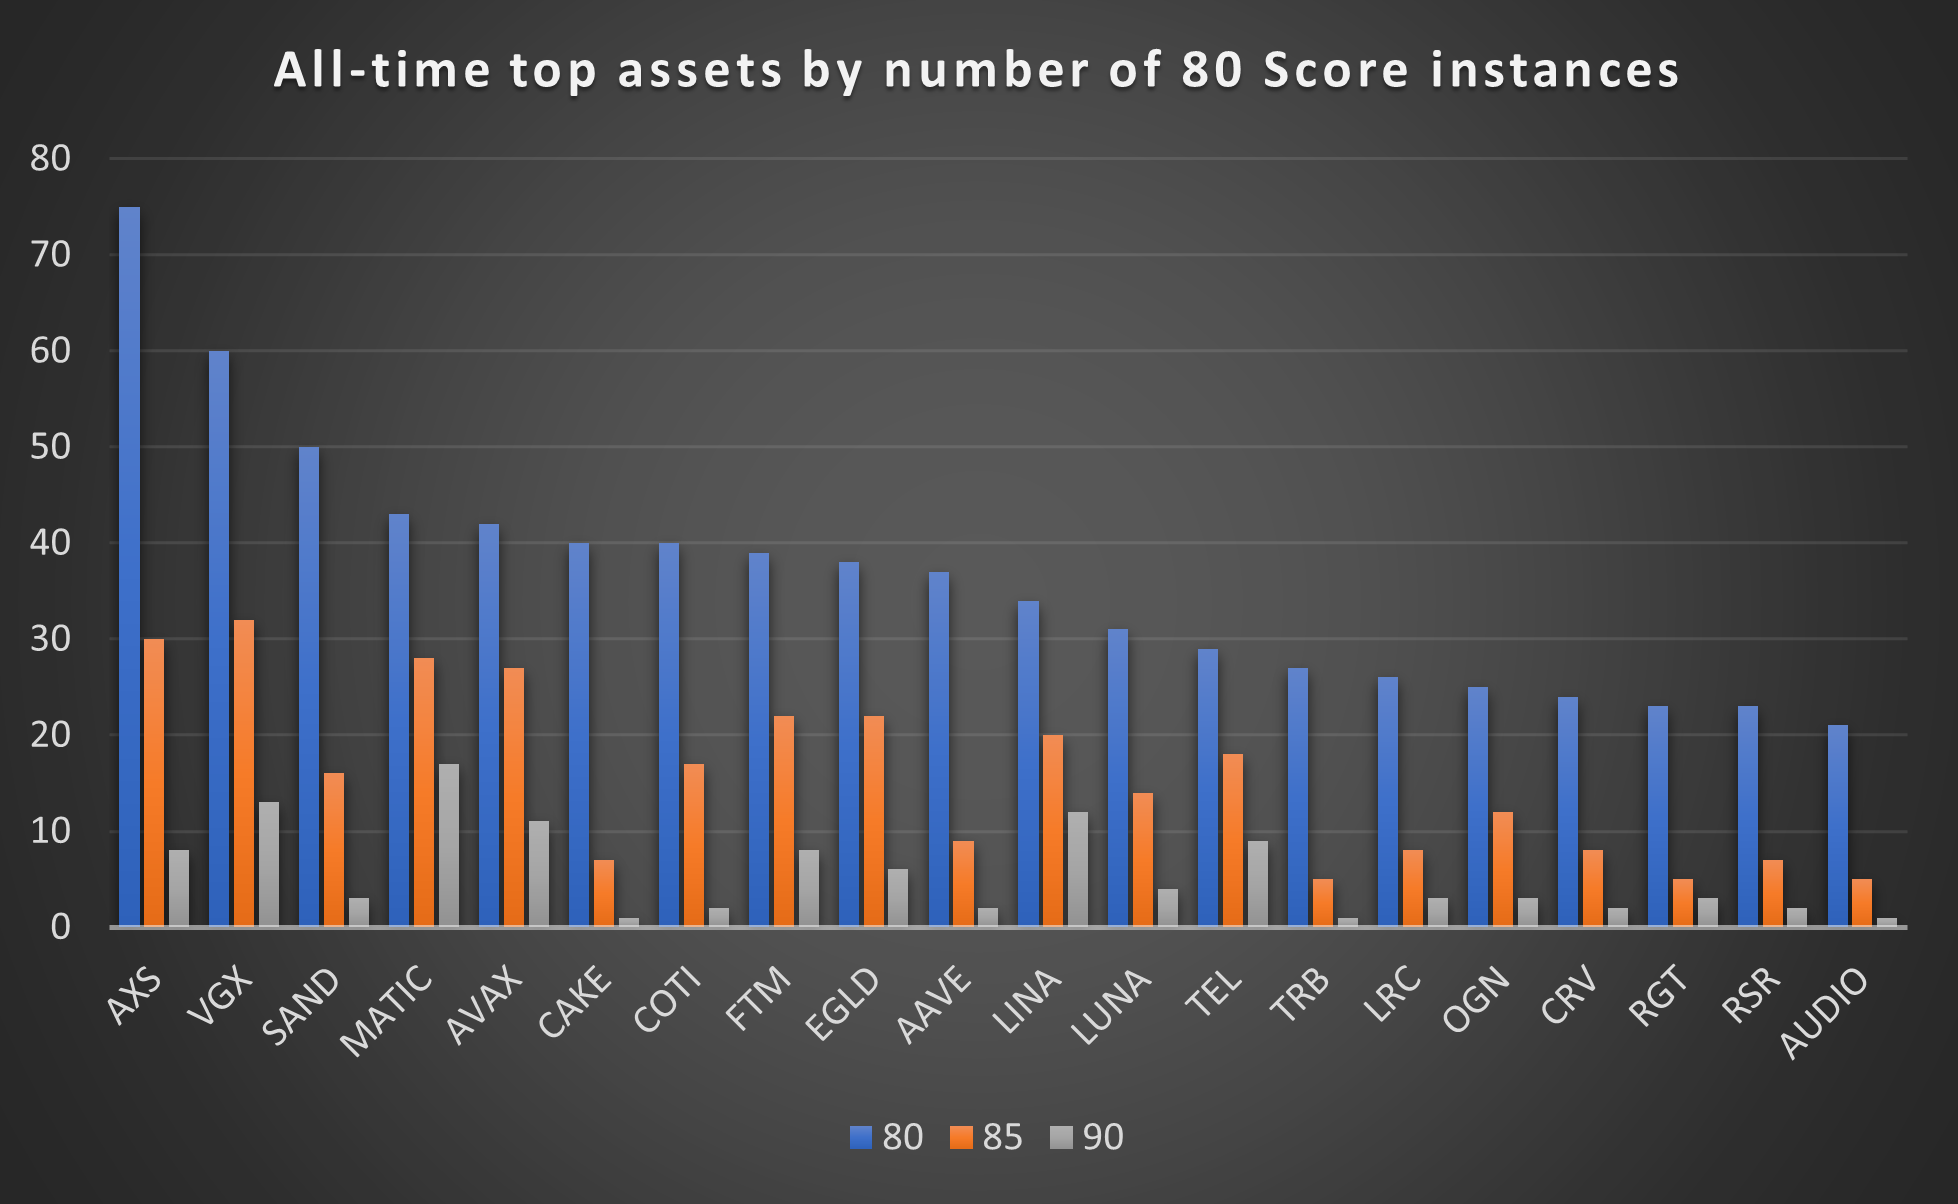
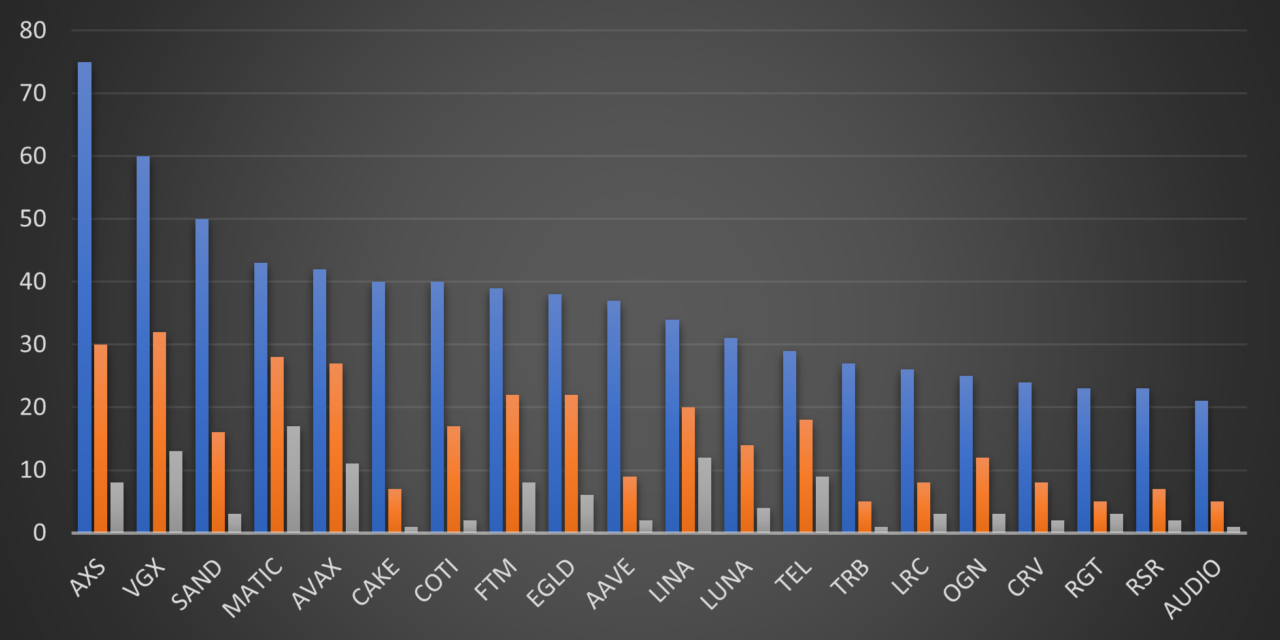
The chart shows top 20 digital assets by the overall number of instances when they hit a VORTECS™ Score of 80. The VORTECS™ Score is an algorithmic indicator that considers a host of variables around each coin — including market outlook, price movement, social sentiment, and trading activity — to assess whether its present conditions are historically bullish, neutral, or bearish. Conventionally, VORTECS™ Scores above 80 are considered confidently bullish, while 90 and above indicate the model’s extreme confidence in the asset’s tremendously favorable outlook.
Despite metaverse coins – AXS and SAND – occupying spots number one and three on this list, no single digital asset sector dominates the chart, with layer-one and DeFi tokens also widely represented in the top 20. It appears from this data that tokens’ likelihood to exhibit historically favorable trading patterns does not depend on asset class.
For example, AXS has gone above the Score of 80 on 75 occasions, while layer-one AVAX recorded 42 instances of a historically favorable outlook, and DeFi token COTI sported 40 high-VORTECS™ days.
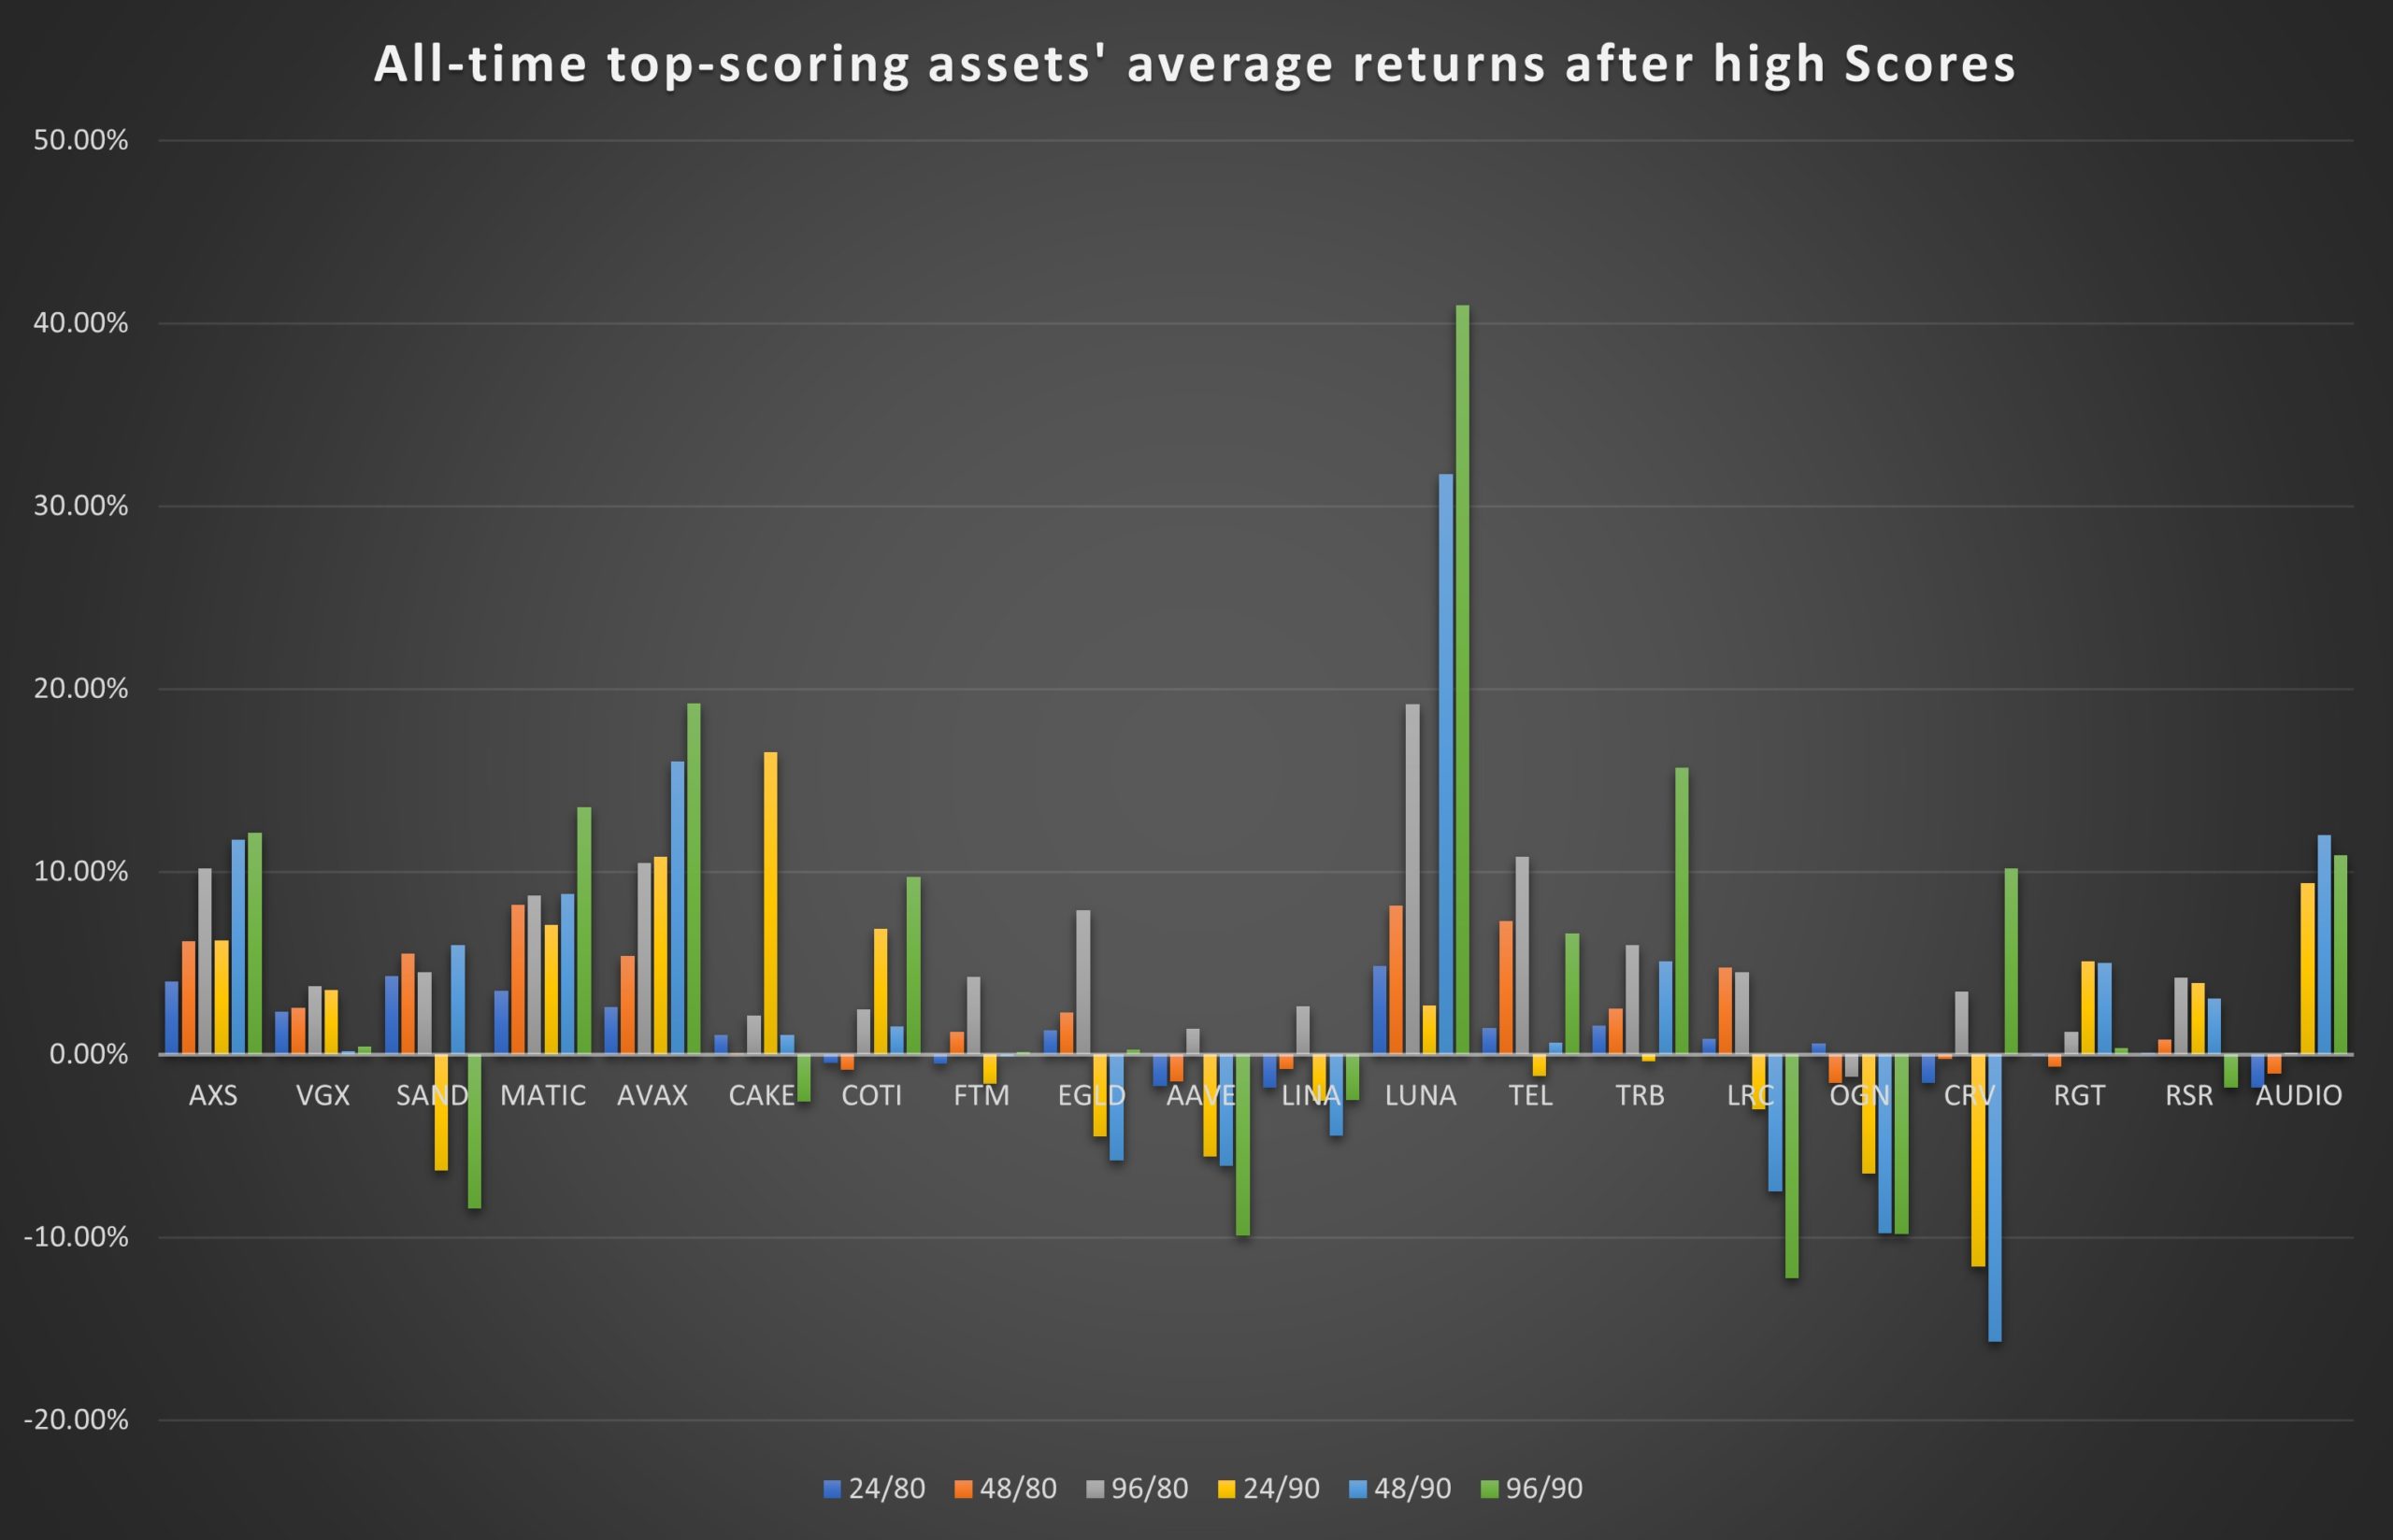
The second chart presents the average gains that frequent top VORTECS™ performers yielded 24, 48, and 96 hours after hitting the Scores of 80 and 90. There are few bars pointing below zero, but the majority show solid positive returns, meaning that most assets consistently appreciated after demonstrating strong bullish conditions. Here’s AVAX, one of the top performers:
24 hours after Score 80: Average gain 2.5%
48 hours after Score 80: Average gain 5.3%
96 hours after Score 80: Average gain 10.4%
24 hours after Score 90: Average gain 10.8%
48 hours after Score 90: Average gain 16.0%
96 hours after Score 90: Average gain 19.1%
Other high scorers boast even more impressive returns on certain timeframes. For one, LUNA did exceptionally well 48 and 96 hours after achieving a VORTECS™ Score of 90, yielding on average 31.7% and 40.9%, respectively.
Granted, some assets behaved less consistently, with average returns bars pointing both above and below zero, while others, like AAVE, LRC, and OGN tended to lose value after flashing historically bullish patterns.
Nevertheless, the performance of most of the featured assets is overwhelmingly positive, beating the market by a wide margin. This trend is observed across hundreds of VORTECS™ Score instances and remains robust over the period of 12 months that included stints of bull, bear, and sideways market. It might not be a universal law, but it is evident that there is a sizable group of well-performing crypto tokens whose history often rhymes, much to the savvy traders’ delight.
Cointelegraph is a publisher of financial information, not an investment adviser. We do not provide personalized or individualized investment advice. Cryptocurrencies are volatile investments and carry significant risk including the risk of permanent and total loss. Past performance is not indicative of future results. Figures and charts are correct at the time of writing or as otherwise specified. Live-tested strategies are not recommendations. Consult your financial advisor before making financial decisions.

