Tento príspevok bol pôvodne publikovaný na stránke https://cointelegraph.com/news/ethereum-bulls-retain-hopes-of-10k-despite-eth-price-chart-bear-flag a autorom článku je Cointelegraph By Yashu Gola. Tento článok je iba kópia originálneho článku.
https://images.cointelegraph.com/images/840_aHR0cHM6Ly9zMy5jb2ludGVsZWdyYXBoLmNvbS91cGxvYWRzLzIwMjEtMTIvNTM2MTlhNGEtMjEwZC00YjliLTkwMzMtZjFlMjAzZDE3Y2UzLmpwZw==.jpgEthereum’s native token Ether (ETH) looks poised to extend its selloff this week as it wobbles near a key support level of $4,000.
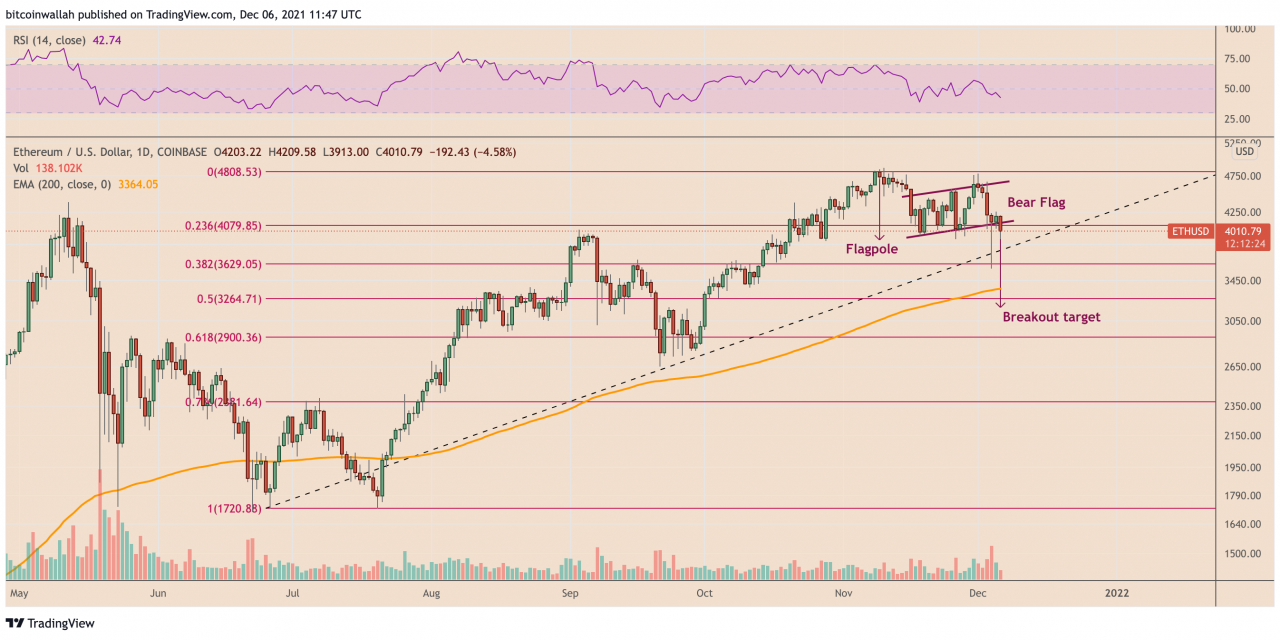
ETH price dropped by over 5.50% on Dec. 6 to an intraday low at $3,913. In doing so, it slipped through upward sloping support that constituted an Ascending Channel that — more or less — appears like a Bear Flag, a bearish continuation setup.

Conservative traders typically spot Bear Flags when an instrument consolidates higher inside a parallel channel after a considerable price drop (called Flagpole). They anticipate the price to break below the Flag’s lower trendline. And when it does, traders set their profit target by measuring the Flagpole’s height and subtracting it from the breakout level.
Applying the Bull Flag strategy to Ether’s ongoing price trends, one can expect the cryptocurrency to drop towards $3,200 in the sessions ahead. Interestingly, the level is also near the 0.5 Fib line (~$3,264) of the Fibonacci retracement graph drawn from the $720-swing low to the $4,808-swing high.
More confirmation needed
While the Bear Flag setup hints at more pain for Ether ahead, some analysts believe the Ethereum token still has more room to run to the upside.
For instance, PostyXBT, an independent market analyst, asked his massive follower-base on Twitter to turn attention to Ether’s deep price wick from Saturday, underscoring how the cryptocurrency’s sudden crash from near $4,240 to as low as $3,575 (data from Coinbase) was met by traders with an aggressive buying response.
“The weekly close above $4k means that ETH is one of the strongest looking coins out there,” the pseudonymous analyst noted, adding that not many held the structure “despite the wick.”

Meanwhile, another popular analyst Crypto FOMO also referred to the Saturday rebound as a reason to stay bullish on Ether. In an analysis published Monday, the analyst said that the cryptocurrency’s ability to hold its rising channel support (the Bear Flag structure) might prompt bulls to push its value to $10,000.
“That is also because Ethereum is crashing a lot lesser than other cryptos, which is very bullish,” the channel noted while highlighting Ether’s growing strength against Bitcoin (BTC).

On its weekly chart, Ether looks to have been eyeing a move toward $6,500 after breaking out of its Ascending Triangle.
In detail, the ETH price left the Triangle range in the week ending Oct. 25 after consolidating inside it for a little over four months. Nonetheless, traders returned to test the structure’s upper trendline as support, as is common across bullish continuation setups.

As long the price holds itself above the Triangle’s upper trendline, its likelihood of continuing its rally upwards remains higher — by as much as the structure’s maximum height, as shown in the chart above.
On the other hand, a decisive break below the Triangle’s lower trendline risked invalidating the bullish setup.
Strong fundamentals
James Wo, CEO/Founder of DFG Group — a Singapore-based venture capital firm, blamed Ether’s consistently positive correlation with Bitcoin behind its latest price corrections, noting that a spot market selloff in the BTC market, led by the ongoing Omicron FUD, has had exchanges liquidate $2 billion worth of traders’ margined positions, hurting ETH in tandem.
Related: BTC sentiment ‘comparable to a funeral’ — 5 things to watch in Bitcoin this week
But the analyst, too, anticipated a price rebound for ETH based on its successful adoption across the emerging nonfungible token (NFT), decentralized finance (DeFi), and metaverse space.

“The levels of open interest levels seen up to this correction for both BTC and ETH were an important indicator that a bearish scenario was highly probable,” Wo explained, adding:
“We still believe that fundamentals are strong and long-term valuations are still very low based on the technological advancements and contributions we are witnessing from this industry.”
ETH/USD was trading at $4,050 at the time of this writing.
The views and opinions expressed here are solely those of the author and do not necessarily reflect the views of Cointelegraph.com. Every investment and trading move involves risk, you should conduct your own research when making a decision.

