Tento príspevok bol pôvodne publikovaný na stránke https://cointelegraph.com/news/bitcoin-nears-worst-monthly-losses-since-2011-with-btc-price-at-19k a autorom článku je Cointelegraph By William Suberg. Tento článok je iba kópia originálneho článku.
https://images.cointelegraph.com/images/840_aHR0cHM6Ly9zMy5jb2ludGVsZWdyYXBoLmNvbS91cGxvYWRzLzIwMjItMDYvNGRlZGRhMTgtYzE2MC00MjEzLTg4NjItOWQ4MjgxYjM2NWFlLmpwZw==.jpgBitcoin (BTC) drifted further downhill into the June 30 Wall Street open as United States equities opened with a whimper.
U.S. dollar returns to multi-decade highs
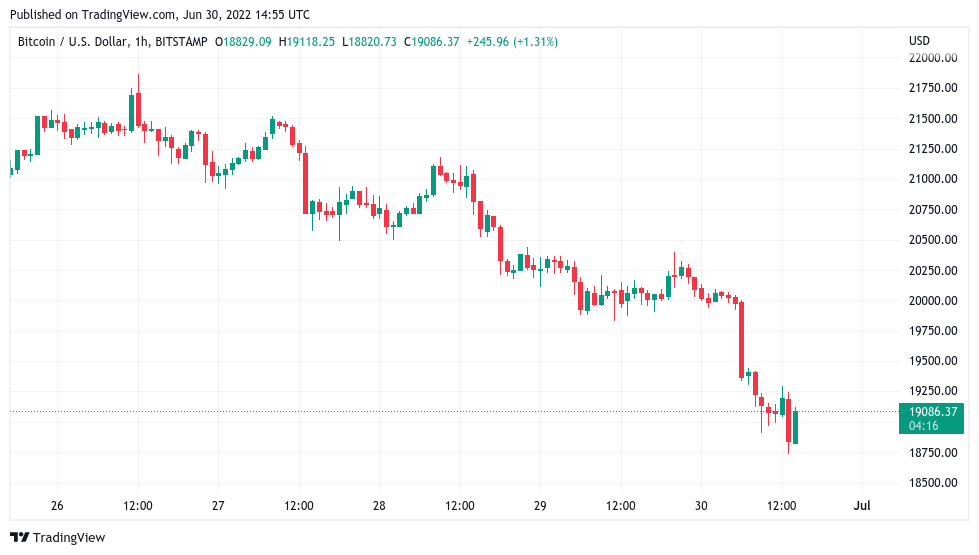
Data from Cointelegraph Markets Pro and TradingView followed BTC/USD as it abandoned $19,000 to hit its lowest in over ten days.
Bulls failed to preserve either $20,000 or $19,000 at the hands of limp U.S. stock market moves, the S&P 500 and Nasdaq Composite Index down 1.8% and 2.6% respectively at the time of writing.
At the same time, the U.S. dollar once again staged a comeback to fix a trajectory toward twenty-year highs seen this quarter.
The U.S. dollar index (DXY) was above 105.1 on the day, coming within just 0.2 points of its highest levels since 2002.
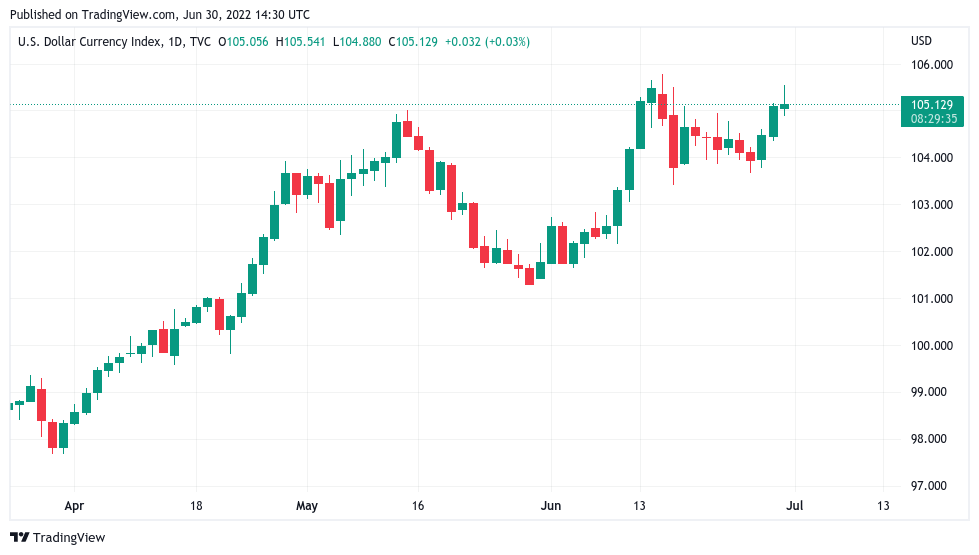
“The US dollar (DXY) looks set to test highs last seen in December 2002 as the short-term downtrend is broken convincingly amid risk markets’ continued crumble,” researche and trader Faisal Khan summarized on Twitter.
Data on inflation meanwhile once more suggested the worst could be behind the market.
Peak #inflation? The inflation rate most closely watched by Fed showed that price pressures were a bit tamer: May PCE was a bit soft, w/headline +6.3% YoY (flat vs April, below +6.4% expected) & core +4.7% (from +4.9% in Apr & below +4.8% forecast). Bonds rally w/US 10y down 7bps pic.twitter.com/FFgb6du6dS
— Holger Zschaepitz (@Schuldensuehner) June 30, 2022
As Cointelegraph reported, however, central banks began to acknowledge that the low rates seen before COVID-19 may never return.
Bulls’ worst month in 11 years
With the majority of on-chain metrics now at historic lows, price data hinted how far BTC could theoretically go in a bear market increasingly unlike the rest.
Related: No flexing for Bitcoin Cash users as BCH loses 98% against Bitcoin
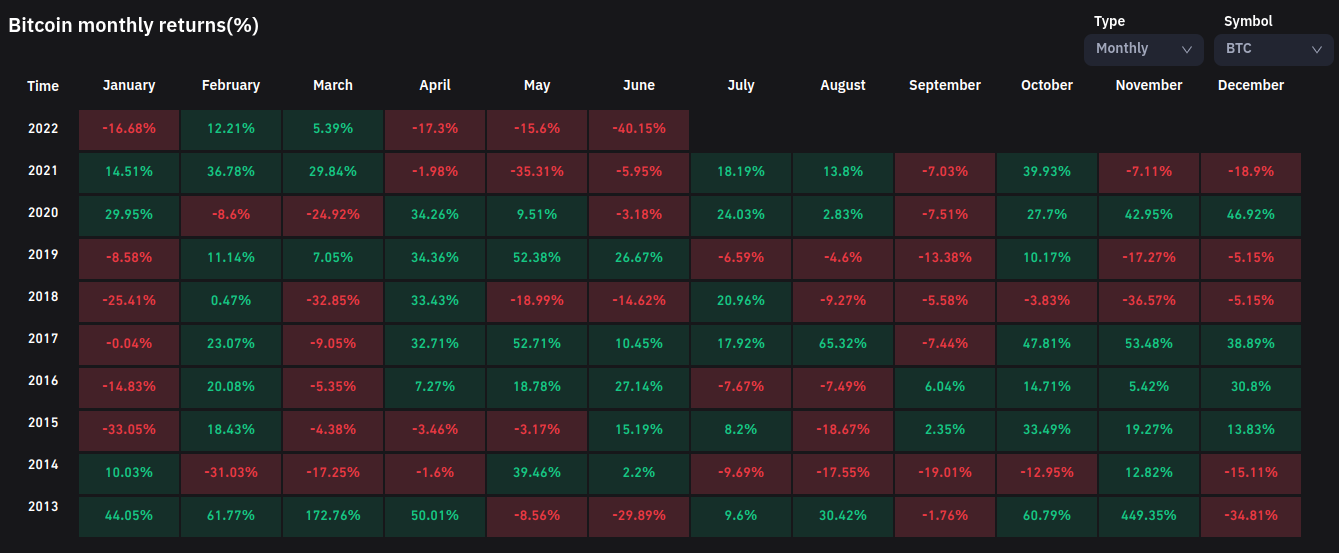
Should it close at current levels of $19,000, BTC/USD would seal monthly losses of over 40% for June 2022.
That would make it the worst June ever and the heaviest monthly losses since September 2011, data from TradingView and on-chain monitoring resource Coinglass confirms.
Even March 2020 and the 2018 and 2014 bear markets were less severe on monthly timeframes. 40% drops were last seen when BTC/USD traded at $8.
The views and opinions expressed here are solely those of the author and do not necessarily reflect the views of Cointelegraph.com. Every investment and trading move involves risk, you should conduct your own research when making a decision.

