Tento príspevok bol pôvodne publikovaný na stránke https://cointelegraph.com/news/bitcoin-death-cross-that-pushed-btc-price-to-28-8k-reappears a autorom článku je Cointelegraph By Yashu Gola. Tento článok je iba kópia originálneho článku.
https://images.cointelegraph.com/images/840_aHR0cHM6Ly9zMy5jb2ludGVsZWdyYXBoLmNvbS91cGxvYWRzLzIwMjEtMTIvYWRmYTQxNjgtZGFkMC00Y2FjLWIyODQtZjNkNjBiYzkwZTk0LmpwZw==.jpgA technical sell signal is about to appear on the Bitcoin (BTC) daily chart.
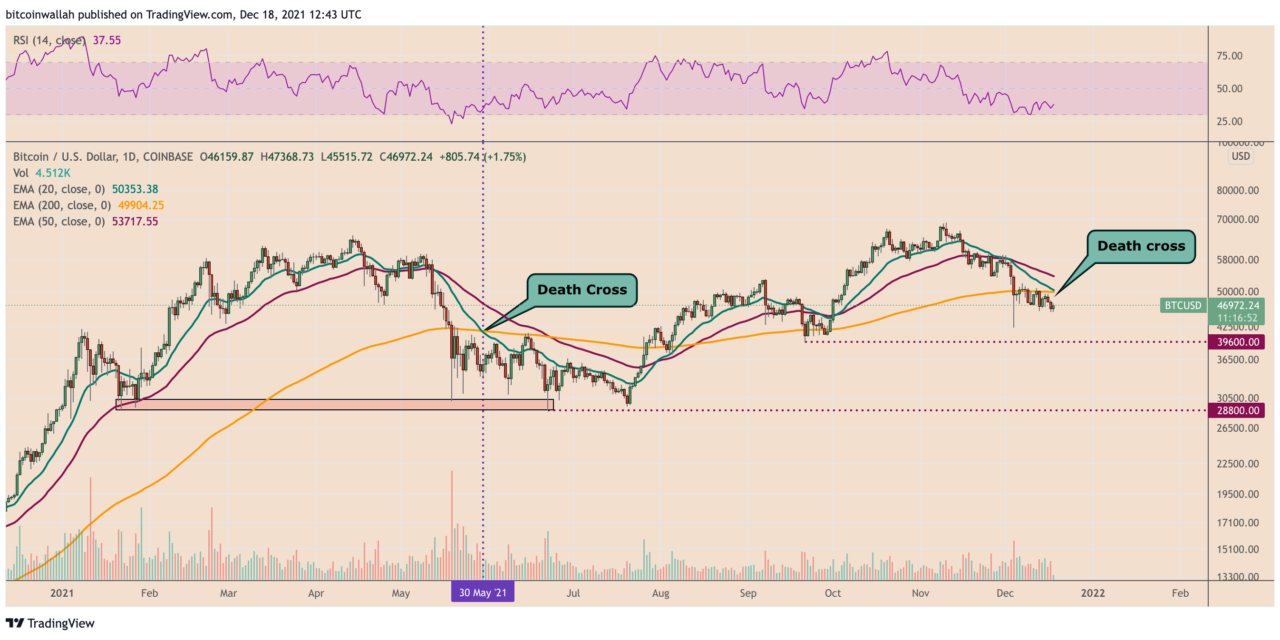
On Dec. 18, the BTC price will experience a death cross, a market indicator that occurs when a short-term moving average slips below a long-term moving average. In this case, Bitcoin’s 20-day exponential moving average (20-day EMA) will close below its 200-day exponential moving average (200-day EMA).
The indicator may end up alerting traders and investors about a potential selloff in the coming sessions, given its history of predicting bear trends in advance. For instance, the 20-200 bearish crossover that appeared on May 30, 2021, was instrumental in crashing the BTC price from $36,500 to $28,800 in the next 24 days.

A similar death across also surfaced during March 2020’s pandemic-led market crash, exactly a day before the Bitcoin price dropped from nearly $8,000 to below $4,000.

Bitcoin risks correction to $40K-42K range
Bitcoin has been correcting consecutively across the last four weeks and looks poised to close the ongoing weekly session in losses, as well, primarily with the Federal Reserve taking more aggressive action on inflation.
In the last 30 days, the BTC price has fallen by nearly 17.50%, including a correction from its record high of $69,000 on Nov. 10. In doing so, the cryptocurrency briefly fell to $42,333, only to rebound sharply later, paring some losses, as shown in the chart below.

Nonetheless, the rebound did not turn into a bullish reversal — the Bitcoin price has been trending lower after finding an interim resistance near $50,000, a psychological level.
Bitcoin’s efforts to retest $50,000 for a bullish breakout face opposition from its descending channel’s resistance trendline, combined with additional downside pressure from its 20-day EMA and 200-day EMA waves, which are also sitting near $50,000.
Related: Bitcoin bears lack ‘balls’ to continue selling into 2022 — analyst
As a result, the path of least resistance for Bitcoin appears to the downside. And with the death cross looming, the cryptocurrency would likely continue trending inside the descending channel to test levels around $42,000 for a strong pullback move.
If the decline accelerates, the price may eye $40,000 next as its downside target.
The RSI factor
Another leg lower would also push Bitcoin’s daily relative strength index (RSI) into its oversold territory below 30, a buying signal. For now, the momentum indicator has been attempting to break above its downward sloping trendline, a move that has earlier predicted Bitcoin’s local price bottoms.

On a shorter timeframe chart, the RSI has been consolidating sideways, anticipating that it would break out of the rectangle range to the upside. At the core of this optimistic outlook is a fractal from September 2021, shared by Mozzi, an independent crypto-market analyst.

“Bitcoin is following a similar structure from the end of September,” the analyst noted on Saturday.
“Notice the RSI consolidation. Waiting on a clear break of the upper trendline as confirmation.”
The views and opinions expressed here are solely those of the author and do not necessarily reflect the views of Cointelegraph.com. Every investment and trading move involves risk, you should conduct your own research when making a decision.

