Autor Yashu Gola

Bitcoin price is down over 40% since STRC launched: Is Strategy 'fine'?

Bitcoin (BTC) has fallen roughly 50% since Michael Saylor’s Strategy launched Stretch (STRC), its flagship Bitcoin-funding vehicle, in late July 2025.BTC/USD monthly chart. Source: TradingViewKey takeaways:STRC is acting like a classic Ponzi scheme, argue Peter Schiff and other critics.Other analysts disagree, noting that STRC’s drop below the $100 par is due to a leverage wipeout. Critics say STRC looks like a “classic centralized Ponzi”STRC was designed to trade near its $100 par value, enabling Strategy to raise capital to buy more Bitcoin. The instrument is now trading at a deep discount, suggesting that the BTC buying channel is under pressure.On Thursday, STRC fell to a record low of $82.53 before closing at $88.59, still below the $100 par value.STRC daily chart. Source: TradingViewLaunched in July 2025, STRC was designed to trade near par through adjustable dividends, currently 11.5% annualized, with proceeds used primarily to acquire Bitcoin.The widening discount has pushed STRC’s effective yield above 12.9% and contributed to a pause in at-the-market share issuance. That risks slowing down the capital-raising flywheel behind Strategy’s Bitcoin treasury, which now holds more than 846,000 BTC. In finance, a “flywheel” is a self-reinforcing business model where growth in one metric directly helps grow another, compounding momentum.But trading 13% below par has revived criticism of Strategy’s funding model. Bitcoin critic Peter Schiff has repeatedly described STRC as “a classic centralized Ponzi,” arguing that it depends on Strategy’s ability to raise fresh capital through new share sales or sell Bitcoin to meet obligations. Source: X/Peter SchiffCrypto trader DonAlt also questioned STRC’s recent price action, asking why the instrument was “trading like a Ponzi” after its sharp move below par.Strategy has not directly addressed this in recent statements, instead continuing to present STRC as preferred equity supported by its Bitcoin-focused treasury strategy.However, the company has moved STRC to a semi-monthly dividend schedule, with payouts now designed to occur twice a month rather than monthly. Strategy’s Bitcoin buying pace slows as STRC slumpsThe pace of Strategy’s Bitcoin accumulation has slowed sharply as STRC trades below par value.The company added 1,550 BTC for $101 million in the week ending June 8 and another 1,587 BTC for $100 million in the week ending June 15, lifting total holdings to 846,842 BTC. Those were meaningful purchases, but they were far smaller than Strategy’s weekly buys earlier in 2026.For instance, in April, Strategy bought 34,164 BTC for $2.54 billion in a single week. In May, it added another 24,869 BTC for roughly $2.01 billion. By contrast, June’s weekly additions have been closer to $100 million each.The slowdown also coincided with a small but notable 32 BTC sale earlier in June, worth about $2.5 million, to help cover dividend obligations. Related: Bitcoin price sets $64.5K week-to-date low as Strategy selling worries returnThe sale was tiny compared with Strategy’s overall Bitcoin treasury, but it showed that cash obligations can still force limited BTC sales when STRC-led funding becomes less efficient.STRC-led weekly BTC buying estimates. Source: STRC.LIVEAnalyst says STRC drop is a leverage wipeoutThe STRC sell-off looked more like a leverage wipeout than a deterioration in Strategy’s fundamentals, according to Jesse Myers, head of Bitcoin strategy at The Smarter Web Company.“Strategy is fine,” he said in a Thursday post, adding that the company could pay STRC dividends for 32 years if conditions remain unchanged, and indefinitely if Bitcoin appreciates at roughly 2% annually.STRC’s long stretch near $99–$100 encouraged investors to use heavy leverage, with some assuming the instrument would stay above $95. Once the price slipped, margin calls and forced selling accelerated the decline.The discount may also attract income buyers, according to analyst Scott Melker. In a Sunday post, he noted that STRC’s dividends are based on the $100 liquidation preference, not the market price. At an 11.5% dividend rate, buyers at $90 earn about 12.8%, while buyers at $85 earn roughly 13.5%.Source: X/Scott MelkerAt current prices, STRC offers an effective yield of about 13%. Strategy may announce its next dividend rate on June 30, while retaining other options, including MSTR share issuance and cash reserves, to fund its Bitcoin purchases.

Čítaj viac
Bitcoin rotations into altcoins collapses: Have altseasons 'disappeared'?

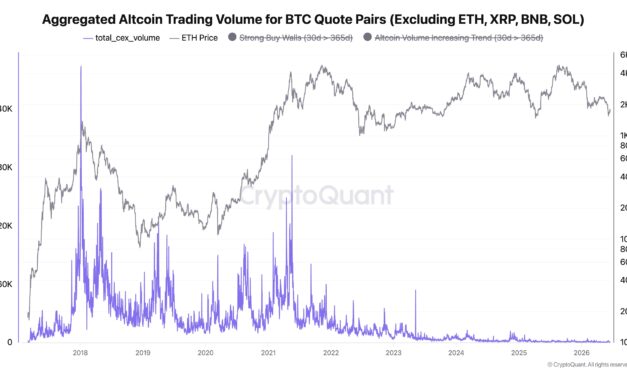
Cryptocurrency traders are no longer using Bitcoin (BTC) profits to buy altcoins as they did in previous bull cycles, raising doubts about whether a broad “altseason” can return.Key takeaways:Bitcoin-to-altcoin rotation trend has collapsed to its weakest level since 2021.Altcoin capital is increasingly getting concentrated in fewer projects, delaying the altseason.Bitcoin-to-altcoin rotation trend has “basically disappeared”The old altseason trade is no longer working the way it did in previous bull cycles, according to Ki Young Ju, CEO of CryptoQuant.In a Saturday post, Ju said the Bitcoin-to-altcoin rotation trend has “basically disappeared,” citing CryptoQuant data showing BTC-pair altcoin trading volume has collapsed to its weakest levels since 2021.Aggregated altcoin trading volume for BTC-priced pairs. Source: CryptoQuantThe metric excludes major altcoins such as Ether (ETH), XRP (XRP), BNB (BNB) and Solana (SOL), focusing instead on mid- and lower-cap altcoins traded against Bitcoin on centralized exchanges.In simple terms, it shows whether traders are using BTC to buy smaller altcoins.That flow surged in 2017 and 2021, helping fuel record altseasons. But Young Ju’s chart shows BTC-pair altcoin volume remains near post-2021 lows, suggesting Bitcoin is no longer the main liquidity source for altcoin speculation.“The era of alts pumping just because BTC pumps may be over,” Young Ju said.Altcoin capital is now concentrated in fewer tokensThe wider altcoin market has become more concentrated, excluding stablecoins.As of Saturday, the non-BTC, non-stablecoin crypto market was worth roughly $600 billion. The top 10 non-stablecoin altcoins accounted for about $483 billion of that total, or roughly 80.5%.TOTAL crypto market excluding Bitcoin and all stablecoins. Source: TradingViewThe number of large market-cap altcoins has also fallen sharply since the last bull cycle. In 2021, roughly 106 altcoins had above $1 billion in market valuation, according to CoinMarketCap’s historical snapshot. That number fell to around 50 in June 2026.This echoes Young Ju’s argument that capital is no longer spreading across the altcoin market the way it did in 2021. The market has not disappeared, but it is being comprised of fewer large altcoins.In a separate thread, Young Ju said that “narrative-only altcoins” are losing relevance as the market matures.Source: X/Ki Young JuYoung Ju said hype alone is no longer enough. The stronger areas, he added, are tied to real businesses, revenue-generating DeFi, stablecoins, tokenized real-world assets, and AI agents.That suggests the next altcoin cycle may be less about rotating into the whole market and more about finding tokens that can find applications and users across the aforementioned fields.BTC dominance rebound may have “postponed” altseasonBitcoin’s crypto market dominance (BTC.D) is also showing early signs of a rebound, which could delay a broader altcoin rally.The BTC.D metric has bounced from its 100-week exponential moving average (100-week EMA, purple) and the lower trend line of an ascending channel, both aligning at the 58.75% level. BTC.D weekly performance chart. Source: TradingViewIt could rally toward the channel’s upper trend line near 60% if momentum persists.A move toward 60% would mean Bitcoin is gaining market share against the rest of crypto. In market terms, that suggests capital may continue rotating from altcoins back into BTC, limiting the chances of a near-term altseason.Analyst Rekt Capital shared a similar view, pointing to a bullish divergence on Bitcoin dominance, which suggests that the “altseason is postponed.”BTC.D weekly performance chart. Source: TradingView/Rekt CapitalA bullish divergence forms when the metric makes lower lows while its RSI makes higher lows. It often signals weakening downside momentum and a potential rebound.Related: Altcoin selling tops $266B as capital rotates out of crypto: Is altseason extinct?Nevertheless, Rekt Capital said Bitcoin dominance’s upside may be limited because the metric has already lost its macro uptrend. He said the current bounce may act as a post-breakdown relief rally before further downside.Bitcoin’s dominance may drop toward its 200-week EMA at 57% if Rekt Capital’s bearish scenario plays out.

Čítaj viac

Andrew Tate loses nearly $86,000 longing and shorting Bitcoin

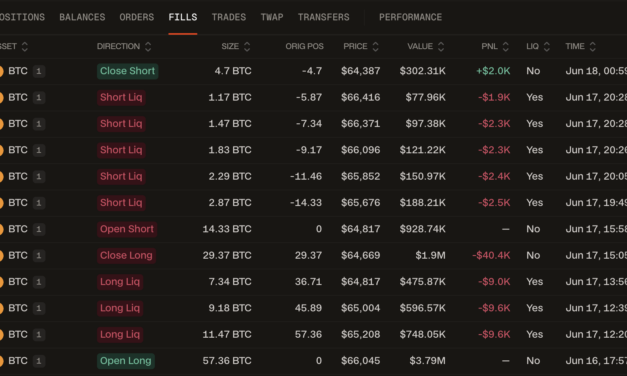
Andrew Tate, founder of the Real World, a company that sells online education courses on trading, lost nearly $100,000 while betting on Bitcoin (BTC) between Wednesday and Thursday.Key takeaways:Tate’s wallet balance drops to $14,000 from $100,000 in a day.The social media influencer has lost around $804,000 on Hyperliquid.Tate’s wallet balance drops to just $14,000A Hyperliquid wallet reportedly linked to Andrew Tate opened a 57.36 BTC long position on Wednesday, with an entry price near $66,000, according to data resource HyperDash. The trade was worth about $3.79 million, backed by roughly $100,000 in USDC, implying leverage of around 40x.Andrew Tate’s filled order history. Source: HyperDashThe position began unwinding on Thursday as Bitcoin fell toward the mid-$64,000 area. Ultimately, the long trade recorded about $68,600 in cumulative realized losses.The wallet then switched direction, opening a 14.33 BTC short position worth about $1 million at $64,817. That trade was also hit as Bitcoin rebounded, with five short liquidation fills.BTC/USD daily chart. Source: TradingViewBy June 18, the account balance had fallen to around $14,000, thus losing almost the entire deposit.Tate’s Hyperliquid portfolio is down nearly $804,000Andrew Tate’s crypto trading issues on Hyperliquid began well before 2026.For instance, in November 2025, his 40x BTC long position was liquidated for $235,000 on Nov. 14. By Nov. 18, multiple longs near $90,000–$95,000 were wiped out, leaving the account near zero. Related: Bitcoin to $145K by October? Why this ‘crazy accurate’ 4chan prediction is sketchyIn another instance, Tate lost around $67,500 on World Liberty Financial (WLFI) positions ahead of a token unlock that triggered a sharp drop in September 2025. He re-entered the same trade almost immediately and lost again.Screenshot of Tate’s WLFI positions from 2025. Source: HyperDash/LookonchainAs of Friday, Tate’s all-time performance tab showed perpetual futures losses of $803,800, extending a drawdown that began in early 2025 and deepened again after the latest June liquidation streak.Tate’s profit-and-loss from all perp trades. Source: HyperDashThe trades show how quickly a leveraged account can lose capital in volatile market conditions, even when the underlying asset moves only a few percentage points.

Čítaj viac

Bitcoin to $145K by October? Why this 'crazy accurate' 4chan prediction is sketchy

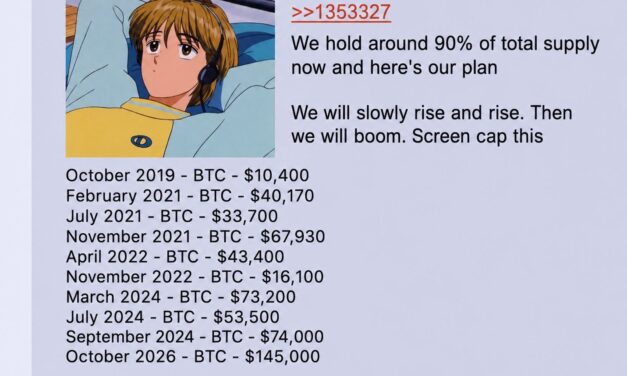
A viral social media post is reviving an alleged Bitcoin prediction that appears to have called several major BTC price levels from 2019 through 2024, with one final target remaining: $145,000 by October 2026.Key takeaways:The new viral post appears to be an iteration of an older post with different Bitcoin price targets.It also claims the author holds more than 90% of the Bitcoin supply, which is mathematically impossible.The Bitcoin target still requires proofThe screenshot, shared by crypto account Corleone, shows an anonymous 4chan-style post dated Dec. 20, 2018. Bitcoin price prediction screenshot. Source: X/CorleoneIt claims that a certain group holds “around 90% of total supply” and lists Bitcoin price targets for October 2019, February 2021, July 2021, November 2021, April 2022, November 2022, March 2024, July 2024, September 2024 and October 2026.At first glance, the prediction looks unusually correct, with Corleone calling them “crazy accurate.” Bitcoin did trade at several of the listed historical levels, including around $67,000 in November 2021 and near $16,000 during the November 2022 bear-market low.But there are several problems with treating the screenshot as authentic.The original post is not publicly verifiableThe biggest issue is provenance. The screenshot does not show a verifiable archive link, tripcode, or any identity marker tying the prediction to a repeatable 4chan user.That matters because 4chan posts are usually anonymous by design. “Anonymous” is not a single person or account. Without an archived source, there is no reliable way to prove that the same person predicted the events before they happened.A Binance Square post from July 2024 uses the same “we hold around 90% of total supply” wording and many of the same targets, but lists Bitcoin at $105,400 in September 2024. Bitcoin price prediction screenshot. Source: Binance SquareThe newer viral screenshot instead shows September 2024 at $74,000 and adds the October 2026 target of $145,000.Related: Bitcoin $150K price calls are ‘drying up,’ which is healthyThat difference is a major red flag. It suggests the image or prediction list may have been edited over time to better match Bitcoin’s historical price action.The market cap claim does not add upThe screenshot also says the prediction would produce a $5.7 trillion market cap, with Bitcoin dominance at 40%–47%.If the $5.7 trillion figure refers to Bitcoin alone, it is mathematically wrong. At $145,000 per BTC and roughly 20 million BTC in circulation, Bitcoin’s market capitalization would be about $2.9 trillion. Even using Bitcoin’s full 21 million maximum supply, the market cap would be around $3.05 trillion.If the post refers to the total crypto market, the wording is unclear and still does not prove anything about the prediction’s authenticity.The “90% of BTC supply” claim lacks proofThe screenshot also claims: “We hold around 90% of total supply now.”Bitcoin has about 20.04 million BTC in circulating supply and a 21 million BTC supply cap, so 90% would imply control of roughly 18 million BTC.Also, the top 100 richest Bitcoin addresses control about 15.27% of the BTC supply, while the top 10,000 addresses hold about 53.89% of the same, according to data resource Bitinfocharts.That is far below the 90% supply supposedly held by the viral post’s author.For now, the claim that an anonymous 4chan user accurately predicted Bitcoin’s major price moves through 2026 should be treated as unproven. It appears more likely to be an edited or recycled crypto meme than proof of a trader who “does not miss.”

Čítaj viac

Bitcoin is setting up 'meaningful floors' in $60K–$70K range: Analyst

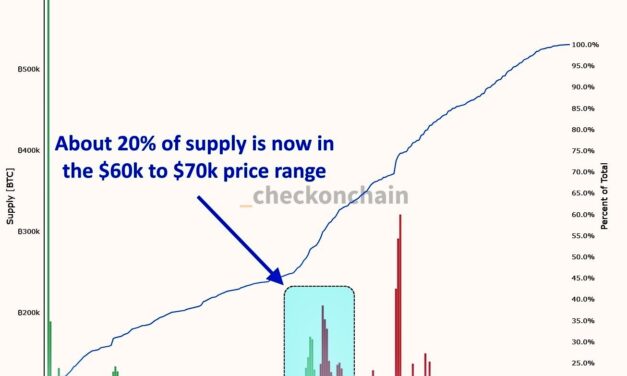
Bitcoin (BTC) showed signs of bottoming inside the $60,000–$70,000 range on Wednesday, according to on-chain data shared by a quant analyst. Key takeaways:Nearly 20% of BTC supply now sits between $60,000 and $70,000, strengthening the case for a Bitcoin price floor.Bitcoin’s bear flag still risks a breakdown toward $53,500 unless BTC reclaims a critical technical resistance level.Nearly 20% of BTC supply moved in the $60,000–$70,000 rangeThe bottom signal comes from Bitcoin’s unrealized price distribution, or URPD, which shows where BTC last moved on-chain and helps identify major investor cost-basis zones.As of Tuesday, Bitcoin’s URPD reading showed a heavy concentration of supply between $60,000 and $70,000. About 20% of Bitcoin’s supply now sits in that range, “Frank Fetter” said, citing Checkonchain data.“This is how meaningful floors are put in,” the analyst added.Bitcoin supply in profit/loss. Source: CheckonchainDense cost-basis zones can become important support areas because many investors share similar entry levels. In Bitcoin’s case, the $60,000–$70,000 band now marks a major ownership cluster near current prices.That suggests a large amount of BTC changed hands during the correction, with higher-cost holders likely selling into weakness, while new buyers absorbed the BTC supply near the lower range.In market terms, this points to a redistribution phase, in which panic sellers exit and more conviction-driven buyers build positions.Darkfost, a CryptoQuant-associated on-chain analyst, echoed that view, saying the setup reflects “one of the biggest BTC transfers from weak hands to strong ones.”Bitcoin “supply in profit” echoes past market bottomsBitcoin’s supply in profit percentage has dropped into what analyst DurdenBTC called a “capitulation zone.”The metric shows how much of the BTC supply is still held at a profit. A sharp drop means more holders are underwater or near breakeven, a condition often seen during late-stage bear markets.BTC has reached this zone only four times in recent cycles: around $3,200 in 2019, $5,000 in 2020, $16,000 in 2023 and now near $59,000. Each prior instance appeared near a major Bitcoin price bottom.That strengthens the case for the $60,000–$70,000 range becoming a floor, though BTC still needs to hold above $60,000 to confirm this.Bitcoin sell-off risks toward $50,000 persistBitcoin’s technical chart, nevertheless, warns of deeper losses despite the on-chain floor signals.On the daily chart, BTC is attempting to rebound inside a small bear flag after its sharp drop below $60,000. A bear flag forms when price consolidates upward after a strong sell-off, often before the next leg lower.BTC/USD daily chart. Source: TradingViewA rejection from the flag’s upper trend line could trigger another breakdown below $60,000. Based on the pattern’s height, Bitcoin’s next downside target sits near $53,500, close to the broader $50,000 support area.Related: Bitcoin sell-off toward $60K may resume as Japan hikes interest ratesA daily close above the 20-day exponential moving average (20-day EMA, green) at $66,420 may weaken the bearish setup. The level also aligns with the flag’s upper trend line.A decisive close above this resistance confluence may push the BTC price toward the 50-day EMA at around $70,250. However, several Bitcoin metrics suggest that BTC could reach as high as $100,000 in the coming months.

Čítaj viac

Získaj BONUS 8 € v Bitcoinoch

nakup bitcoin z karty

Registrácia Binance

Burza Binance

Aktuálne kurzy