Autor Yashu Gola

Bitcoin drop to $58K brings out bears: Is BTC’s next stop below $50K?

Bitcoin (BTC) dropped below $60,000, a key psychological support, on Thursday as losses in megacap technology stocks weighed on investors’ broader risk appetite, adding pressure to an already fragile crypto market.BTC/USD vs. Nasdaq and S&P 500 daily performance chart. Source: TradingViewThe decline has triggered a classic bearish reversal setup that may push the BTC price under the $54,000 mark in the coming days.Key takeaways:Bitcoin’s break below $60,000 has erased its June gains and activated multiple bearish setups.Bitcoin’s rounded top and daily bear flag breakdowns are both projecting a downside target below $54,000.BTC’s rounded top breakdown signals more pain aheadThe BTC/USD pair fell as much as 4.8% on Thursday, hitting an intraday low near $58,000 and erasing its entire June advance. The pullback also completed what appears to be a rounded top pattern on the four-hour chart.BTC/USD four-hour chart tracking the rounded top bearish setup. Source: TradingViewIn technical analysis, a rounded top forms when buying momentum gradually exhausts, shifting the asset from an uptrend to a downtrend in an inverse-U-shaped structure. The pattern officially resolves when the price breaks below the “neckline” or the structure’s base support.By measuring the distance from the top of the dome to the neckline and projecting that same distance downward from the breakdown point, analysts calculate a clear target. For Bitcoin, this measured downside target sits just under the $54,000 level, representing an approximate 8.9% drop from current prices.On the daily chart, Bitcoin has simultaneously triggered a bear flag breakdown.BTC/USD daily chart tracking the bear flag breakdown setup. Source: TradingViewThis secondary pattern independently projects an identical move toward the $54,000 zone, adding substantial weight to the bearish case.Bitcoin MVRV bands increase $54,000 target oddsBitcoin’s on-chain price bands also point to the same downside area highlighted by the rounded-top and bear-flag setups.Glassnode’s MVRV pricing bands compare Bitcoin’s market price with its realized price, or the average price at which coins last moved on-chain. In simple terms, they show whether the market is trading at unusually high profit or loss levels.BTC MVRV pricing bands vs. price. Source: GlassnodeAs of Wednesday, Bitcoin was trading near $60,997, while the 1.0 MVRV band, shown in green, sat around $53,390. That level closely matches the technical downside target near $54,000, making it an important support zone if BTC extends its decline.Related: Bitcoin nearly loses $59K as DXY surges: Are traders bracing for more pain?A deeper selloff, however, could push Bitcoin toward the 0.8 MVRV band, shown in blue, near $42,700. Historically, Bitcoin’s major bear-market bottoms have formed around this lower blue band, where unrealized losses become extreme, and capitulation risk rises.

Čítaj viac
Strategy's MSTR may plunge 80% if it repeats this dot-com-era fractal

Michael Saylor’s Strategy (MSTR) is testing a technical setup that last appeared before the stock’s 99% collapse during the dot-com bubble burst in the early 2000s.Key takeaways:MSTR is testing a monthly head-and-shoulders setup similar to the one that preceded its dot-com-era collapse.Strategy’s shrinking cash reserve and rising dividend obligations are increasing dilution risk for MSTR common shareholders.MSTR bearish reversal pattern points to 80% downside riskAs of late June, MSTR’s monthly chart was painting a potential head-and-shoulders (H&S) pattern.An H&S pattern develops when the price forms three peaks, with the middle peak, called the “head,” being steeper than the other two, which are called “shoulders.” The neckline is the support level connecting the major pullbacks between those peaks. The pattern typically resolves when the price breaks below the neckline and, in a perfect scenario, falls by as much as the maximum distance between the head and the neckline.MSTR monthly performance chart. Source: TradingViewMSTR has formed a near-perfect H&S pattern since March 2024 and risks a breakdown below the neckline support at $100–$105.A decisive move below it would confirm the bearish setup. It could open the door to a deeper, multi-year correction toward the measured target of around $20, down approximately 80% from current levels.The structure looks similar to the head-and-shoulders top MSTR formed during the dot-com bubble era. Back then, the stock broke below a comparable neckline setup before collapsing by more than 99% from its peak in two years.MSTR monthly performance chart. Source: TradingViewStrategy cash squeeze raises dilution risk for MSTR shareholdersStrategy’s common stock, MSTR, is facing fresh dilution risk as the company’s cash reserve shrinks and its preferred-stock dividend burden grows.As of June, Strategy’s US dollar cash reserve had fallen 38% since the start of 2026, while its yearly dividend obligations had nearly quadrupled to $1.2 billion, according to CryptoQuant analyst Julio Moreno.Strategy cash reserve and dividend coverage. Source: CryptoQuantThe company uses cash to pay dividends on its preferred stocks, primarily Stretch (STRC). But Moreno said Strategy’s preferred-dividend coverage has dropped to about 14 months from more than seven years, meaning it now has enough cash to cover just over one year of STRC dividend payments.That pressure has shown up in STRC’s market price. STRC fell to a record low of $82.50 last week and has since stayed mostly between $82 and $89, well below its $100 par value. STRC price and yield chart. Source: STRC.LIVEThe decline has pushed STRC’s effective yield above 13%, compared with its stated dividend rate of about 11.5%, showing investors are demanding a higher return to hold it.“At current dividend obligations of $1.2 billion per year, restoring 24 months of coverage would require a cash reserve of approximately $2.8 billion, roughly twice what Strategy holds today,” Moreno said, adding:“A higher cash reserve is the most direct signal the market needs to regain confidence in STRC.”Strategy holds 847,363 BTC, acquired at an average price of about $75,650 per coin, higher than today’s BTC price of around $62,600. Selling Bitcoin during a downturn could lock in losses and weaken its long-running accumulation narrative.Instead, Strategy has raised STRC’s dividend rate and issued more MSTR common shares to raise cash. For instance, the company sold 2.71 million MSTR common shares for about $335.5 million in June, while using only $34.9 million of the proceeds to buy 520 BTC.That keeps Strategy’s Bitcoin holdings largely intact, but it increases dilution risk for existing MSTR shareholders.Related: Bitcoin price is down over 40% since STRC launched: Is Strategy ‘fine’?If STRC remains below $100, Strategy may need to keep issuing common shares, slow Bitcoin purchases, or rebuild cash reserves. Each option could weigh on MSTR as the stock tests a bearish technical breakdown.

Čítaj viac

Bitcoin slump worsens amid SpaceX rout: Can BTC price hold $60K any longer?

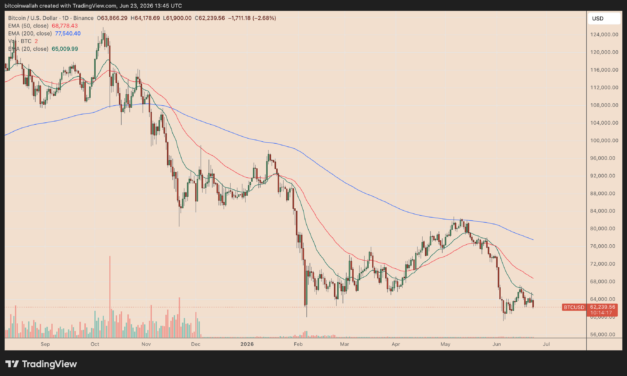
Bitcoin (BTC) has dropped over 8% from its June high near $67,255, putting the $60,000 support level back in focus.BTC/USD daily chart. Source: TradingViewKey takeaways:The SpaceX-led tech market rout is pushing Bitcoin price toward the $60,000 support.A decisive breakdown below $60,000 may lead the price toward $56,000 or under.SpaceX Rout Adds Pressure To Bitcoin’s $60K SupportBitcoin is getting close to retesting $60,000 as SpaceX’s post-IPO rout erases over $600 billion in market value and shakes risk appetite across speculative assets.The Elon Musk-led company priced its record IPO at $135 per share earlier in June, raising $75 billion at an implied valuation of about $1.77 trillion, based on 13.08 billion shares outstanding.Investor demand was strong after the listing. SpaceX shares opened near $150 and later climbed to a post-IPO peak of $211.39 on June 16, pushing its implied market capitalization to nearly $2.8 trillion.SPCX hourly performance chart. Source: TradingViewShares have dropped roughly 27% from their peak, pulling the stock back toward $150 and erasing much of the debut rally.Related: Space X IPO: ‘Bad news’ for tech stocks but what about Bitcoin?The SpaceX rout is part of a wider tech sell-off. Nasdaq 100 futures fell more than 3% on Tuesday, putting the index on track to erase over $1 trillion in market value. Chip stocks also dropped sharply, with Intel, AMD, Micron and SanDisk leading the decline.Nasdaq 100 daily performance chart. Source: TradingViewBitcoin typically trades like a liquidity-sensitive risk asset during market stress. When investors cut exposure to expensive tech and speculative growth names, crypto usually faces similar selling pressure.In a Tuesday post, analyst Nehal said there’s a high probability of Bitcoin falling under $60,000 if it breaks below $62,200, adding:”For now, it’s still a range game. Real breakout signals come above $65.7K or below $59K.”Bitcoin head-and-shoulders pattern sets $56,000 targetBitcoin’s four-hour chart shows a potential head-and-shoulders pattern, adding technical pressure to the ongoing sell-off.The left shoulder formed near $64,500, followed by a higher peak near $67,000 that created the head. BTC then failed to reclaim that high, forming a lower right shoulder near $65,000 before turning lower again.BTC/USD four-hour chart. Source: TradingViewThe pattern’s neckline sits around the $61,000–$62,000 area, close to Bitcoin’s current support zone. A decisive four-hour close below that range would confirm the bearish setup and increase the risk of a deeper decline.The measured downside target sits near $55,000–$56,000, based on the distance between the head and the neckline. Multiple BTC analyses in the past have presented similar downside price targets.Nevertheless, BTC’s bullish structure remains active as long as it holds above $60,000, with the possibility of returning above $81,000 over the next few months.

Čítaj viac

These XRP price charts hint at a potential 25% relief rally in July

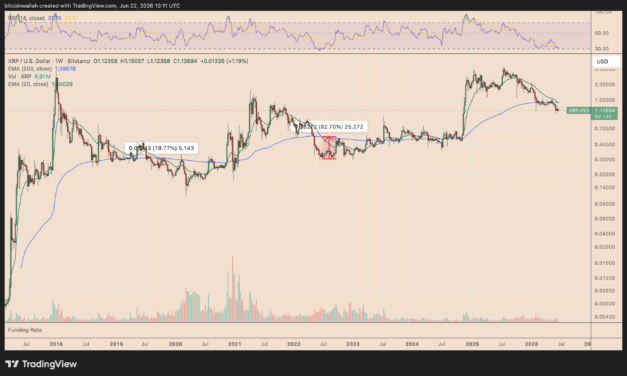
Multiple XRP (XRP) indicators have hinted at a potential 25% relief rally in the coming weeks.Key takeaways:XRP price looks poised to print a rare death cross with a rebound setup toward $1.40.XRP may also be forming a broader bottom, eyeing a larger rally toward $8 in the coming months.XRP’s mean-reversion setup may send price toward $1.40As of Monday, XRP’s 20-week exponential moving average (20-week EMA, green) near $1.40 was on the verge of crossing below its 200-week EMA (blue) near $1.39. A confirmed weekly close below the longer-term average would mark a rare death cross between the two trend gauges.XRP/USD weekly chart. Source: TradingViewIn the past, XRP’s previous 20-week/200-week EMA crosses were followed by relief rebounds back toward the 200-week EMA. That includes a roughly 20% recovery in 2019 and a larger 82.7% rebound in 2022.A similar mean-reversion move this time would put the $1.39–$1.40 area in focus, implying roughly 23%–25% upside by July from XRP’s current price near $1.13.XRP’s weekly relative strength index, or RSI, was also hovering just above the oversold threshold of 30 on Monday. The RSI measures whether an asset is becoming overheated or overly sold. Readings near 30 typically suggest that sellers may be running out of momentum, raising the odds of a short-term rebound even if the broader trend remains weak.XRP shorts create $1.40 price magnetBinance XRP/USDT liquidation heatmap data further supports the relief-rally setup. The chart shows a heavier concentration of short liquidation liquidity above the current price than long liquidation liquidity below it. The largest upside cluster, of around $236.5 million, appears around the $1.37–$1.40 zone, according to CoinGlass data.XRP/USDT 1-month liquidation heatmap. Source: CoinGlassLiquidation heatmaps often highlight where prices may move to flush out crowded leveraged positions. Short sellers positioned above the spot price could be forced to buy back their exposure if XRP starts rebounding from the current $1.13 price levels, adding fuel to a move toward the $1.39–$1.40 area.XRP may rebound toward $8: AnalystA separate long-term chart from analyst Cryptollica suggests that XRP’s next rebound could be part of a broader bottoming setup.The chart shows XRP’s 10-day RSI hovering near the low-30s, close to the level that has historically appeared around major accumulation phases.XRP/USD 10-day chart. Source: TradingView”In 13 years, XRP has only been this washed out 3 times,” Cryptollica said in a Sunday post, adding:”The first 2 times, the crowd laughed, ignored it, and only understood the setup after price had already left.”Cryptollica’s chart also shows XRP trading above the lower boundary of a giant ascending channel, a long-term support line that has connected multiple macro lows since 2017.Related: XRP whale wallet withdrawals top 720M as risk-adjusted return data points to opportunityThat trend line currently sits near $0.75, meaning XRP could still see one more downside sweep before a larger recovery begins. In previous cycles, tests of this support area preceded major upside expansions.XRP could first retest the channel support before entering a broader bull-market phase, with the channel’s upper boundary putting a long-term target near $8 in focus if the pattern plays out again.

Čítaj viac

Bitcoin price may hit $24K if US stock market crashes by 50%, analyst warns

Bitcoin (BTC) could tumble by over 60% to under $24,000 in 2026, according to technical analyst Jesse Olson, if the stock market experiences a major crash. Key takeaways:A US stock market crash of over 50% may accelerate BTC’s sell-off.Negative Coinbase premium and persistent ETF outflows hint at de-risking among institutional investors.Bitcoin chart flags $23,980 worst-case downside targetIn a Sunday post, Olson shared a two-week Bitcoin chart showing BTC potentially falling toward $23,980, based on a long-term volume-weighted support line from his proprietary Market Sniper Pro VWAP indicator.BTC/USD two-week price chart. Source: TradingView/Jesse OlsonThe yellow line on the chart represents a custom version of anchored volume-weighted average price (aVWAP), a tool traders use to track the average price of an asset, weighted by volume, from a specific starting point.In Bitcoin’s case, Olson appears to have anchored the line from the 2022 bear market bottom, allowing it to slope forward as a potential long-term support zone.Olson presented the $23,980 level as his base-case Bitcoin forecast in a severe macro sell-off, wherein the stock market drops by over 50%. The type of stress Olson warns about is already being flagged by veteran market observers.For instance, GMO co-founder Jeremy Grantham has called the ongoing AI market boom a major speculative bubble. While Michael Burry has compared the current rally to the final stages of the Dot-com mania.Related: Arthur Hayes dumps HYPE, NEAR as he warns of AI IPO waveEconomist Gary Shilling has also warned that a US recession is “almost inevitable” by year-end, with stocks at risk of a 20%–30% decline.BTC often trades like a high-risk asset during market stress. A deep stock-market sell-off could force investors to cut crypto exposure, turning Olson’s $23,980 level into a key downside level to watch.Bitcoin institutional demand remains weakAnother bearish signal comes from the Coinbase Premium Index, which tracks Bitcoin’s price gap between Coinbase and Binance.A positive premium usually points to stronger US institutional demand, while a negative reading suggests weaker professional buying or heavier selling on Coinbase. In Bitcoin’s case, the index has largely remained negative so far in 2026, showing that institutional buyers are still not stepping in with conviction.Bitcoin Coinbase Premium Index vs. price. Source: CryptoQuant/DarkfostSpot Bitcoin ETFs are showing a similar trend. Since May, the US-based funds have recorded $4.68 billion in net outflows, according to SoSoValue data, reflecting weaker demand from professional investors and other ETF buyers.US Bitcoin ETF net flows. Source: SoSoValue”These investors don’t act like retail,” said Darkfost, a CryptoQuant-associated on-chain analyst, in a Sunday post, adding: “They operate under permanent risk management logic, they’re not looking to buy a potential bottom, they’re looking for confirmation, for performance. And that’s not the case yet.”In the past, multiple analysts, including Galaxy Digital’s Alex Thorn and pseudonymous trader Crypto Kid, have said Bitcoin could decline below $30,000 in the event of a stock market crash.

Čítaj viac

Získaj BONUS 8 € v Bitcoinoch

nakup bitcoin z karty

Registrácia Binance

Burza Binance

Aktuálne kurzy