Autor William Suberg

Bitcoin drops to $58K on high US PCE inflation as trader sees 'manipulation'

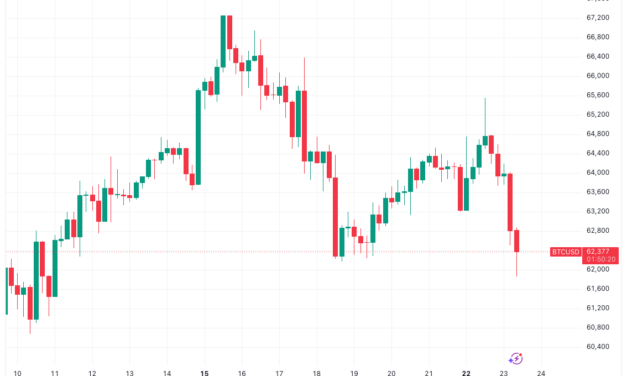
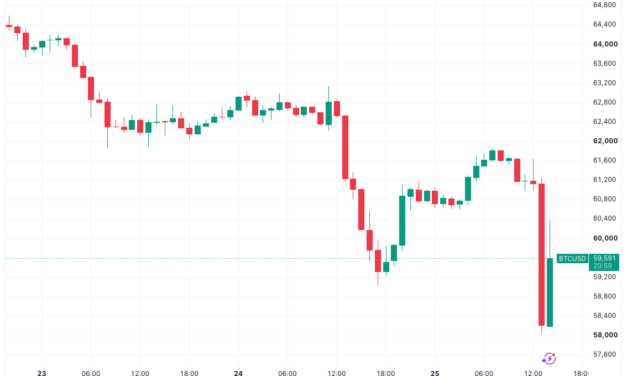
Bitcoin (BTC) hit new 21-month lows at Thursday’s Wall Street open as high US inflation unsettled stock markets.Key points:Bitcoin returns to its lowest level since September 2024, dropping to $58,000.US PCE inflation rocks equities, with the Nasdaq 100 shedding 2% in just 30 minutes.BTC’s correction mirrors the price action seen throughout the 2022 bear market.Crypto liquidations pass $600 million in an hour as BTC price dropsData from TradingView showed BTC/USD dropping to $58,035 on Bitstamp — a level it last traded at in September 2024.BTC/USD one-hour chart. Source: Cointelegraph/TradingViewThe May print of the US Personal Consumption Expenditures (PCE) index came in at 4.1%, setting a new three-year record.“From the preceding month, the PCE price index for May increased 0.4 percent. Excluding food and energy, the PCE price index increased 0.3 percent,” a data release from the Bureau of Economic Analysis (BEA) stated. “From the same month one year ago, the PCE price index for May increased 4.1 percent. Excluding food and energy, the PCE price index increased 3.4 percent from one year ago.”US PCE one-month % change (screenshot). Source: BEAStocks reacted with volatility, with the Nasdaq Composite Index down 0.5% at the time of writing, while the S&P 500 managed to eke out a gain.The Nasdaq 100, meanwhile, saw a larger snap decline of 2% in just 30 minutes at the open.“What a chart,” trading resource The Kobeissi Letter responded on X.Bitcoin itself sparked considerable long position liquidations, with CoinGlass putting the cross-crypto liquidation total at $600 million over a single hour.Crypto liquidation history (screenshot). Source: CoinGlassCommenting, market participants suggested that price moves were being artificially managed to squeeze positions.“$BTC is in the manipulation phase,” pseudonymous trader Killa told X followers. “Every time $BTC trades sub-$60K, that is our manipulation beneath the significant $60K swing low on the weekly and quarterly. Precisely the reason why the orderbook is stacked below us.”Source: Killa/XNiels Klaver, cofounder of crypto platform STABL Agency, suggested that BTC/USD “seems to be going for its final leg down of this bear market.” “$55K remains the target,” he added, referring to an increasingly popular short-term price goal.BTC/USDT one-week chart. Source: Niels Klaver/XBitcoin analysis sees new resistance near $65,000As BTC price action attempted a modest rebound, trader and analyst Rekt Capital had already described $60,000 support as “clearly weakening.”Related: BTC price four-year trend calls for $76K as analysis says Bitcoin ‘not broken’“Once June Monthly Closes, we’ll know from which price July will be able to potentially spring into a post-breakdown relief rally,” an X post read.BTC/USD one-month chart. Source: Rekt Capital/XRekt Capital maintained that the market was acting similarly to 2022, with the 50-month exponential moving average (EMA) tipped to become new resistance next.BTC/USD one-month chart. with 50EMA. Source: Cointelegraph/TradingView

Čítaj viac
Bitcoin falls under $60K, but traders anticipate 15% bounce

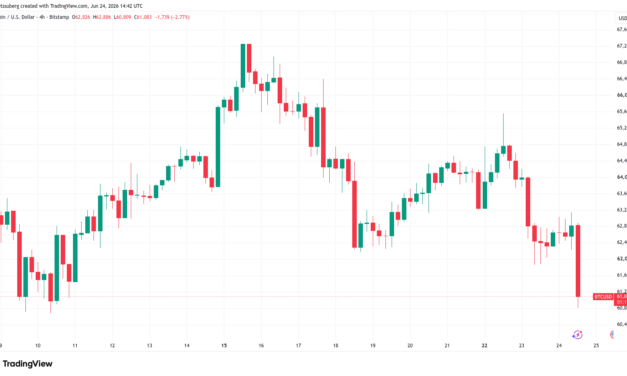
Bitcoin (BTC) hit new two-week lows at Wednesday’s Wall Street open as traders predicted a rally to a “poor” lower high.Key points:Bitcoin price action edges closer to range lows, which traders still see holding.A relief bounce should enter soon, they say, with targets closer to $70,000.US-Iran peace progress has little bullish impact on risk assets, with US stocks flat at the open.BTC price nears range lows: Is $70,000 next?Data from TradingView showed BTC price action dropping below $60,000 for the first time since June 10.BTC/USD four-hour chart. Source: Cointelegraph/TradingViewTraders had warned of increasing short interest with rising funding rates, boosting the odds of a capitulatory move lower.“It’s time to start bouncing soon on the LTF,” trader Killa wrote in ongoing commentary on X, referring to low time frames. “Range bound till proven otherwise.”BTC/USD chart segment. Source: Killa/XKilla uploaded a further chart showing a relief bounce toward $70,000, being due following the bounce.BTC/USD chart segment. Source: Killa/XFellow trader RektProof had a broadly similar forecast, seeing BTC/USD trading in a range with $60,000 as its floor “for the rest of the month.”“Overall, a move to supply and back down to the EQ lows before forming back to poor highs + 70k,” he added.BTC/USDT one-hour chart. Source: RektProof/XStocks tread water as Hormuz oil transit progressesOn a macro level, US stocks appeared to have already priced in relief from the US-Iran peace deal.Related: BTC price four-year trend calls for $76K as analysis says Bitcoin ‘not broken’Upside was limited at the open despite US President Donald Trump offering further details of mutual cooperation between the two sides.Trump specifically made reference to the Strait of Hormuz oil transit route, writing in a post on Truth Social that there would be “no tolls, no insurance costs, & no other charges of any kind being sought or received by Iran on ships traveling” via the route.Source: Truth SocialThe S&P 500 traded up 0.4% at the time of writing, while the Nasdaq Composite Index even turned slightly negative on the day.Earlier, Cointelegraph reported on several factors keeping risk-asset enthusiasm in check, including forward earnings guidance by tech giant Micron Technologies and the May print of the Personal Consumption Expenditures (PCE) index, due out on Wednesday and Thursday, respectively.

Čítaj viac

BTC price four-year trend calls for $76K as analysis says Bitcoin 'not broken'

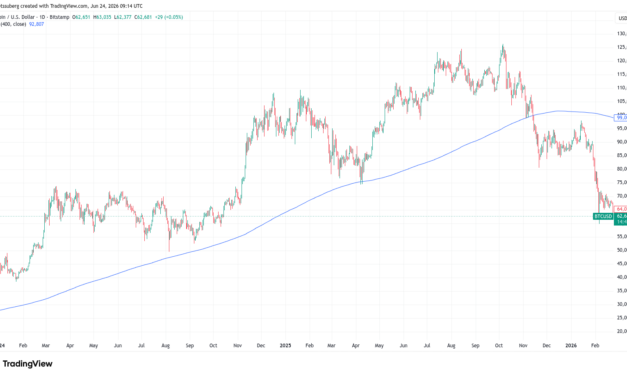
Bitcoin (BTC) is “compressed” at low levels but its classic cycles remain intact, say new research.Key points:Bitcoin is acting just like in prior cycles as it circles a key four-year trend line.Analysis says that BTC price action is currently “compressed” as it trades below a $76,400 target.A new estimate put the bear market as just over 70% complete.Analysis on $62,000 BTC price: Bitcoin “not broken”In an X post on Wednesday, analyst David Eng said that BTC price action still “runs on two clocks.”“400-day clock, $BTC looks cyclical. ~4-year clock, the cycle noise gets filtered out and the adoption structure appears,” he summarized.Marking time for Eng are the 400-day simple moving average (SMA), as well as its four-year equivalent. The former is notable for its ability to act as support throughout Bitcoin bull markets, seeing no daily candle closes below it this cycle or last.BTC/USD one-day chart with 400SMA. Source: Cointelegraph/TradingViewOn four-year time frames, meanwhile, a cleaner uptrend emerges, with price fluctuating above and below the trend line depending on its position in the cycle.“The point is that Bitcoin keeps stretching away from this adoption structure and then reverting back toward it,” Eng summarized.Currently, the four-year trend line suggests a fair price of around $76,400, making BTC/USD undervalued by around 20%. A chart uploaded by Eng also shows Bitcoin’s Power Law price, this now well into uncharted territory at nearly $135,000.“$BTC is not broken,” he concluded. “It is compressed below its adoption structure.”Bitcoin bear market losses could resume in AugustAs Cointelegraph reported, historical comparisons suggest that Bitcoin’s current bear market will continue for some months yet.Related: US dollar strength hits highest since May 2025: Five things to know in Bitcoin this weekThe latest estimates from trader and analyst Rekt Capital put the current downtrend at around 71% complete.His analysis continues to focus on the fate of the 50-month exponential moving average (EMA), currently at $63,900.“At this stage, if June Monthly Closes just like this at $62k then that would confirm the breakdown from the 50-Month EMA. So it July turns into a green month, then that could see price turn the 50 EMA into new resistance,” he told X followers. “Then August would cancel out July and send Bitcoin into downside continuation.”BTC/USD one-day chart with 50-month EMA. Source: Cointelegraph/TradingView

Čítaj viac
Bitcoin teases $62K breakdown as analysis sees Micron earnings volatility next

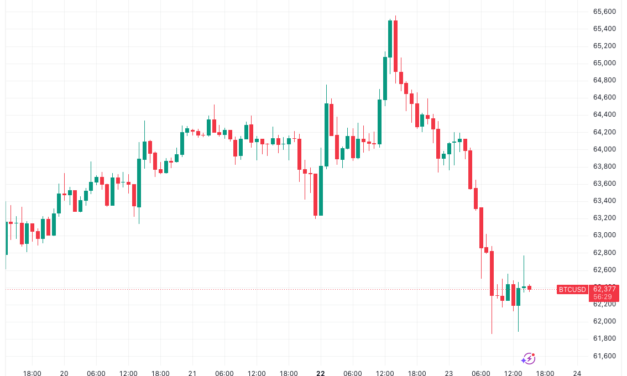
Bitcoin (BTC) stayed uncertain at Tuesday’s Wall Street open as US stocks responded to an earlier Asia tech sell-off.Key points:Bitcoin bulls attempt to avoid a deeper drop below local lows amid risk-asset volatility.Multiple factors are blamed for the current weakness and stocks reset, with Micron earnings due on Wednesday.Rolling crypto liquidations pass $1 billion over 24 hours.BTC price on the edge amid stocks volatilityData from TradingView showed indecisive BTC price moves on low time frames with $62,500 now a focus.BTC/USD one-hour chart. Source: Cointelegraph/TradingViewAsia market weakness sparked two dips below the $62,000 mark on the day, with equities seeing major losses. The US reaction was less intense, with the S&P 500 and Nasdaq Composite Index down 1% and 1.3%, respectively, at the time of writing.S&P 500 one-hour chart. Source: Cointelegraph/TradingViewDiscussing the current landscape, trading resource The Kobeissi Letter added expectations over tech giant Micron Technologies’ Q3 earnings guidance to the volatility mix, this due out on Wednesday.“Speculation over Micron’s earnings is a key factor driving this volatility,” it wrote in a post on X. “The stock is now worth over $1.2 trillion and driving a broader momentum-based rally that is largely dependent on sentiment around Micron’s stock.”Micron Technologies stock one-day chart. Source: Cointelegraph/TradingViewKobeissi attributed Korea’s market drop to legal concerns over unrealized gains, as well as increased leveraging among traders.“The result is amplified volatility in both directions, which also explains why the S&P 500 is already up +60 points from its opening low,” it added.“When you zoom out, the broader AI narrative has only strengthened and market volatility is completely normal after the run we just saw.”VIX volatility index one-day chart. Source: Cointelegraph/TradingViewBitcoin fuels major crypto liquidation surgeStill in a narrow range, BTC price action thus surfed patches of nearby liquidity, with both long and short positions paying.Related: US dollar strength hits highest since May 2025: Five things to know in Bitcoin this weekData from CoinGlass put 24-hour crypto liquidations at nearly $700 million.“$65K did indeed not end up holding which quickly moved this down to grab the liquidity below $62K,” trader Daan Crypto Trades commented while analyzing the numbers.Crypto liquidations (screenshot). Source: CoinGlassAnalytics account CryptoReviewing described the liquidity imbalance between long and short as “ridiculous,” noting that the rolling 24-hour tally had reached up to $1 billion on Tuesday.“Bulls might enjoy what happens next,” it forecast alongside an X video update. 

Čítaj viac

Bitcoin gets new $54K warning as BTC price hits 11-day low on Asia tech sell-off

Bitcoin (BTC) neared two-week lows on Tuesday as Asia stock markets pulled back on a tech sell-off.Key points:Bitcoin heads lower with Asia equities as “unprecedented inflows” become a tech-driven rout.Analysis warns of “new lows” for BTC price, with one target at $54,000.Options markets continue to seek a suitable catalyst for volatility.BTC price dips under $62,000 as Korea stock market drops 10%Data from TradingView showed local lows of $61,860 for BTC/USD, a level last seen on June 11.BTC/USD four-hour chart. Source: Cointelegraph/TradingViewAsia signaled cold feet among investors as major tech stocks saw blanket selling, leading to significant overall downside.South Korea’s Composite index was down 10% at the time of writing, while the Japanese Nikkei 225 shed nearly 4%.Korea Composite Stock Price Index one-hour chart. Source: Cointelegraph/TradingViewThe reversal soured a conspicuous liquidity surge for both Korea and Taiwan, with trading resource The Kobeissi Letter reporting “unprecedented inflows” to both.“Total equity fund inflows into Taiwan have risen to +155% of assets under management (AUM) since January 2024, the largest among all global markets. South Korea has followed closely, at +150% of AUM over the same period, tripling so far in 2026,” it wrote in a post on X on Monday. “Both are now running at least +500% above every other market.”Stock-market inflow comparison. Source: The Kobeissi Letter/XBTC price action remained sensitive to the volatility with a failed push beyond $65,500 the day prior.“$BTC took 65K liquidity and dumped,” trader Lennaert Snyder responded on X.Snyder suggested that a long entry was now at $60,000 and was waiting for “new lows” to appear next.BTC/USDT four-hour chart. Source: Lennaert Snyder/X“$BTC stuck between a bearish flag,” analytics account CryptoReviewing continued. “A close below $64,000 could push bitcoin towards $54,000 in coming days.”BTC/USDT four-hour chart. Source: CryptoReviewing/XBitcoin options “unconvinced” of volatility potentialSuch a drop would shake up a sideways status quo in place for a month.Related: US dollar strength hits highest since May 2025: Five things to know in Bitcoin this weekIn its latest Markets Color analysis, trading resource QCP Capital pointed to this lack of volatility triggering fatigue in the options market.“Despite what is shaping up to be an eventful week, crypto volatility has shown little reaction and remains broadly unchanged,” it noted.“Following nearly a month of range-bound price action, the options market appears unconvinced that any single catalyst will be sufficient to push BTC decisively out of its current range.”Bitcoin options volume by expiry date (screenshot). Source: CoinGlassQCP pointed to “seasonality” potentially influencing behavior ahead of a quarterly options expiry event on Friday.“Crypto implied volatility has historically tended to soften following major quarter-end expiries as option overwriters redeploy capital,” it added.

Čítaj viac

Získaj BONUS 8 € v Bitcoinoch

nakup bitcoin z karty

Registrácia Binance

Burza Binance

Aktuálne kurzy