
Autor Cointelegraph By Yashu Gola

Fish food? Data shows retail investors are buying Bitcoin, whales are selling

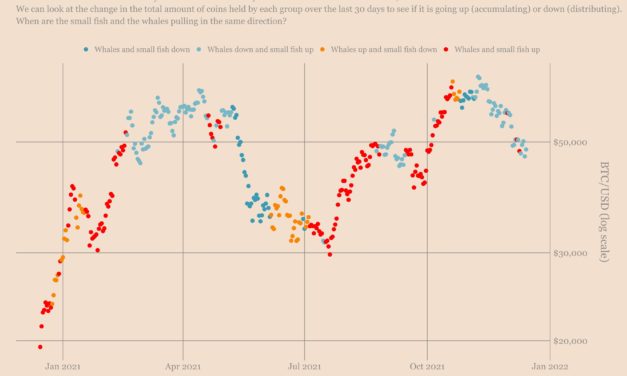
Bitcoin (BTC) staged an impressive recovery after dropping to its three-month low of $42,333 on Dec. 4, rising to as high as $51,000 since. The BTC price retracement primarily surfaced due to increased buying activity among addresses that hold less than 1 BTC. In contrast, the Bitcoin wallets with balances between 1,000 BTC  and 10,000 BTC did little in supporting the upside move, data collected by Ecoinometrics showed.”Bitcoin is still stuck in a situation where small addresses are willing to stack sats [the smallest unit account of Bitcoin], while the whale addresses aren’t really accumulating,” the crypto-focused newsletter noted after assessing the change in Bitcoin amounts across small and rich wallet groups, as shown in the graph below.Bitcoin on-chain data featuring fish and whale BTC wallet clusters. Source: Ecoinometrics Ecoinometrics further asserted that the situation for Bitcoin is “not ideal,” suggesting that the BTC price may end up resuming its decline in the absence of influential buyers.Bitcoin’s downside target sits near $42KEcoinometrics’ bearish outlook appeared as Bitcoin grappled with the Federal Reserve’s policy decision on Wednesday to reduce its bond purchases by $30 billion every month to unwind them down by April next year entirely.The $120 billion a month stimulus program was instrumental in sending the BTC price from below $4,000 in March 2020 to $69,000 in Nov 2021. And now that the liquidity threatens to go away, with lending to become costlier as the Fed prepares for three rate hikes next year, many fear that it would hurt investors’ appetite for risk assets like Bitcoin.Bitcoin price briefly popped above $49,000 after the Fed FOMC meeting confirmed at least three interest rate hikes and some adjustments to the current market supporting practices in 2022. https://t.co/TpTX7tGmYL pic.twitter.com/lXw47icZmB— Cointelegraph Markets (@CointelegraphMT) December 15, 2021Mike Novogratz, chief executive officer of Galaxy Digital Holdings, admitted that Bitcoin might feel “pain ahead” but anticipated that its price would not fall anywhere beyond the $42,000-support.“$42,000 is at a pretty important level, and low 40s should hold,” the crypto billionaire told Bloomberg TV in an interview Tuesday, adding:”So much money is pouring into the space, it would make no sense that the crypto prices would go much below that. If you’re long, it feels painful, but it’s probably healthy.”BTC/USD daily price chart showing $40K-42K support. Source: TradingViewBitcoin accumulation stronger among retailIn reality, unique wallets holding more than or equal to 1,000 BTC have been declining all across 2021, with data from Glassnode showing its number dropping to 2,147 from 2,475 since Feb. 9.The total number of Bitcoin addresses with at least 1,000 BTC balance. Source: GlassnodeIn contrast, the number of unique wallets holding at least 0.01 BTC (around $485 at current exchange rates) rose in 2021, from 8.46 million to 9.39 million year-to-date. Meanwhile, addresses holding at least 0.1 BTC (~$4,855) surged from 3.12 million to 3.30 million in the same period, indicating that “fishes” played a key role in pumping the Bitcoin price from around $30,000 to as high as $69,000 this year.The total number of Bitcoin addresses with at least 0.01 BTC and 0.1 BTC balance. Source: GlassnodeOne more piece of evidence showing that retail investors have been bullish on Bitcoin, came from addresses that hold at least 1 BTC. Related: Analysts expect Bitcoin trend change after Fed lays out its 2022 roadmapThese wallets decreased in quantity in the first half of 2021 as the BTC market grappled with the China ban and other negative news, but started increasing the second half as El Salvador adopted Bitcoin as its legal tender.The total number of Bitcoin addresses with at least 1 BTC balance. Source: GlassnodeThe number of Bitcoin wallets with at least 1 BTC also kept rising during the BTC price correction from $69,000 to $42,333 in the November-December session, signaling accumulation. It reached a seven-month high on Wednesday just as Bitcoin underwent a rebound to $50,000 from its weekly low near $46,000.On-chain analyst Willy Woo also spotted retail accumulation rising to levels seen after the March 2020 crash, which led to Bitcoin’s two-year-long bull run.Accumulation among wallets holding less than 1 BTC. Source: WIlly WooAdditionally, Bitcoin’s momentum indicator that preceeded its price breakout to $69,000 earlier this year is also hinting at a potential BTC price breakout ahead.The views and opinions expressed here are solely those of the author and do not necessarily reflect the views of Cointelegraph.com. Every investment and trading move involves risk, you should conduct your own research when making a decision.

Čítaj viac
Crypto Santa: Trader nets $34K shorting AVAX and LUNA, buy toys for kids

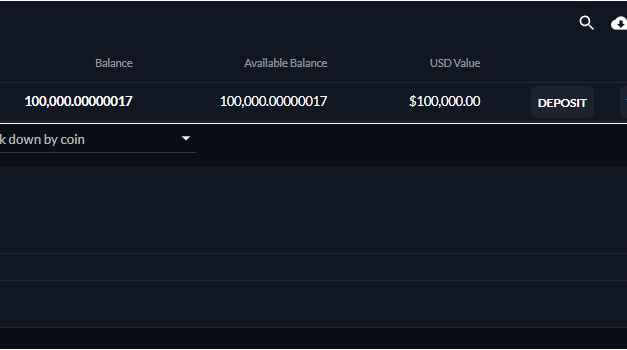
A popular cryptocurrency trader under the Twitter pseudonym “Sicarious” donated a portion of its crypto profits to buy Christmas presents and other utilities for underprivileged children.The donations included $7,250 worth of livestock, clean water, Bibles, emergency food for Compassion International, a child sponsorship nonprofit, and another $1,500 to purchase and donate toys for kids — who would otherwise do without at Christmas — via Toys for Tots Foundation.Shorting the crypto price declinesSicarious also shared the screenshot of its profits and loss statements that showed that it had made nearly $6,500 and $27,500 in gains by shorting Terra (LUNA) and Avalanche (AVAX) recent price drops, respectively. That left the trader with enough leftover profits to continue its donation spree until the end of this year.Walmart is going to need more LEGOs… pic.twitter.com/k5X19VxOZo— Sicarious (@Sicarious_) December 13, 2021In detail, Sicarious announced on Dec. 5 that it would donate any profits made until the end of 2021 for children-related causes as a part of a so-called “Christmas challenge.” In announcing so, the anonymous trader put $100,000 into its FTX account, adding that if it nukes the amount, it would still donate whatever it can afford.A screenshot taken on Dec. 5 from Sicarious’s account. Source: TwitterOn Dec. 15, Sicarious closed another AVAX short in profits and used about $2,000 worth of proceeds to benefit a local food pantry.The trader’s initiative also inspired others to commit their realized crypto profits to causes. For instance, another Twitter user “Aeroplaine” claims to have deposited $50,000 into a dYdX perpetual exchange account, stating that it would donate all the gains to charitable causes in Malaysia.A good-hearted crypto tax strategy, meanwhileWhile Sicarious’s citizenship remains unclear, the copies of the traders’ bills and mention of the retail store Walmart in its tweets indicate that it lives in the U.S., a country with one of the most stringent crypto tax laws.The U.S. Internal Revenue Services (IRS) classifies cryptocurrencies as property. Meaning, if one’s crypto investments increase in value, s/he would need to pay a capital gain tax when they spend it. That also means keeping a tax record in check on a $2 coffee bill if paid via crypto.But donating crypto to charity somewhat allows taxpayers to brush off IRS’s tax-filing process. And since donations, on the whole, are not taxable events, one can offload their crypto profits as donations and deduct the same amount from their net tax liabilities in the financial year.But there remains a big takeaway: whether to first secure the crypto profits in cash and then donate or to pledge the money in crypto. The Giving Block, a crypto donation service, provided an answer back in 2020. The firm noted that cashing out crypto first would leave traders with a higher capital tax liabilities while donating directly via crypto would mean no tax responsibilities for the donor. Comparing crypto tax methods. Source: The Giving BlockThe direct-crypto-donation strategy seems to have worked well so far. For instance, Fidelity Charitable, the U.S.’s largest grantmaker, received over $274 million in cryptocurrencies this year, according to a company’s spokesperson quoted in the Los Angeles Times. Related: The Giving Block raises $2.4M for charity on ‘CryptoGivingTuesday’The amount came out to be almost four times higher than 2017’s peak of $69 million.Engiven, a crypto-enabled donation platform, also reported last month that it processed a $10 million Bitcoin donation to a faith-based organization.The views and opinions expressed here are solely those of the author and do not necessarily reflect the views of Cointelegraph.com. Every investment and trading move involves risk, you should conduct your own research when making a decision.

Čítaj viac
Cardano: ADA price eyes 30% rally with a potential 'triple bottom' setup

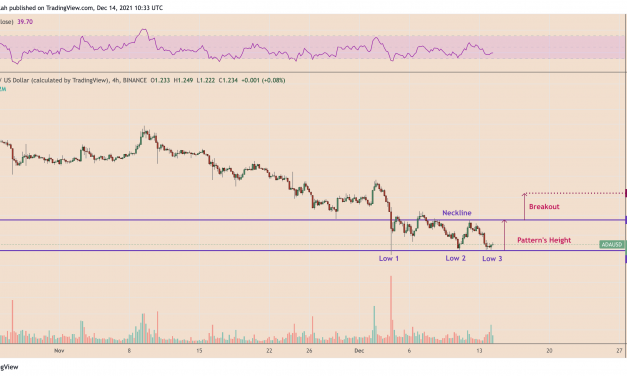
Cardano (ADA) may rally by nearly 30% in the coming days as it hints at forming a classic bullish reversal pattern.Sharp ADA rebound underwayDubbed “triple bottom,” the pattern typically occurs at the end of a downtrend and consists of three consecutive lows printed roughly atop the same level. Meaning, triple bottoms indicate sellers’ inability to break below a specific support level on three back-to-back attempts, which ultimately paves the way for buyers to take over.In a perfect scenario, the return of buyers to the market allows the instrument to retrace sharply towards a higher level, called “neckline,” that connects the highs of the previous two rebounds. The move follows up with another breakout, this time taking the price higher by as much as the distance between the pattern’s bottom and neckline.So far, the ADA price has been able to paint the triple bottom halfway, now rebounding after forming the third low, as shown in the chart below.ADA/USD four-hour price chart featuring triple bottom setup. Source: TradingViewThe point at which the ADA price reversed accompanied a rise in trading volume, suggesting that the rebound had enough backing from the buyers. Therefore, the Cardano token looks poised to at least pursue a run-up towards $1.40.Moreover, if the price further breaks above the neckline level decisively, it would likely continue to rally until it hits $1.63 — as per the triple bottom scenario.Accumulation areaThe potential triple bottom scenario emerged after ADA’s price plunged by more than 60% from its record high of $3.16 achieved on Sept. 2 earlier this year. It also surfaced as the Cardano token became one of the worst performers quarter-to-date, dropping nearly 45.50% compared to its top rival Ether’s (ETH) 15% gains.ADA’s multi-month selloff pushed its daily relative strength index (RSI), a momentum indicator, into oversold territory. In addition, Cardano token’s price drop also led it to what appears like a dependable “accumulation area,” as shown in the chart below. ADA/USD daily price chart featuring accumulation area and oversold RSI. Source: TradingViewBoth RSI and the accumulation area also point to a buying scenario in the ADA market, thus supporting the triple bottom scenario on the four-hour chart.Risks remain for ADA priceIt is important to notice that ADA dropped by more than 5.50% in the past 24 hours, much in sync with other top crypto assets in the space, with Bitcoin (BTC) sinking by over 3% and Ether by almost 5% in the same period.At the core of the crypto market’s uniformed decline was the Federal Reserve’s two-day policy meeting starting Tuesday. In the meetup, the U.S. central bank would likely decide to accelerate the tapering of its $120 billion a month asset purchasing program, one of the key catalysts behind the crypto and stock market rally since March 2020.Other parts of the Fed meeting would see the officials discussing the prospects of rate increases next year from its current near-zero levels. Cheaper lending had also played an important role in pushing the Bitcoin and altcoin market prices higher across 2020 and 2021, including ADA.Related: Bitcoin price dip may end Wednesday as Bitfinex bids hint at Fed ‘buy the news’ plansAs Fed officials initiate their policy meeting, the Cardano token would be testing $1.18 as its weekly support for a potential price rebound. The $1.18-level is the 0.618 Fib line of what appears to be an accurate Fibonacci retracement graph in predicting ADA’s support and resistance levels. ADA/USD weekly price chart. Source: TradingView.comShould ADA fail to rebound and close below $1.18, its next Fib support may come at 0.786 Fib line near $0.674, around 42% below. Nonetheless, ADA/USD may also test $1 as psychological support for an early upside retracement, similar to its multiple rebounds between February and July 2021.The views and opinions expressed here are solely those of the author and do not necessarily reflect the views of Cointelegraph.com. Every investment and trading move involves risk, you should conduct your own research when making a decision.

Čítaj viac
Small Ethereum investors increase exposure as ETH loses $4K level

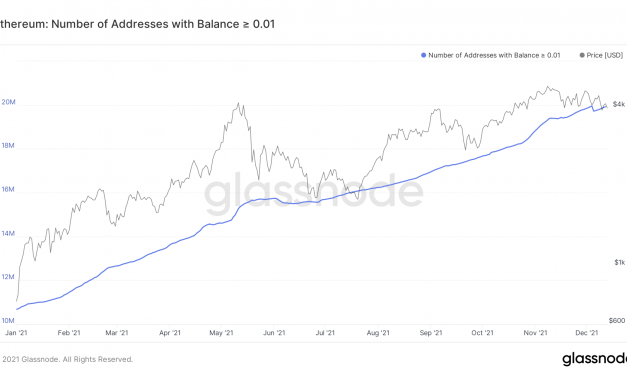
Ethereum’s native token Ether (ETH) has dropped by over 18% after establishing an all-time high around $4,867 on Nov. 10, now trading near $3,900. Nonetheless, the plunge has not deterred retail investors from buying the token in small quantities.According to data gathered by Glassnode — a blockchain analytics platform, the number of Ether addresses holding less than or equal to 0.01 ETH reached a record high level of 19.95 million on Dec. 4, the day ETH dropped to as low as $3,575 (data from Coinbase).Ethereum addresses with balances less than or equal to 0.01. Source: GlassnodeMeanwhile, the number of Ethereum wallets with balances of at least 0.1 ETH also kept climbing despite Ether’s correction from $4,867 to $3,575, eventually hitting a new all-time high of 6.37 million on Dec. 12. As a result, the number of Ether addresses with a non-zero balance also reached a new record high of nearly 70 million on Dec. 12. In contrast, addresses holding less than or equal to 1 ETH dropped alongside prices, indicating that they were less interested in buying Ether’s sessional dips.  Ethereum addresses with balances less than or equal to 1 ETH. Source: GlassnodeBounce ahead?The army of retail investors buying Ether in small quantities marches ahead as the ETH price drops toward a support confluence.Notably, Ether plunged Monday by over 5% to near $3,900 in a selloff inspired by similar corrections across the cryptocurrency space. Nonetheless, ETH price reached an area that has been lately attracting buyers.ETH/USD daily price chart featuring Support Confluence. Source: TradingViewThe first support came from the lower trendline of the descending channel pattern — the blacked range shown in the chart above. Meanwhile, the purpled 100-day simple moving average (100-day SMA) and the red pullback area — as it has been since Oct. 20 — raised Ether’s potential to retrace upward in the near term.While smaller retail investors seem to have been accumulating Ether, their larger counterparts look conflicted.Ethereum addresses with balances less than or equal to 1,000 ETH. Source: GlassnodeFor instance, Glassnode data shows a marginal recovery in the buying interest by the Ethereum wallets with balances of at least 1,000 ETH. Still, overall, their numbers have gone down from near 7,200 to below 6,350 in 2021.Exchanges’ Ether balancesMore upside cues come from Ether’s declining balances across all the crypto exchanges. The number of coins held by exchanges recovered from nearly 14 million ETH to 14.13 million ETH since Dec. 9 — which coincided with an almost 10.50% price drop — but its long-term trend remains skewed to the downside.Ethereum balance on all exchanges versus ETH price. Source: GlassnodeA lower ETH balance across exchanges hints at traders’ intention to hold their coins or stake them in the pools of decentralized finance (DeFi) projects to earn yields instead of trading them for other assets.Related: Data shows pro traders are currently more bullish on Ethereum than BitcoinDeFi’s total value locked (TVL) sits at a new all-time high above $250 billion, according to data provided by Defi Llama, out of which Ethereum’s TVL came out to be over $180 billion.Total capital locked across the Ethereum ecosystem. Source: Defi Llama”However, Ethereum’s dominance over DeFi activity has taken a big hit in H2 2021,” reminded Delphi Digital, a crypto-focused investment firm, adding that: “As the multi-chain narrative plays out, capital has moved to ecosystems like Solana, Terra and Avalanche.”High gas fees have been the main reason behind investors seeking potential “Ethereum killers.”For instance, a decentralized exchange swap costs $70 on Ethereum but $1 on Terra and Solana, although some analysts anticipate that Ethereum’s full transition from proof-of-work to proof-of-stake next year would solve the high gas problem.”Ethereum’s price will rise at a much faster rate than Bitcoin, due to the move to proof-of-stake,” noted Tom Higgins, CEO at asset management platform Gold-i.The views and opinions expressed here are solely those of the author and do not necessarily reflect the views of Cointelegraph.com. Every investment and trading move involves risk, you should conduct your own research when making a decision.

Čítaj viac

3 reasons why Ethereum price can drop below $3K by the end of 2021

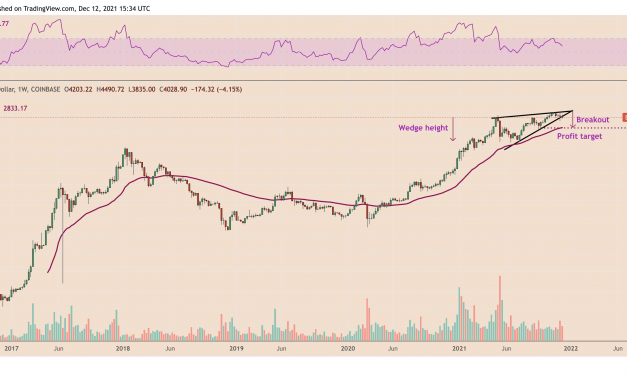
Ethereum’s native token Ether (ETH) reached an all-time high around $4,867 earlier in November, only to plunge by nearly 20% a month later on rising profit-taking sentiment. And now, as the ETH price holds $4,000 as a key support level, risks of further selloffs are emerging in the form of multiple technical and fundamental indicators.ETH price rising wedgeFirst, Ether appears to have been breaking out of “rising wedge,” a bearish reversal pattern that emerges when the price trends upward inside a range defined by two ascending — but converging — trendlines.Simply put, as the Ether price nears the Wedge’s apex point, it risks breaking below the pattern’s lower trendline, a move that many technical chartists see as a cue for more losses ahead. In doing so, their profit target appears at a length equal to the maximum wedge height when measured from the breakout point.ETH/USD weekly price chart featuring Rising Wedge. Source: TradingViewAs a result, Ether’s rising wedge downside target comes out to be near $2,800, also near its 50-week exponential moving average (50-week EMA). Bearish divergenceThe bearish outlook in the Ether market appears despite its ability to bear the massive selling pressures felt elsewhere in the cryptocurrency market in recent weeks.For instance, Bitcoin (BTC), the leading crypto by market cap, fell by 30% almost a month after establishing its record high of $69,000 in early November, much higher than Ether’s decline in the same period. That prompted many analysts to call Ether a “hedge” against the Bitcoin price decline — also as ETH/BTC rallied to its best levels in more than three years.But it does not take away the fact that Ether’s recent price rally has coincided with a decline in its weekly relative strength index (RSI), signaling a growing divergence between price and momentum.ETH/USD weekly price chart featuring divergence between price and RSI. Source: TradingViewAdditionally, the recent ETH price pullback also had the RSI oscillator fall below 70, a classic sell indicator.Fed “dot plot”More downside cues for Ether come ahead of the Federal Reserve two-day policy meeting starting on Dec, 14 when the U.S. central bank will discuss how quickly it may need to taper its $120 billion a month asset purchasing program to gain enough flexibility for potential rate hikes next year.Just last month, the Fed announced that it would scale back its bond-buying at the pace of $15 billion per month, suggesting that the stimulus would eventually cease by June 2022. Nonetheless, a string of recent market reports showing a tightening jobs market and persistently mounting inflationary pressures prompted the Fed officials to end tapering “perhaps a few months sooner.”20 CenBanks hold meetings next week as inflation keeps rising w/final decisions for 2021 due at Fed, ECB, BoJ, BoE which together responsible for half of world econ. CenBank balance sheets have risen in lockstep to ATHs, but now there could be divergence. https://t.co/GgOLGCNbjR pic.twitter.com/mrrhwUVcet— Holger Zschaepitz (@Schuldensuehner) December 12, 2021Market anticipations also adjusted, with a Financial Times survey of 48 economists anticipating the stimulus to end by March 2022 and most respondents favoring a rate hike in the second quarter.The period of loose monetary policies after March 2020 has been instrumental in pushing the ETH price high by over 3,330%. Therefore, the increasing likelihood of tapering can certainly put the brakes on the current rally, if not the bull market as a whole, according to some ana.From there I expect a very aggressive approach from the Fed because they’ll recognize we are in a bubble and something extreme needs to be done.Then we get our multi-year bear market.— K A L E O (@CryptoKaleo) December 10, 2021

Markets anticipate the Fed will update its policy statement and summary of economic projections (SEP) this week. In doing so, more central bank officials would adjust the “dot plot” to favor an earlier-than-anticipated rate hike against rising inflation.The views and opinions expressed here are solely those of the author and do not necessarily reflect the views of Cointelegraph.com. Every investment and trading move involves risk, you should conduct your own research when making a decision.

Čítaj viac

Získaj BONUS 8 € v Bitcoinoch

nakup bitcoin z karty

Registrácia Binance

Burza Binance

Aktuálne kurzy