Autor Cointelegraph By Yashu Gola

Bitcoin rises above $51K as the dollar flexes muscles against the euro

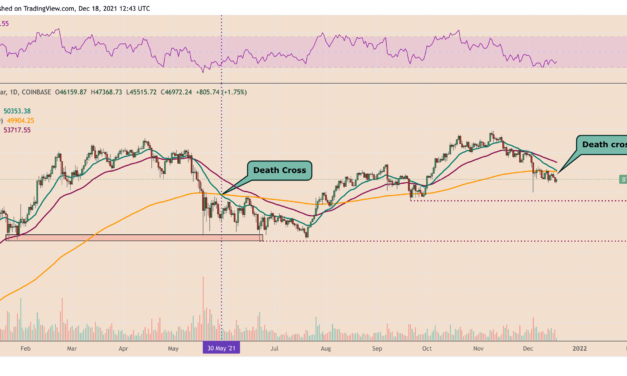
Bitcoin (BTC) regained its bullish strength after reclaiming $50,000 last week and continued to hold the psychological level as support on Dec. 27. Meanwhile, its rival for the top safe-haven spot, the U.S. dollar, also bounced off a critical price floor, hinting that it would continue rallying through into 2022.Triangle breakoutThe U.S. dollar index (DXY), which measures the greenback’s strength against a basket of top foreign currencies, has been trending towards the apex of a “symmetrical triangle” pattern on its daily chart. In doing so, the index has been treating the structure’s lower trendline as its solid support level, thus hinting that its next breakout would resolve to the upside.DXY daily price chart featuring symmetrical triangle setup. Source: TradingViewShould a symmetrical triangle breakout occur, the technical profit target for bulls will be as high as the maximum distance between the structure’s upper and lower trendlines when measured from the breakout point. That puts the dollar en route to roughly 97.80 in the coming session.Weaker euro behind dollar’s strengthThe bullish outlook for the greenback appears against the prospects of the Federal Reserve’s tapering plans. Notably, the U.S. central bank signaled earlier in December its willingness to tighten its ongoing monetary policy faster than expected, adding it would follow up with three rate hikes in 2022.Meanwhile, the recent strength in the dollar index, in part, came due to an ongoing cash glut in the eurozone. A wave of stimulus programs initiated by the European Central Bank (ECB) in the wake of the COVID-19 pandemic left eurozone banks with excessive cash, financial researcher FactSet noted.EUR/USD daily price chart featuring its downtrend since May 2021. Source: TradingViewAs a result, these banks have been now exchanging their extra euros for dollars via the Fed’s reverse repo facility, which offers them 0.05% interest for parking cash, which is better than the short-dated European government debt that comes with negative yields. On Dec. 20, nearly $1.7 trillion flowed into the Fed’s repo facility, the highest one-day cash injection to date.Daily inflows into the Fed’s reverse repo facility rising since May 2021. Source: Federal Reserve Bank of New York Bitcoin’s summer fractal anticipates bull runBitcoin’s latest rise above $51,000 comes as its price tests a multi-month upward sloping trendline as support, as shown in the chart below.BTC/USD daily price chart featuring ascending trendline support. Source: TradingViewNonetheless, BTC price now faces resistance in its 50-day exponential moving average (50-day EMA). The same velvet wave was instrumental in capping Bitcoin’s rebound attempts in November. So the chances of bulls reeling under its pressure are high.But on larger timeframes, there appear possibilities that Bitcoin would continue its bull run further into 2022. For instance, an independent market analyst, Rekt Capital, highlighted the cryptocurrency repeating a trend from its May–July session that later sent its prices to an all-time high of $69,000.”Bitcoin continues to consolidate inside a range formed by two Bull Market EMAs: the green 21-week EMA resistance and the blue 50-week EMA support,” the pseudonymous analyst explained, adding:”Bitcoin formed a similar range inside these two EMAs earlier this year in May (orange circle).”BTC/USD weekly price chart featuring “bull market EMAs” fractal. Source: TradingViewOn the flip side, should Bitcoin break below its 50-week EMA, its likelihood of testing its orange 200-week EMA will become higher based on a similar fractal.BTC/USD weekly price chart featuring 200-week EMA support. Source: TradingViewCurrently, the 200-week EMA sits around $24,250.The views and opinions expressed here are solely those of the author and do not necessarily reflect the views of Cointelegraph.com. Every investment and trading move involves risk, you should conduct your own research when making a decision.

Čítaj viac

Bitcoin 'death cross' that pushed BTC price to $28.8K reappears

A technical sell signal is about to appear on the Bitcoin (BTC) daily chart.On Dec. 18, the BTC price will experience a death cross, a market indicator that occurs when a short-term moving average slips below a long-term moving average. In this case, Bitcoin’s 20-day exponential moving average (20-day EMA) will close below its 200-day exponential moving average (200-day EMA).The indicator may end up alerting traders and investors about a potential selloff in the coming sessions, given its history of predicting bear trends in advance. For instance, the 20-200 bearish crossover that appeared on May 30, 2021, was instrumental in crashing the BTC price from $36,500 to $28,800 in the next 24 days.BTC/USD daily price chart featuring May 2021 death cross. Source: TradingViewA similar death across also surfaced during March 2020’s pandemic-led market crash, exactly a day before the Bitcoin price dropped from nearly $8,000 to below $4,000.BTC/USD daily price chart featuring March 2020 death cross. Source: TradingViewBitcoin risks correction to $40K-42K rangeBitcoin has been correcting consecutively across the last four weeks and looks poised to close the ongoing weekly session in losses, as well, primarily with the Federal Reserve taking more aggressive action on inflation.In the last 30 days, the BTC price has fallen by nearly 17.50%, including a correction from its record high of $69,000 on Nov. 10. In doing so, the cryptocurrency briefly fell to $42,333, only to rebound sharply later, paring some losses, as shown in the chart below.BTC/USD daily price chart. Source: TradingViewNonetheless, the rebound did not turn into a bullish reversal — the Bitcoin price has been trending lower after finding an interim resistance near $50,000, a psychological level.Bitcoin’s efforts to retest $50,000 for a bullish breakout face opposition from its descending channel’s resistance trendline, combined with additional downside pressure from its 20-day EMA and 200-day EMA waves, which are also sitting near $50,000.Related: Bitcoin bears lack ‘balls’ to continue selling into 2022 — analystAs a result, the path of least resistance for Bitcoin appears to the downside. And with the death cross looming, the cryptocurrency would likely continue trending inside the descending channel to test levels around $42,000 for a strong pullback move.If the decline accelerates, the price may eye $40,000 next as its downside target.The RSI factorAnother leg lower would also push Bitcoin’s daily relative strength index (RSI) into its oversold territory below 30, a buying signal. For now, the momentum indicator has been attempting to break above its downward sloping trendline, a move that has earlier predicted Bitcoin’s local price bottoms.BTC/USD daily price chart featuring RSI breakouts. Source: TradingViewOn a shorter timeframe chart, the RSI has been consolidating sideways, anticipating that it would break out of the rectangle range to the upside. At the core of this optimistic outlook is a fractal from September 2021, shared by Mozzi, an independent crypto-market analyst.BTC/USD four-hour chart comparing RSI trends from Sep. 2021 and Dec. 2021. Source: TradingView”Bitcoin is following a similar structure from the end of September,” the analyst noted on Saturday. “Notice the RSI consolidation. Waiting on a clear break of the upper trendline as confirmation.”The views and opinions expressed here are solely those of the author and do not necessarily reflect the views of Cointelegraph.com. Every investment and trading move involves risk, you should conduct your own research when making a decision.

Čítaj viac

Avalanche eyes 60% rally as AVAX price breaks out of bull flag

Avalanche (AVAX) strengthened its case for a potential upside run towards $160 in the coming sessions as it broke out of a classic bullish pattern earlier this week.Dubbed “bull flag,” the pattern emerges when the price consolidates lower/sideways between two parallel trendlines (flag) after undergoing a strong upside move (flagpole). Later, in theory, the price breaks out of the channel range to continue the uptrend and tends to rise by as much as the flagpole’s height.AVAX went through a similar price trajectory across the last 30 days, containing a roughly 100% flagpole rally to nearly $150, followed by over a 50% flag correction to $72, and a breakout move above the flag’s upper trendline (around $85) on Dec. 15.AVAX/USD daily price chart featuring Bull Flag pattern. Source: TradingViewAVAX price continued rallying after breaking out of its bull flag range, reaching almost $120 on Friday but eyeing a further leg up towards its bullish continuation target near $160. The level appeared after adding the height of AVAX’s flagpole, which is around $75, to the current breakout point near $85.A week full of bullish AVAX eventsThe recent buying period in the Avalanche market picked momentum also because of a flurry of positive catalysts this week.AVAX jumped nearly 10.50% on Tuesday as Avalanche added the native version of USDC, a dollar-pegged stablecoin issued by Circle, on its blockchain. Additionally, a report penned by Bank of America analysts published on Dec. 10, called Avalanche a viable alternative to the leading smart contract platform Ethereum. That coincided with AVAX gaining another 16%.AVAX/USD daily price chart featuring key events in the week ending Dec. 19. Source: TradingViewOn Thursday, AVAX rallied to its two-week high after BitGo, a crypto custodian with over $64 billion worth of assets under management, announced that it would support the token. Nonetheless, a modest selloff at the local price top pushed AVAX lower. Th recover Friday as Avalanche announced that it has collaborated with web3 accelerator DeFi Alliance to launch a gaming accelerator program.1/ Avalanche is collaborating with @DeFiAlliance to bring its accelerator programs to the Avalanche communityApply by Jan 7 here: https://t.co/6HcJOLxKxABefore you apply, check these reasons why Avalanche should be your preferred platform: pic.twitter.com/GhdHBhQNgb— Avalanche (@avalancheavax) December 17, 2021All the events mentioned above pointed towards the Avalanche ecosystem’s growth. For instance, with USDC, the project promised to provide a viable alternative to Ethereum’s highly expensive Tether (USDT) stablecoin transactions. Moreover, by gaining BitGo as AVAX’s institutional custodian, Avalanche appears to be prepping for catering to accredited investors. Mike Belshe, CEO of BitGo, explained:“Institutional custody is not the same as retail custody, and BitGo wallets and custody were designed from the ground up to meet the needs of institutional investors, and BitGo is the only independent qualified custodian focused on building the right market structure and facilities to enable institutions to enter the digital asset space with confidence.”AVAX price risksOne of the remaining downside risks around AVAX concerns the crypto market performance, on the whole.In detail, AVAC rallied in a week that witnessed the entire cryptocurrency market capitalization lose more than $114 billion, with leading crypto assets Bitcoin (BTC) and Ether (ETH) plunging over 7% and 5% week-to-date. Concerns over the Federal Reserve’s tapering plans catalyzed the market selloff.Therefore, it appears that traders looked at AVAX as their short-term hedge against the crypto market drop, largely driven by a string of positive news. AVAX/BTC weekly price chart. Source: TradingViewMoreover, the AVAX/BTC pair was up nearly 40% week-to-date at around 0.00245 BTC at the time of writing, with the pair’s relative strength index (RSI) entering overbought territory. That could prompt AVAX to weaken against BTC in the coming sessions.Related: ‘Monster bull move’ means whales could secure the next Bitcoin price surgeA similar outcome may be possible in AVAX/USD’s case as its weekly RSI treads near overbought levels.AVAX/USD weekly price chart. Source: TradingViewHowever, the pair is likely to retain its bullish bias as long as it holds above its 20-week exponential moving average (20-week EMA) as support. As shown in the chart above, the green wave has been capping AVAX’s downside attempts since August 2020.The views and opinions expressed here are solely those of the author and do not necessarily reflect the views of Cointelegraph.com. Every investment and trading move involves risk, you should conduct your own research when making a decision.

Čítaj viac

YFI price gains 46% in just four days after Yearn Finance's $7.5M buyback

Yearn Finance (YFI) emerged as one of the best performers in the crypto market this week, rallying by over 46% in just four days to reach a two-week high above $29,100.YFI/USD daily price chart featuring its four-day bull run. Source: TradingViewThe gains surfaced primarily as Yearn Finance revealed that it has been buying back YFI en masse since November in response to a community vote to improve the YFI token’s economics. The decentralized asset management platform purchased 282.40 YFI at an average price of $26,651 per token — a total of over $7.50 million.Furthermore, Yearn Finance noted that it has more than $45 million saved in its Treasury and has “stronger than ever” earnings. As a result, it would — in the future — could deploy its income to buy back more YFI tokens.Now that the Treasury has more than $45 million saved up and with earnings stronger than ever, expect much more aggressive buybacks. What will you do anon?2/— yearn.finance (@iearnfinance) December 16, 2021Adam Cochran, partner with activist venture fund Cinneamhain Ventures, noted that Yearn Finance makes about $100 million per year in just fees collected from Vaults, its flagship smart savings account service that maximizes the value accrual of deposited digital assets.The analyst further highlighted that Yearn had attracted more than $5 billion in total value locked (TVL) against a market capitalization of $781 million. That being said, the Yearn Finance protocol earns one of the highest fees per TVL, giving it enough liquidity to sustain its token buyback strategy in the future.The total value locked inside Yearn Finance vaults. Source: DeFi LlamaYFI undervaluedCochran further compared Yearn Finance’s profit-to-sales (P/S) and profit-to-earnings (P/E) ratios with another “payout-based” protocol Curve, highlighting that YFI remained undervalued compared to Curve’s staking token, CRV.In detail, the P/S ratio indicates that how much investors are willing to pay for a company’s stock based on its sales per share. The P/E ratio shows investors’ decision to buy a stock based on the company’s past or future earnings. In both cases, a lower reading indicates an undervalued stock.”Their P/S ratio is 3.6x and their P/E is 7.9x,” wrote Cochran about Yearn Finance, adding: “Those numbers for other payout-based protocols like Curve are 71.9x and 143x, respectively. So around times the multiple valuations for someone who has fees on.”7/8Outside of holding $ETH, $YFI is actually my top pick for all of 2022.I’m stupidly long on Yearn both in terms of my capital but also investing my time as I expect to spend a lot of time building here.— Adam Cochran (@adamscochran) December 16, 2021

YFI to $40K next?While Yearn Finance’s decision to buy back over $7.50 million worth of YFI helped boost its prices, the cryptocurrency also received an additional upside boost from a historical accumulation range.The area between $18,500 and $20,000 has been attracting buyers on each YFI price dip since November 2020. It also held up against bears in September 2020, leading to a price rebound toward $40,000.YFI/USD three-day price chart featuring Fakeout range. Source: TradingViewIf YFI holds the $18,500-$20,000 range as support, and further rises above $24,580, or the 0.786 Fib line of the Fibonacci retracement graph in the chart above, its next upside target will be $40,000, a level coinciding with the 0.618 Fib line.Related: As Yearn.Finance’s yield vaults grow, ‘crop’ projects define boundariesPopular crypto trader Cuban noted that YFI’s fully-diluted valuation (FDV) is under $1 billion, which is “criminal considering the potential and the team behind.” He added:”Macro crypto wise, I believe we have a big Q1 coming up fundamentally and a lot of people gonna be left on the sidelines after de-risking EOY.”The views and opinions expressed here are solely those of the author and do not necessarily reflect the views of Cointelegraph.com. Every investment and trading move involves risk, you should conduct your own research when making a decision.

Čítaj viac

Fish food? Data shows retail investors are buying Bitcoin, whales are selling

Bitcoin (BTC) staged an impressive recovery after dropping to its three-month low of $42,333 on Dec. 4, rising to as high as $51,000 since. The BTC price retracement primarily surfaced due to increased buying activity among addresses that hold less than 1 BTC. In contrast, the Bitcoin wallets with balances between 1,000 BTC  and 10,000 BTC did little in supporting the upside move, data collected by Ecoinometrics showed.”Bitcoin is still stuck in a situation where small addresses are willing to stack sats [the smallest unit account of Bitcoin], while the whale addresses aren’t really accumulating,” the crypto-focused newsletter noted after assessing the change in Bitcoin amounts across small and rich wallet groups, as shown in the graph below.Bitcoin on-chain data featuring fish and whale BTC wallet clusters. Source: Ecoinometrics Ecoinometrics further asserted that the situation for Bitcoin is “not ideal,” suggesting that the BTC price may end up resuming its decline in the absence of influential buyers.Bitcoin’s downside target sits near $42KEcoinometrics’ bearish outlook appeared as Bitcoin grappled with the Federal Reserve’s policy decision on Wednesday to reduce its bond purchases by $30 billion every month to unwind them down by April next year entirely.The $120 billion a month stimulus program was instrumental in sending the BTC price from below $4,000 in March 2020 to $69,000 in Nov 2021. And now that the liquidity threatens to go away, with lending to become costlier as the Fed prepares for three rate hikes next year, many fear that it would hurt investors’ appetite for risk assets like Bitcoin.Bitcoin price briefly popped above $49,000 after the Fed FOMC meeting confirmed at least three interest rate hikes and some adjustments to the current market supporting practices in 2022. https://t.co/TpTX7tGmYL pic.twitter.com/lXw47icZmB— Cointelegraph Markets (@CointelegraphMT) December 15, 2021Mike Novogratz, chief executive officer of Galaxy Digital Holdings, admitted that Bitcoin might feel “pain ahead” but anticipated that its price would not fall anywhere beyond the $42,000-support.“$42,000 is at a pretty important level, and low 40s should hold,” the crypto billionaire told Bloomberg TV in an interview Tuesday, adding:”So much money is pouring into the space, it would make no sense that the crypto prices would go much below that. If you’re long, it feels painful, but it’s probably healthy.”BTC/USD daily price chart showing $40K-42K support. Source: TradingViewBitcoin accumulation stronger among retailIn reality, unique wallets holding more than or equal to 1,000 BTC have been declining all across 2021, with data from Glassnode showing its number dropping to 2,147 from 2,475 since Feb. 9.The total number of Bitcoin addresses with at least 1,000 BTC balance. Source: GlassnodeIn contrast, the number of unique wallets holding at least 0.01 BTC (around $485 at current exchange rates) rose in 2021, from 8.46 million to 9.39 million year-to-date. Meanwhile, addresses holding at least 0.1 BTC (~$4,855) surged from 3.12 million to 3.30 million in the same period, indicating that “fishes” played a key role in pumping the Bitcoin price from around $30,000 to as high as $69,000 this year.The total number of Bitcoin addresses with at least 0.01 BTC and 0.1 BTC balance. Source: GlassnodeOne more piece of evidence showing that retail investors have been bullish on Bitcoin, came from addresses that hold at least 1 BTC. Related: Analysts expect Bitcoin trend change after Fed lays out its 2022 roadmapThese wallets decreased in quantity in the first half of 2021 as the BTC market grappled with the China ban and other negative news, but started increasing the second half as El Salvador adopted Bitcoin as its legal tender.The total number of Bitcoin addresses with at least 1 BTC balance. Source: GlassnodeThe number of Bitcoin wallets with at least 1 BTC also kept rising during the BTC price correction from $69,000 to $42,333 in the November-December session, signaling accumulation. It reached a seven-month high on Wednesday just as Bitcoin underwent a rebound to $50,000 from its weekly low near $46,000.On-chain analyst Willy Woo also spotted retail accumulation rising to levels seen after the March 2020 crash, which led to Bitcoin’s two-year-long bull run.Accumulation among wallets holding less than 1 BTC. Source: WIlly WooAdditionally, Bitcoin’s momentum indicator that preceeded its price breakout to $69,000 earlier this year is also hinting at a potential BTC price breakout ahead.The views and opinions expressed here are solely those of the author and do not necessarily reflect the views of Cointelegraph.com. Every investment and trading move involves risk, you should conduct your own research when making a decision.

Čítaj viac

Získaj BONUS 8 € v Bitcoinoch

nakup bitcoin z karty

Registrácia Binance

Burza Binance

Aktuálne kurzy