Autor Cointelegraph By Yashu Gola

What BTC price slump? Bitcoin outperforms stocks and gold for 3rd year in a row

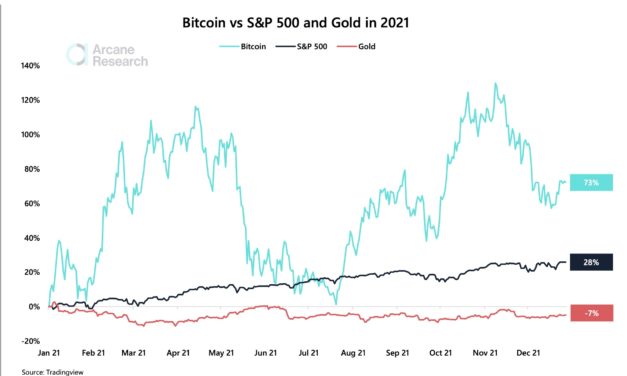
Bitcoin (BTC) may be down over 30% from its record high of $69,000, but it has emerged as one of the best-performing financial assets in 2021. BTC has bested the United States benchmark index the S&P 500 and gold.Arcane Research noted in its new report that Bitcoin’s year-to-date performance came out to be nearly 73%. In comparison, the S&P 500 index surged 28%, and gold dropped by 7% in the same period, which marks the third consecutive year that Bitcoin has outperformed the two.Bitcoin vs. S&P 500 vs. gold in 2021. Source: Arcane Research, TradingViewAt the core of Bitcoin’s extremely bullish performance was higher inflation. The U.S. consumer price index (CPI) logged its largest 12-month increase in four decades this November.“Most economists didn’t see the high inflation coming, as witnessed by the 1-year ahead consumer inflation expectations,” the Arcane report read, adding:“With its 73% gain in the highly inflationary 2021, Bitcoin has proven itself to be an excellent inflation hedge.”Inflation 2021: Actual CPI vs. Expected CPI. Source: BLS, New York FedBitcoin holdings grew among institutional investment vehiclesLoose monetary policies and a sustained fear of higher inflation also prompted mainstream financial houses to launch crypto-enabled investment vehicles for their rich clients in 2021.Arcane reported an inflow of 140,000 BTC (~$6.56 billion) across spot- and future-based Bitcoin exchange-traded funds (ETF) and physically backed exchange-traded products this year.Bitcoin exchange-traded fund holdings. Source: ByteTree, Arcane ResearchThat prompted more Bitcoin units to get absorbed into investment vehicles, underscoring a greater institutional demand for the cryptocurrency.In contrast, gold-backed ETFs witnessed an outflow of $8.8 billion in 2021, according to the World Gold Council’s report published this December.Global gold-backed ETF flows. Source: World Gold CouncilVolatility behind superior performance?Nonetheless, Bitcoin’s relatively superior performance in 2021 has included periods of high volatility. Many analysts believe that extreme price fluctuations keep Bitcoin from becoming an ideal inflation hedge. That includes Leonard Kostovetsky, a finance professor at Boston College, who recalled in his blog post that there have been 13 days in 2021 when BTC’s price has moved over 10% in one direction. He wrote:“It seems strange to think that a person who is worried about holding dollars because they lost 7% of their value over the last year would be comfortable holding Bitcoin which could (and often does) lose that much value in a single day.”Arcane, too, recognized Bitcoin for having been more volatile than the S&P 500 in 2021, noting that the cryptocurrency “behaved like a risk-on asset” by merely amplifying the most significant stock market movements.The researcher cited VIX, a measure of the expectation of volatility based on S&P 500 index options, to exemplify the relationship between Bitcoin and stock markets. It noted that BTC’s price fell hard whenever VIX readings spiked in recent times, underscoring that institutional traders viewed Bitcoin as a risk-on asset.Bitcoin vs. VIX. Source: Arcane Research, TradingViewAs a result, Bitcoin’s potential to fall harder in the wake of a stock market correction also became higher. Arcane also noted that a bearish 2022 for the S&P 500 may end up wiping a big portion of Bitcoin’s gains.“Therefore, be aware of stock market headwinds in the next year and their possible implications for bitcoin’s short-term price trajectory,” it added.Related: Arcane Research releases its crypto predictions for 2022But Aristides Capital managing member Chris Brown went far in predicting an all-and-all Bitcoin doom in 2022. He stated that cryptocurrencies could face massive selloffs ahead as the U.S. Federal Reserve ends its $120-billion-a-month asset-purchasing program followed by three rate hikes next year.BTC/USD weekly price chart vs. Federal Reserve balance sheet. Source: TradingView “If the Fed really does hike rates enough to make money considerably less loose, or if markets believe they will, you are going to see certain areas of speculation come to a screeching halt,” Brown said, adding:“The prime example of such asset speculation is cryptocurrency; here lies $2.64 trillion of ‘wealth’ that is backed by nothing and generates no cash flows.”The views and opinions expressed here are solely those of the author and do not necessarily reflect the views of Cointelegraph.com. Every investment and trading move involves risk, you should conduct your own research when making a decision.

Čítaj viac

Ethereum whales dumping ETH as price slides below $4K, data shows

Ethereum is having difficulty keeping its richest investors in line as its native token, Ether (ETH), hints at logging more losses in the near term.Blockchain data analytics service Glassnode revealed that the number of Ethereum addresses holding at least 1,000 ETH dropped to 6,292 this Monday, the lowest reading since April 2017. At its year-to-date peak, the numbers were 7,239 in January.Number of Ethereum addresses with balance of at least 1,000 ETH. Source: GlassnodeOn-chain analysts typically observe ETH distributions among addresses to realize retail and institutional sentiments. They consider wallets that hold above 1,000 ETH (around $3.92 million at currency exchange rates) as “whales,” primarily for their ability to influence interim market trends via large sell and/or buy orders.But as the numbers of these so-called whales drop, it reflects an ongoing selling trend among the richest Ethereum wallet owners. For instance, the number of Ethereum addresses that hold at least 10,000 ETH (or around $39.20 million) has also plunged, from 1,208 in June to 1,156 at the time of this writing, marking an almost 4.5% decline.Number of Ethereum addresses with a balance of at least 10,000 ETH. Source: GlassnodeBut, on a year-to-date timeframe, the numbers have gone up from 1,065 to 1,156, just as the cost to purchase 1 ETH, in the same period, has jumped nearly 450%. Small investors are accumulatingUnlike whales, wallets that hold ETH in small quantities have been at the forefront of Ether’s 2021 price rally.For example, Glassnode’s data shows that the number of Ethereum addresses with a non-zero ETH balance reached an all-time high of over 71.23 million on Monday. That included wallets with at least 0.01 ETH (~$40), whose numbers shot up to 20.31 million versus 10.66 million at the beginning of this year.Meanwhile, addresses that hold at least 0.1 ETH (~$400) jumped to 6.44 million this Monday compared to 3.62 million on Jan. 1, 2021. That is almost a twofold rise, signaling a higher retail interest in the world’s second-largest cryptocurrency.Number of Ethereum addresses with a balance of at least 0.1 ETH. Source: GlassnodeETH eyes bullish reversalThe latest decline in Ether whales appeared as Ether struggled to close decisively above $4,000, its psychological resistance level. On Tuesday, ETH/USD dropped by over 3.27% to an intraday low of $3,880. Its drop came as a part of a wider correction that started after Ether tested a downward sloping trendline as resistance on Dec. 23. The chart below shows that the trendline is a part of a descending channel that appears like a “falling wedge.”ETH/USD daily price chart featuring falling wedge. Source: TradingViewIn detail, falling wedges are technically bullish reversal patterns that appear after the price trends lower inside a trading range featuring two converging trendlines. The instrument eventually breaks above the structure’s upper trendline ahead or after reaching the apex (where two trendlines converge).The profit target in a rising wedge scenario is generally obtained after adding the maximum distance between the structure’s upper and lower trendline to the breakout point. That puts ETH’s price en route to the $4,200–5,000 range, depending on its breakout level.ETH/USD daily price chart featuring falling wedge targets. Source: TradingViewNevertheless, Ether’s price still has enough room to decline, toward $3,200 in the worst-case scenario. The level is where wedge’s trendlines converge.Related: 3 reasons why Ethereum price can drop below $3K by the end of 2021Meanwhile, independent market analyst Pentoshi said that nothing concrete can be predicted for Ether now as it remains stuck between a “bear contested” and a “bull contested” area, as shown in the chart below.ETH/USD three-day price chart. Source: TradingView, Pentoshi“Maybe it’s the bottom. Don’t care,” tweeted Pentoshi on Tuesday. “I don’t like when them market gives this many times to buy an area with important historical context like this Would rather pay for confirmation.”The views and opinions expressed here are solely those of the author and do not necessarily reflect the views of Cointelegraph.com. Every investment and trading move involves risk, you should conduct your own research when making a decision.

Čítaj viac

Bitcoin rises above $51K as the dollar flexes muscles against the euro

Bitcoin (BTC) regained its bullish strength after reclaiming $50,000 last week and continued to hold the psychological level as support on Dec. 27. Meanwhile, its rival for the top safe-haven spot, the U.S. dollar, also bounced off a critical price floor, hinting that it would continue rallying through into 2022.Triangle breakoutThe U.S. dollar index (DXY), which measures the greenback’s strength against a basket of top foreign currencies, has been trending towards the apex of a “symmetrical triangle” pattern on its daily chart. In doing so, the index has been treating the structure’s lower trendline as its solid support level, thus hinting that its next breakout would resolve to the upside.DXY daily price chart featuring symmetrical triangle setup. Source: TradingViewShould a symmetrical triangle breakout occur, the technical profit target for bulls will be as high as the maximum distance between the structure’s upper and lower trendlines when measured from the breakout point. That puts the dollar en route to roughly 97.80 in the coming session.Weaker euro behind dollar’s strengthThe bullish outlook for the greenback appears against the prospects of the Federal Reserve’s tapering plans. Notably, the U.S. central bank signaled earlier in December its willingness to tighten its ongoing monetary policy faster than expected, adding it would follow up with three rate hikes in 2022.Meanwhile, the recent strength in the dollar index, in part, came due to an ongoing cash glut in the eurozone. A wave of stimulus programs initiated by the European Central Bank (ECB) in the wake of the COVID-19 pandemic left eurozone banks with excessive cash, financial researcher FactSet noted.EUR/USD daily price chart featuring its downtrend since May 2021. Source: TradingViewAs a result, these banks have been now exchanging their extra euros for dollars via the Fed’s reverse repo facility, which offers them 0.05% interest for parking cash, which is better than the short-dated European government debt that comes with negative yields. On Dec. 20, nearly $1.7 trillion flowed into the Fed’s repo facility, the highest one-day cash injection to date.Daily inflows into the Fed’s reverse repo facility rising since May 2021. Source: Federal Reserve Bank of New York Bitcoin’s summer fractal anticipates bull runBitcoin’s latest rise above $51,000 comes as its price tests a multi-month upward sloping trendline as support, as shown in the chart below.BTC/USD daily price chart featuring ascending trendline support. Source: TradingViewNonetheless, BTC price now faces resistance in its 50-day exponential moving average (50-day EMA). The same velvet wave was instrumental in capping Bitcoin’s rebound attempts in November. So the chances of bulls reeling under its pressure are high.But on larger timeframes, there appear possibilities that Bitcoin would continue its bull run further into 2022. For instance, an independent market analyst, Rekt Capital, highlighted the cryptocurrency repeating a trend from its May–July session that later sent its prices to an all-time high of $69,000.”Bitcoin continues to consolidate inside a range formed by two Bull Market EMAs: the green 21-week EMA resistance and the blue 50-week EMA support,” the pseudonymous analyst explained, adding:”Bitcoin formed a similar range inside these two EMAs earlier this year in May (orange circle).”BTC/USD weekly price chart featuring “bull market EMAs” fractal. Source: TradingViewOn the flip side, should Bitcoin break below its 50-week EMA, its likelihood of testing its orange 200-week EMA will become higher based on a similar fractal.BTC/USD weekly price chart featuring 200-week EMA support. Source: TradingViewCurrently, the 200-week EMA sits around $24,250.The views and opinions expressed here are solely those of the author and do not necessarily reflect the views of Cointelegraph.com. Every investment and trading move involves risk, you should conduct your own research when making a decision.

Čítaj viac

Bitcoin 'death cross' that pushed BTC price to $28.8K reappears

A technical sell signal is about to appear on the Bitcoin (BTC) daily chart.On Dec. 18, the BTC price will experience a death cross, a market indicator that occurs when a short-term moving average slips below a long-term moving average. In this case, Bitcoin’s 20-day exponential moving average (20-day EMA) will close below its 200-day exponential moving average (200-day EMA).The indicator may end up alerting traders and investors about a potential selloff in the coming sessions, given its history of predicting bear trends in advance. For instance, the 20-200 bearish crossover that appeared on May 30, 2021, was instrumental in crashing the BTC price from $36,500 to $28,800 in the next 24 days.BTC/USD daily price chart featuring May 2021 death cross. Source: TradingViewA similar death across also surfaced during March 2020’s pandemic-led market crash, exactly a day before the Bitcoin price dropped from nearly $8,000 to below $4,000.BTC/USD daily price chart featuring March 2020 death cross. Source: TradingViewBitcoin risks correction to $40K-42K rangeBitcoin has been correcting consecutively across the last four weeks and looks poised to close the ongoing weekly session in losses, as well, primarily with the Federal Reserve taking more aggressive action on inflation.In the last 30 days, the BTC price has fallen by nearly 17.50%, including a correction from its record high of $69,000 on Nov. 10. In doing so, the cryptocurrency briefly fell to $42,333, only to rebound sharply later, paring some losses, as shown in the chart below.BTC/USD daily price chart. Source: TradingViewNonetheless, the rebound did not turn into a bullish reversal — the Bitcoin price has been trending lower after finding an interim resistance near $50,000, a psychological level.Bitcoin’s efforts to retest $50,000 for a bullish breakout face opposition from its descending channel’s resistance trendline, combined with additional downside pressure from its 20-day EMA and 200-day EMA waves, which are also sitting near $50,000.Related: Bitcoin bears lack ‘balls’ to continue selling into 2022 — analystAs a result, the path of least resistance for Bitcoin appears to the downside. And with the death cross looming, the cryptocurrency would likely continue trending inside the descending channel to test levels around $42,000 for a strong pullback move.If the decline accelerates, the price may eye $40,000 next as its downside target.The RSI factorAnother leg lower would also push Bitcoin’s daily relative strength index (RSI) into its oversold territory below 30, a buying signal. For now, the momentum indicator has been attempting to break above its downward sloping trendline, a move that has earlier predicted Bitcoin’s local price bottoms.BTC/USD daily price chart featuring RSI breakouts. Source: TradingViewOn a shorter timeframe chart, the RSI has been consolidating sideways, anticipating that it would break out of the rectangle range to the upside. At the core of this optimistic outlook is a fractal from September 2021, shared by Mozzi, an independent crypto-market analyst.BTC/USD four-hour chart comparing RSI trends from Sep. 2021 and Dec. 2021. Source: TradingView”Bitcoin is following a similar structure from the end of September,” the analyst noted on Saturday. “Notice the RSI consolidation. Waiting on a clear break of the upper trendline as confirmation.”The views and opinions expressed here are solely those of the author and do not necessarily reflect the views of Cointelegraph.com. Every investment and trading move involves risk, you should conduct your own research when making a decision.

Čítaj viac

Avalanche eyes 60% rally as AVAX price breaks out of bull flag

Avalanche (AVAX) strengthened its case for a potential upside run towards $160 in the coming sessions as it broke out of a classic bullish pattern earlier this week.Dubbed “bull flag,” the pattern emerges when the price consolidates lower/sideways between two parallel trendlines (flag) after undergoing a strong upside move (flagpole). Later, in theory, the price breaks out of the channel range to continue the uptrend and tends to rise by as much as the flagpole’s height.AVAX went through a similar price trajectory across the last 30 days, containing a roughly 100% flagpole rally to nearly $150, followed by over a 50% flag correction to $72, and a breakout move above the flag’s upper trendline (around $85) on Dec. 15.AVAX/USD daily price chart featuring Bull Flag pattern. Source: TradingViewAVAX price continued rallying after breaking out of its bull flag range, reaching almost $120 on Friday but eyeing a further leg up towards its bullish continuation target near $160. The level appeared after adding the height of AVAX’s flagpole, which is around $75, to the current breakout point near $85.A week full of bullish AVAX eventsThe recent buying period in the Avalanche market picked momentum also because of a flurry of positive catalysts this week.AVAX jumped nearly 10.50% on Tuesday as Avalanche added the native version of USDC, a dollar-pegged stablecoin issued by Circle, on its blockchain. Additionally, a report penned by Bank of America analysts published on Dec. 10, called Avalanche a viable alternative to the leading smart contract platform Ethereum. That coincided with AVAX gaining another 16%.AVAX/USD daily price chart featuring key events in the week ending Dec. 19. Source: TradingViewOn Thursday, AVAX rallied to its two-week high after BitGo, a crypto custodian with over $64 billion worth of assets under management, announced that it would support the token. Nonetheless, a modest selloff at the local price top pushed AVAX lower. Th recover Friday as Avalanche announced that it has collaborated with web3 accelerator DeFi Alliance to launch a gaming accelerator program.1/ Avalanche is collaborating with @DeFiAlliance to bring its accelerator programs to the Avalanche communityApply by Jan 7 here: https://t.co/6HcJOLxKxABefore you apply, check these reasons why Avalanche should be your preferred platform: pic.twitter.com/GhdHBhQNgb— Avalanche (@avalancheavax) December 17, 2021All the events mentioned above pointed towards the Avalanche ecosystem’s growth. For instance, with USDC, the project promised to provide a viable alternative to Ethereum’s highly expensive Tether (USDT) stablecoin transactions. Moreover, by gaining BitGo as AVAX’s institutional custodian, Avalanche appears to be prepping for catering to accredited investors. Mike Belshe, CEO of BitGo, explained:“Institutional custody is not the same as retail custody, and BitGo wallets and custody were designed from the ground up to meet the needs of institutional investors, and BitGo is the only independent qualified custodian focused on building the right market structure and facilities to enable institutions to enter the digital asset space with confidence.”AVAX price risksOne of the remaining downside risks around AVAX concerns the crypto market performance, on the whole.In detail, AVAC rallied in a week that witnessed the entire cryptocurrency market capitalization lose more than $114 billion, with leading crypto assets Bitcoin (BTC) and Ether (ETH) plunging over 7% and 5% week-to-date. Concerns over the Federal Reserve’s tapering plans catalyzed the market selloff.Therefore, it appears that traders looked at AVAX as their short-term hedge against the crypto market drop, largely driven by a string of positive news. AVAX/BTC weekly price chart. Source: TradingViewMoreover, the AVAX/BTC pair was up nearly 40% week-to-date at around 0.00245 BTC at the time of writing, with the pair’s relative strength index (RSI) entering overbought territory. That could prompt AVAX to weaken against BTC in the coming sessions.Related: ‘Monster bull move’ means whales could secure the next Bitcoin price surgeA similar outcome may be possible in AVAX/USD’s case as its weekly RSI treads near overbought levels.AVAX/USD weekly price chart. Source: TradingViewHowever, the pair is likely to retain its bullish bias as long as it holds above its 20-week exponential moving average (20-week EMA) as support. As shown in the chart above, the green wave has been capping AVAX’s downside attempts since August 2020.The views and opinions expressed here are solely those of the author and do not necessarily reflect the views of Cointelegraph.com. Every investment and trading move involves risk, you should conduct your own research when making a decision.

Čítaj viac

Získaj BONUS 8 € v Bitcoinoch

nakup bitcoin z karty

Registrácia Binance

Burza Binance

Aktuálne kurzy