Autor Cointelegraph By Yashu Gola

Shiba Inu (SHIB) fetches 30% gain on Robinhood listing rumor and bullish chart pattern

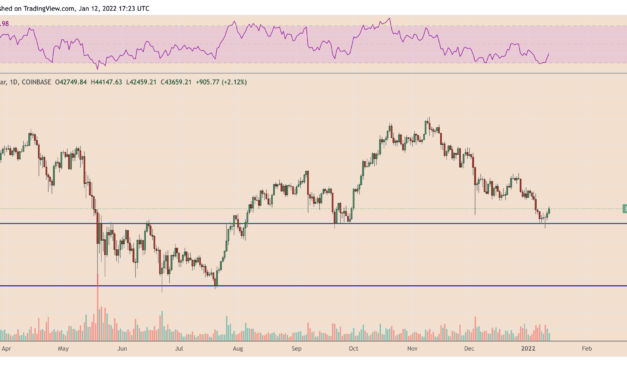
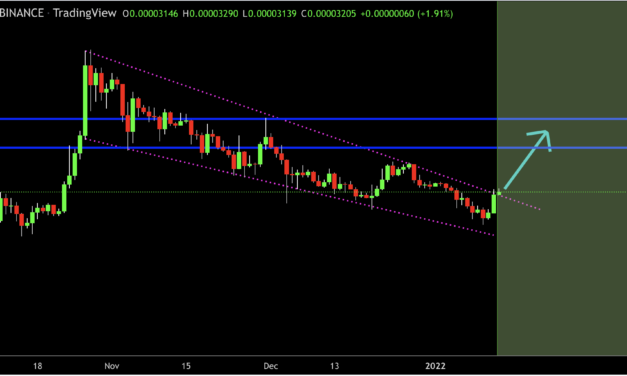
Shiba Inu (SHIB) seems to be preparing for a bullish breakout as a falling wedge pattern begins to form.The price of SHIB has been trending lower inside an area defined by two contracting trendlines while accompanying a decline in trading volume. That shows that investors have been less concerned about the downtrend.  As a result, falling wedges typically provide an ideal springboard for an upside break once the price closes above the structure’s upper trendline. On Thursday, SHIB showed signs of following a similar topside break.SHIB/USDT daily price chart featuring a falling wedge. Source: Fiery Trading Notably, the token briefly closed above the falling wedge’s upper trendline, hitting an intraday high of $0.00003290. The upside move raised anticipation that SHIB would continue its trend higher in the coming sessions, with Fiery Trading analysts noting that an ongoing bullish retracement across the crypto market would further boost the altcoin’s upside bias.The analysts said,”With the entirety of the crypto market seeing strong bullish moves, it’s to be expected that SHIBA will follow. This token is currently trading near the top resistance of the pattern so that a breakout might occur soon. Look for a daily close above the resistance.”The next upside target for SHIBA decisive move above the falling wedge’s upper trendline could have traders eye for a bullish confirmation near $0.00003929. Simply put, if the price of SHIB breaks above $0.00003929, a previous level of resistance, traders may end up placing upside bets toward the level that comes at a distance equal to the maximum gap between the upper and lower trendline ($0.00004240). SHIB/USDT daily price chart featuring a falling wedge setup. Source: TradingViewAs a result, the potential falling wedge breakout could put the price of SHIB en route to $0.00008026, as shown in the chart above. Conversely, a pullback move from the wedge’s upper trendline could have SHIB retest the structure’s lower trendline around $0.00002350 support.Potential Robinhood listing backs the current rallySHIB’s bullish setup emerged primarily after it rebounded by nearly 30% in three days.At the core of SHIB’s sharp retracement were a few fundamental catalysts. These include speculation about the token’s listing on Robinhood, a zero-commission trading app with over $14 million in average daily volume. SHIBA INU ROBINHOOD LISTING SAID TO COME AS EARLY IN FEBthis is about 6 months too late— zerohedge (@zerohedge) January 12, 2022Additionally, SHIB also rallied higher in line with a bounce-back across crypto markets on Wednesday, with top digital asset Bitcoin (BTC) rebounding by more than 12% and Ether (ETH) rising by nearly 18% in the past three days.Related: Five coins that saw huge gains in 2021While it is likely that SHIB’s price boomed due to excessive speculation, Vladimir Kardapoltsev, CEO of blockchain wallet company PointPay, noted that its potential to log more gains in 2022 was huge due to SHIB investors’ recent holding pattern.”It is worth mentioning that in just over five weeks, the average holding duration for Shiba coins on Coinbase Global has climbed from 6 to 32 days,” he told Cointelegraph, adding that “people have been hoarding SHIB because of Shiba Inu’s willingness to become more than just a Dogecoin-like meme token.”Kardapoltsev said,”There are several critical criteria that investors and potential buyers should consider when determining the price of SHIB in 2022. Shibarium, the gaming video game Oshiverse, and ShibaSwap have all contributed to Shiba Inu’s surging pricing, placing it ahead of competitors such as Dogecoin, which is still a meme currency play with minimal development.”The views and opinions expressed here are solely those of the author and do not necessarily reflect the views of Cointelegraph.com. Every investment and trading move involves risk, you should conduct your own research when making a decision.

Čítaj viac

Ascending channel pattern sets Polygon (MATIC) up for a potential 30% rally

Polygon prices look poised to rise by at least 30% in the wake of a key Jan. 18 upgrade that would push a considerable portion of its native MATIC token out of circulation.Dubbed EIP-1559, the improvement proposal originally came to light as part of Ethereum’s so-called London Hard Fork upgrade on Aug. 5. The proposal effectively started destroying, or “burning,” a part of the fees paid to miners via Ether (ETH).Traders and investors raised their bids for Ether before and after the EIP-1559 upgrade, noting that it made Ether a deflationary asset for the first time in history. For example, a model created by Ethereum co-founder Justin Drake claimed that EIP-1559 would reduce Ether’s annual supply by 1.6 million ETH.MATIC looks for new record highsPolygon, which acts as a layer-2 protocol built to scale Ethereum’s prevailing scalability issues, rolled out a testing implementation of EIP-1559 on Dec. 14, 2021. After the test net launch, MATIC price rallied by almost 30% to $2.35, which includes a brief run-up to its record high near $3.MATIC/USD daily price chart. Source: TradingViewIn theory, a lower supply against a rising demand would make the asset more valuable in the eyes of its bidder. This classic economic reference has assisted in boosting demand for cryptocurrencies like Bitcoin (BTC) before. Issuance would be halved every four years against a limited supply cap of 21 million units. This begs the question, could the MATIC price rally in the same way? Mineplex co-founder Alexander Mamasidikov thinks yes.Mamasidikov told Cointelegraph that EIP-1559 would impact MATIC price positively, adding that it could easily rally toward its current record high following the technical upgrade.”In periods of price recovery, investors are often on the lookout for both technical and fundamental features to hang onto in order to back a coin, and Polygon brandishes both,” he said, adding: “While Polygon remains a better version of Ethereum in terms of lower transaction costs, it is also the delight of retail investors with respect to its low price at this time when compared with Ethereum or other smart contract networks.”What do Polygon’s technicals say?MATIC has been trending higher inside an ascending channel pattern since July 2021, confirmed by at least two reactive highs and two reactive lows.The token recently retested the channel’s lower trendline around $1.89 as support, a move that was followed up with a bullish retracement toward $2.50. It now acting as resistance and the $2.50 level also turned out to be near the 1.00 Fib line near $2.44.MATIC/USD daily price chart featuring ascending channel pattern. Source: TradingViewThat being said, MATIC may attempt a break above the $2.44-resistance around the EIP-1559 upgrade on Jan. 18. The move would set itself on a course to test its interim upside target near $3, which is approximately a 30% jump.Related: Polygon network activity spikes as NFT sales reach new heightMeanwhile, if the EIP-1559 factor plays out any longer than anticipated, MATIC price may even attempt an extended run-up toward the 1.618 Fib line around $3.52. Conversely, a rejection at $2.44 could have Polygon retest the ascending channel support for a negative breakout.Such a move would risk invalidating the bullish setup, as discussed above. All of this is in conjunction with exposing MATIC to a correction toward $1.77 or lower.The views and opinions expressed here are solely those of the author and do not necessarily reflect the views of Cointelegraph.com. Every investment and trading move involves risk, you should conduct your own research when making a decision.

Čítaj viac

Fidelity exec says Bitcoin is ‘technically oversold,’ making $40K a ‘pivotal support’

A painful retracement in the Bitcoin (BTC) market earlier this week sent the price below $40,000 for the first time since September 2021. Many analysts predicted the decline to continue toward the $30,000 to $35,000 range, but the price reclaimed $40,000 as support again and on Wednesday BTC made an abrupt move above $44,000. This rekindled hopes that the $40,000 level is perhaps where Bitcoin may bottom out before continuing its move higher in 2022.Jurrien Timmer, the director of global macro at Fidelity Investments, called $40,000 a “pivotal support,” noting that Bitcoin has become “technically oversold” near the level, which may amount to a rebound in the short-term.BTC/USD daily price chart. Source: TradingViewAt the core of Timmer’s bullish outlook were three catalysts: a Stochastic RSI, the so-called S-curve model and a ratio metric of Bitcoin to gold.A clear bounce in Bitcoin’s Stochastic RSIIn detail, the Stochastic RSI is a momentum indicator that compares an asset’s closing price with its high-low range over a specific period. The indicator oscillates between 0 and 100, with the area above 80 signaling “overbought” and the area below 20 alerting on “oversold” conditions. The indicator assists traders in spotting trend reversals by tracking the relationship between its high-low range (%K) and the moving average of the same high-low range (%D). So, the market returns a buy signal if the %K wave crosses the %D wave from below in the oversold territory.Similarly, it returns a sell signal if the %K line crosses %D line from above in the overbought territory.As Timmer notes, Bitcoin’s %K wave has been rising above the %D wave, signaling a buy trend just as the price maintained support above $40,000.BTC/USD price chart featuring its recent pivot at support and Stochastic RSI readings. Source: Fidelity”Bitcoin has reached a line in the sand at $40,000 and is now technically oversold,” tweeted Timmer early Wednesday, adding that “like $30,000 the $40,000 level seems to be a pivotal support area.”Price follows the S-curve modelTimmer further identified a so-called demand curve — as shown via the pin wave in the graph below — that has been instrumental in predicting the end of Bitcoin’s bearish cycles since 2012.Bitcoin supply and demand models. Source: FidelityBetween April and June 2021, the curve followed BTC price action in bouncing back from $30,000, and now, it has been acting as the same support near $40,000 which raising the possibility that the next BTC rebound could reach levels near $100,000.Related: Wall Street still not convinced on Bitcoin $100K this year: JPMorgan survey”The $30,000 level in 2021 provided support based on my demand model (S-curve model),” wrote Timmer, adding: “That same level looks to have moved up to $40,000, providing fundamental support once again. It’s a moving target that generally provides a fundamental anchor for price.”BTC/Gold ratio suggests Bitcoin is oversoldBitcoin also appears oversold, albeit “moderately,” regarding its price-performance against gold. As Timmer noted, the so-called BTC/Gold ratio has slipped to support at 22 after topping out twice at 37.4 in 2021.Bitcoin vs. Gold. Source: FMRCo, Bloomberg, FidelityMeanwhile, the plunge pushed the ratio’s Bollinger Bands into oversold territory, a classic buy signal that indicates that capital could start moving from gold to Bitcoin markets.All in all, these charts tell me that Bitcoin should have both technical and fundamental support at $40k. It doesn’t mean it can’t go lower, but it looks like $40k is the new $30k. /END— Jurrien Timmer (@TimmerFidelity) January 11, 2022The prediction came in line with Bloomberg Intelligence’s recent crypto outlook. Penned by their senior commodity strategist, Mike McGlone, the report identified the capital rotation out of gold and into the Bitcoin market. McGlone also noted that the trend would continue especially against a near four-decade high in inflation which is the result of the U.S. Federal Reserve’s loose monetary policies.”We see gold more likely to advance towards $2,000 an ounce by 2022, but Bitcoin to increase at a greater velocity,” McGlone wrote. The views and opinions expressed here are solely those of the author and do not necessarily reflect the views of Cointelegraph.com. Every investment and trading move involves risk, you should conduct your own research when making a decision.

Čítaj viac

These 3 cryptocurrencies are taking an even bigger hit during Bitcoin's price slump

The cost to purchase one Bitcoin (BTC) has dropped almost 10% in the last seven days and has been eyeing extended declines as it drops below $40,000, its interim psychological support, on Jan. 10.BTC/USD weekly price chart. Source: TradingViewNonetheless, the losses suffered by Bitcoin still appear lesser than some of its top crypto rivals’ performances. For instance, Cardano (ADA), the seventh-largest cryptocurrency by market valuation, has dropped by nearly 11% to around $1.15 in the last seven days.Similarly, XRP, the eighth-largest by market capitalization, has dipped by around 10% to nearly $0.75 in the same period.Meanwhile, some cryptocurrencies listed among the top 50 digital assets have experienced bigger losses between 15% and 30% in the last week. They include Ethereum’s native token Ether (ETH), which has plunged over 16%, and its blockchain rival Terra, whose token LUNA has declined by nearly 20.50%.That said, listed below are three tokens among the top-50 cryptocurrencies that have performed worse than Bitcoin on a seven-day adjusted timeframe.Axie Infinity (-27.50%)Sitting atop more than 12,000% year-over-year profits, Axie Infinity (AXS) turned out to be one of the best places for traders to secure their profits.AXS price plunged nearly 27.5% to around $70 in the last seven days, thus becoming the worst performer among the large-cap coins. Meanwhile, against Bitcoin, the token slipped by almost 17% to 0.0017 BTC in the same period.ASX/USD vs. AXS/BTC daily price chart. Source: TradingViewNevertheless, AXS price may rebound in the coming days as one of the market’s key momentum indicators, the relative strength index (RSI), alerts about the token’s “oversold” status. In detail, the AXS’s daily RSI has slipped below 30, which traditional chartists interpret as a buy signal.More bullish cues for the Axie Infinity token have been coming from its downside target area between $64.50 and $50, as shown in the chart below. Notably, the $64.50-level served as a support to the AXS price during the August-September trading session in 2021.AXS/USD daily price chart featuring its potential downside targets. Source: TradingViewSimilarly, the levels around $50 prompted traders to accumulate AXS en masse on four occasions since Sept. 7 selloff.Conversely, breaking below the downside target range may end up pushing below $40, another support level from August 2021.AAVE (-25%)Unlike Axie Infinity, Aave (AAVE) native token of the same name had been sitting atop dwarfed year-over-year profits — nearly 60% since Jan. 10, 2021. Nonetheless, it has still become one of the worst-performing cryptocurrencies entering 2022.AAVE price dropped by a little over 24% to $200 in the last seven days. Meanwhile, the token’s performance against Bitcoin came out to be nearly -15%, reflecting that traders remained unconvinced about a bullish rebound in the Aave market.AAVE/USD vs. AAVE/BTC daily price chart. Source: TradingViewFor instance, AAVE’s daily RSI has been trending lower since Dec. 27 and now sits near 39. It now eyes an extended correction to reach its oversold levels below 30, meaning there is still room for the AAVE price to go further down than its current rates.The sell signal appears also as AAVE retests its two-month-old ascending trendline support, as shown in the chart below. AAVE has rebounded at least four times from the said rising level since Dec. 4. Therefore, if the coin breaks below it, its likelihood of correcting toward $165, another support level, would be higher.AAVE/USD daily price chart featuring its interim support and resistance targets. Source: TradingViewConversely, a rebound from the ascending trendline support may have AAVE rally toward the $250-275 trading range, which has a recent history of acting as both resistance and support. Since December 2021, the area has been able to cap AAVE’s upside attempts successfullyIOTA (-24%)Based on their seven-day adjusted timeframe performance, IOTA’s losses are marginally lesser than AAVE’s. But given the token has been sitting atop nearly 150% year-over-year profits, it appears like a good sell for traders looking to offset their losses elsewhere during the recent crypto market decline.Notably, IOTA’s price dipped a little over 24% to $1.00 in the past seven days. Against Bitcoin, IOTA is down about 14% in the same period.IOTA/USD vs. IOTA/BTC weekly price chart. Source: TradingViewRelated: Top 5 cryptocurrencies to watch in 2022: BTC, ETH, BNB, AVAX, MATICA bounce is now likely, however, as the token’s daily RSI neared oversold levels, while it dropped to a trading range of $0.93-$1.00, which has a recent history of attracting buyers.IOTA/USD daily price chart featuring its interim support and resistance targets. Source: TradingViewAs a result, if IOTA drops below the $0.93-$1.00 range, its likelihood of extending its price decline towards $0.71 — a support level from the May-June 2021 trading session — looks high. Conversely, a rebound action from the area could have the IOTA price eye $1.21 as its interim bull target.The views and opinions expressed here are solely those of the author and do not necessarily reflect the views of Cointelegraph.com. Every investment and trading move involves risk, you should conduct your own research when making a decision.

Čítaj viac

Bitcoin crash ahead? Expert warns higher inflation could whip BTC price to $30K

Bitcoin (BTC) may end up falling to as low as $30,000 if the U.S. inflation data to be released on Wednesday comes any higher than forecasted, warns Alex Krüger, founder of Aike Capital, a New York-based asset management firm.The market expects the widely-followed consumer price index (CPI) to rise 7.1% for the year through December and 0.4% month-over-month. This surge highlights why the U.S. Federal Reserve officials have been rooting for a faster normalization of their monetary policy than anticipated earlier.U.S. headline inflation. Source: Bureau of Labor Statistics, BloombergFurther supporting their preparation is a normalizing labor market, including a rise in income and falling unemployment claims, according to data released on Jan. 7.”Crypto assets are at the furthest end of the risk curve,” tweeted Krüger on Sunday, adding that since they had benefited from the Fed’s “extraordinarily lax monetary policy,” it should suffice to say that they would suffer as an “unexpectedly tighter” policy shifts money into safer asset classes.Excerpts:”Bitcoin is now a macro asset that trades as a proxy for liquidity conditions. As liquidity diminishes, macro players now in the fray sell bitcoin, and all of the crypto follows.”The first interest rate hike in March 2022?The Fed has been buying $80 billion worth of government bonds and $40 billion worth of mortgage-backed securities every month since March 2020. Meanwhile, the U.S. central bank has kept its benchmark interest rates near zero, thus making lending to individuals and businesses cheaper.BTC/USD vs. Fed balance sheet. Source: TradingViewBut the collateral damage of a loose monetary policy is higher inflation, which reached 6.8% in Nov. 2021, the highest in almost four decades. So now the Fed, which once claimed that rising consumer prices are “transitory,” has switched its stance from expecting no rate hikes in 2022 to discussing three hikes alongside their balance sheet normalization.“It’s more dramatic than what we anticipated and the Fed’s pivot to a more hawkish stance has been the surprise,” Leo Grohowski, the chief investment officer of BNY Mellon Wealth Management, told CNBC, adding:”Most market participants expected higher rates, less accommodative monetary policy, but when you look at the fed funds implying a 90% chance of a hike in March, on New Year’s Eve that was just 63%.”Mini bear market?Mike McGlone, the senior commodity strategist at Bloomberg Intelligence, called $40,000 an important support level in the Bitcoin market. Furthermore, he anticipated that the cryptocurrency would eventually come out of its bearish phase as the world becomes digital and treats BTC as collateral.BTC/USD daily price chart featuring $40K-level’s history as support. Source: TradingViewThe statement arrived as Bitcoin’s drop from its Nov. 8 record high of $69,000 is now over 40%. According to Eric Ervin, chief executive officer at Blockforce Capital, the drop has primarily washed off recent investors, leaving the market with long-term holders.It could be the beginning of a “mini bear market,” the executive told Bloomberg, adding that such corrections are “completely normal” for crypto investors.Related: Bitcoin performs classic bounce at $40.7K as BTC price comes full circle from January 2021Krüger also noted that Bitcoin has already dropped too much from its record highs, insofar that it now stands technically oversold. So, if the CPI reading surprises on the downside, markets could expect the BTC price to pop and trend for a while.”Wednesday will have the US inflation data,” Krüger said, adding:”Think prices should chop around 41k and 44k until then, with an upwards skew given how strong the rejection of the lows has been.”The views and opinions expressed here are solely those of the author and do not necessarily reflect the views of Cointelegraph.com. Every investment and trading move involves risk, you should conduct your own research when making a decision.

Čítaj viac

Získaj BONUS 8 € v Bitcoinoch

nakup bitcoin z karty

Registrácia Binance

Burza Binance

Aktuálne kurzy