Autor Cointelegraph By Yashu Gola

Bottom ahead? Solana paints its first 'death cross' as SOL losses 50% in January

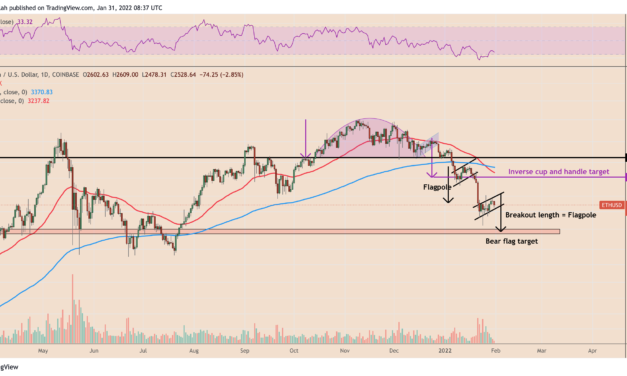
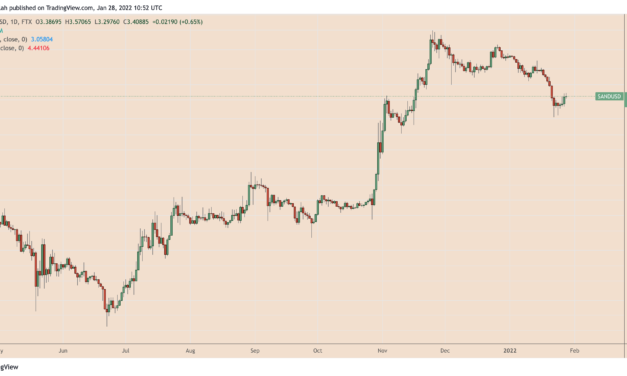
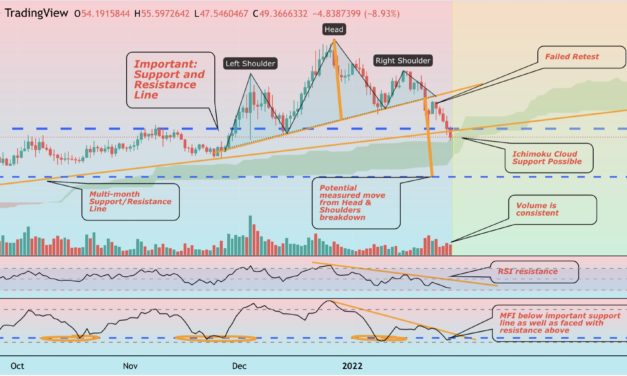
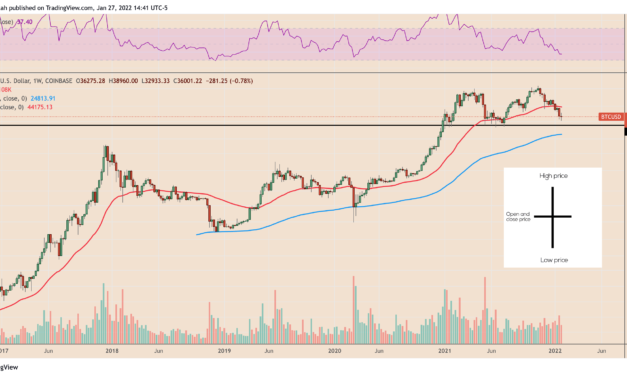
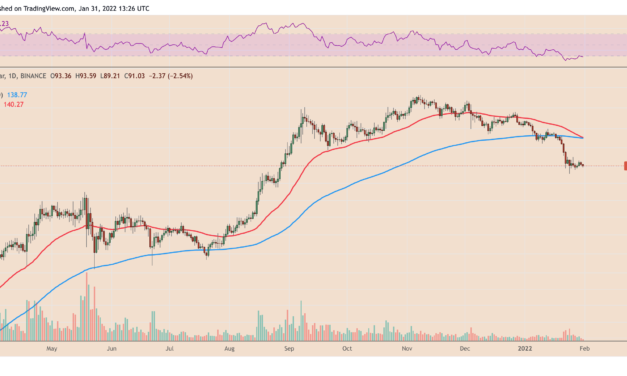
Solana (SOL) looks poised to paint its first “death cross” this week, raising fears that its ongoing selloff would continue further into February.Real selloff threatNotably, the SOL price’s 50-day exponential moving average (50-day EMA; the red wave) will eventually close below its 200-day EMA (the blue wave), signaling a bearish crossover, called death cross, that typically prompts traders to sell.SOL/USD daily price chart featuring its 50-200 EMA death cross. Source: TradingViewThe threat surfaces as SOL looks to close January at nearly a 50% loss — as of the month’s final day, the Solana token was down by over 2.50% to nearly $91, compared to almost $180 at the start. Meanwhile, the catalysts behind SOL’s price crash remain pretty much intact.Crypto-assets have fallen this month as traders have attempted to assess how fast the Federal Reserve would increase its benchmark rates from near-zero levels to tame booming inflation and tighter jobs market. Solana, as a result, has wiped half its market valuation in January from $55.19 billion to $28.79 billion. That is after it closed 2021 at a whopping 11,144% profit. That has got some financial experts to expect a “crypto winter” ahead, a term referring to concerning bearish cycles in the cryptocurrency market, such as the one seen during 2018 wherein digital assets’ combined market cap fell by more than 80%.It’s during crypto winters that the best entrepreneurs build the better companies. This is the time again to focus on solving real problems vs. pumping tokens.— David Marcus – dmarcus.eth (@davidmarcus) January 24, 2022As of now, SOL’s interim bullish outlook hangs over its possibility to hold above $83, its current support level. A break below the said price floor could have the Solana token find its next pullback opportunity not until $65, as shown in the chart below.SOL/USD daily price chart featuring its interim support targets. Source: TradingViewBoth support levels were instrumental in sending the SOL/USD pair to its record high above $260 last year.Philip Gunwhy, partner at Blockasset.co, remained long-term bullish on Solana, citing its exponential growth in the decentralized finance (DeFi) and nonfungible token (NFT) sectors that boost SOL’s demand. However, the analyst noted that its swift rebound in the short term depends on the performance of the broader crypto ecosystem.”For Solana, maintaining solid support at $65-85 area is undoubtedly the primary focus for the week while maintaining a longer-term focus to retest its All-Time High around $260,” Gunwhy said.Rebound scenarioNo previous data shows how SOL traders react to a death cross since it will be Solana’s first 50-200-day EMA bearish crossover to date. But considering that people who trade SOL also have been trading Bitcoin (BTC) over the recent years, one can notice that death crosses bother them very little.For instance, a 50-200-day EMA crossover, witnessed in the Bitcoin market in June 2021, followed a drop towards $29,000. But a month later, the BTC price bounced back strongly, eventually reaching its all-time high of $69,000 in early Nov. 2021.BTC/USD daily price chart featuring recent death crosses. Source: TradingViewSimilarly, over the past decade, death crosses in the S&P 500 (SPX) have lost their significance due to false bearish alarms. For instance, the last two bearish crossovers between the SPX’s 50-day EMA and 200-day EMA — in December 2018 and March 2020 — led to bottom formations, followed by strong price rebounds.S&P 500 daily price chart featuring recent death crosses. Source: TradingViewThat raises the possibility that SOL’s death cross would have its price bottom out in the coming sessions, followed by a bullish reversal. In doing so, the Solana token may eye previous support/resistance levels for a potential rebound move towards its 200-day EMA.SOL/USD daily price chart featuring rebound scenarios. Source: TradingViewMore cues for a bullish rebound also come from the SOL price’s oversold relative strength index (RSI), a classic buy signal.The views and opinions expressed here are solely those of the author and do not necessarily reflect the views of Cointelegraph.com. Every investment and trading move involves risk, you should conduct your own research when making a decision.

Čítaj viac

Ethereum price risks dropping to $2K on 'bear flag' setup

Ethereum’s native token Ether (ETH) will extend its 30% slump this year to the lowest price level since July 2021, if a textbook technical indicator plays out.Ethereum chart paints bearish patternETH’s price fell to its six-month low of $2,159 on Jan. 24, 2022, only to rebound sharply to as high as $2,724 days later. However, this created a so-called “bear flag” chart pattern that suggests the price could drop to $2,000 or a 17% drop from current levels.A bear flag appears on the chart when the price consolidates higher after a strong momentum downwards but eventually moves further lower after breaking out of the upward range. In doing so, the price tends to drop by as much as the length of the previous decline, called “flagpole.”ETH/USD daily price chart featuring bear flag setup. Source: TradingViewIn Ether’s case, the flagpole’s height comes to be over $850. That roughly shifts its bear flag price target towards $2,000. Earlier this year, another bear flag formation had resulted in a similar decline, as shown in the chart above.Rate hikes aheadThe prospect of Ether hitting $2,000 in the coming months increases further due to Bitcoin (BTC) and its vulnerability to macroeconomic trends.Notably, the positive correlation efficiency between the Ethereum token and Bitcoin has been 0.92 in the past 30 days, according to data from CryptoWatch. In other words, Ether tailed the BTC price trends with a 92% accuracy in January 2022.Bitcoin’s correlation with altcoins in the past 30 days. Source: CryptoWatchAt the core of the said bearish outlook is the Federal Reserve’s dovish policy. In detail, the U.S. central bank’s decision to completely withdraw its $120 billion a month Covid-19 stimulus program by early March and to increase benchmark rates from their near-zero levels after that have started hurting the so-called pandemic winners, including tech stocks, gold, and Bitcoin.Paul Krugman, a Nobel prize-winning economist and a long-term skeptic of cryptocurrencies, envisioned a Bitcoin price crash in 2022, noting that it had “disturbing echoes of the subprime crash” during the 2008 economic crisis.”If you ask me, regulators have made the same mistake they made on subprime: They failed to protect the public against financial products nobody understood, and many vulnerable families may end up paying the price,” he warned.$2,000 first for ETH price? As Ether looks bearish under the shadows of Bitcoin, many analysts anticipate the Ethereum token resume its climb later in 2022, owing to its involvement in the emerging decentralized finance (DeFi) and nonfungible token (NFT) sectors. For instance, billionaire investor Mark Cuban noted last year that Ether could surpass Bitcoin in terms of growth.I like Eth/L2s more, and there is no point arguing the Trilemma, halving or inflation. I like it more because I can see an unlimited number of applications that will change the biz/consumer world forever. And to use them you need to buy Eth/L2. BTC doesn’t have that demand pull— Mark Cuban (@mcuban) October 17, 2021Mike McGlone, the senior commodity strategist at Bloomberg Intelligence, predicted Ether to hit $5,000 in 2022 despite Fed’s tapering policies. The veteran analyst called the central bank’s rate hike plans a “win-win scenario” for Bitcoin and Ether against the U.S.’s four-decade high inflation.Related: Ethereum hash rate scores new ATH as PoS migration underwayNonetheless, McGlone anticipated Ether to hit $2,000 first before continuing its move higher. Notably: “A top force to stop central-bank restraint is a decline in the stock market, with implications for cryptos […] Price supports exiting 2021 of about $30,000 for Bitcoin and $2,000 for Ethereum appear solid.”The views and opinions expressed here are solely those of the author and do not necessarily reflect the views of Cointelegraph.com. Every investment and trading move involves risk, you should conduct your own research when making a decision.

Čítaj viac

The Sandbox (SAND) metaverse token gains 40% after Snoop Dogg, Warner Music partnership

Sandbox (SAND) refused to go down despite broader negative market sentiment in the past 24 hours. Instead, the altcoin logged a breakaway recovery as traders assessed its recent high-profile partnerships as a sign that the project has strong fundamentals.SAND rose 10.23% to $3.38 at the UTC close on Jan.27, followed by another 5.42% spike to $3.57 on Friday. In contrast, Bitcoin (BTC), dropped 1.41% within the same timeframe.SAND/USD daily price chart. Source: TradingViewSAND adoption boomsTraders decided to increase their exposure to SAND after the Sandbox announced partnerships with American rapper Snoop Dogg and Warner Music, a major record label.On Jan. 27 Snoop Dogg tweeted a teaser of what appeared to be his upcoming nonfungible token (NFT) collection, dubbed “the Snoop Avatars.” The rapper further hinted that his avatars would come as a part of the Sandbox metaverse.Somethin big comin soon. ⬇️ Keep up 2 date @TheSnoopAvatars @TheSandboxGame https://t.co/GkqdAJE10L— Snoop Dogg (@SnoopDogg) January 26, 2022Later, that day, the Sandbox announced that it would create a music theme park and concert venue within its metaverse with the help of Warner Music. In doing so, the gaming project noted that the Warner Music artists would virtually engage with their fans and generate real revenues streams.“We’re shaping The Sandbox as a fun entertainment destination where creators, fans, and players can enjoy first-of-a-kind immersive experiences and be more closely connected to their favorite musical artists through NFTs,” Sebastien Borget, chief operations officer and co-founder of The Sandbox, told Cointelegraph.Naturally, the high-profile partnerships boosted the prospects for SAND to find more takers in the future. That is primarily because of the token’s role as a primary asset inside the Sandbox metaverse — a medium of exchange, governance and staking. As a result, it fared better than most of its top-ranking crypto rivals on Thursday.What’s next for SAND?The latest bout of buying appeared in line with a choppy recovery in the broader cryptocurrency sector that started on Jan. 24.Between its nadir of Jan. 22 and Friday’s top, the crypto market added over $150 billion to its net valuation. SAND, which recovered alongside other assets, bottomed out at $2.56 then went on to rally over 40% in just four days.SAND/USD daily price chart. Source: TradingViewFollowing the bounce, SAND price confirmed its 200-day exponential moving average (200-day EMA; the blue wave in the chart above) as its interim support. If the euphoria surrounding the Snoop Dogg and Warner Music partnerships sustain, Sand will likely extend its upside momentum toward the 50-day EMA (the red wave) near $4.50.Meanwhile, independent market analyst Cantering Clark doubted the upside setup, reminding that SAND’s pump could have posed a “helpful exit for holders” before a potential bearish continuation ahead.The views and opinions expressed here are solely those of the author and do not necessarily reflect the views of Cointelegraph.com. Every investment and trading move involves risk, you should conduct your own research when making a decision.

Čítaj viac

Terra (LUNA) at risk of 50% drop if bearish head-and-shoulders pattern plays out

Terra (LUNA) may fall to nearly $25 per token in the coming weeks as a head-and-shoulders (H&S) setup develops, indicating a 50% price drop, according to technical analysis shared by CRYPTOPIKK.H&S patterns appear when the price forms three peaks in a row, with the middle peak (called the “head”) higher than the other two (left and right shoulders). All three peaks come to a top at a common price floor called the “neckline.”Traders typically look to open a short position when the price breaks below the H&S neckline. However, some employ a “two-day” rule where they wait for the second breakout confirmation when the price retests the neckline from the downside as resistance, before entering a short position.Meanwhile, the ideal short target for traders comes out to be at length equal to the maximum distance between the head and the neckline. In LUNA’s case, the price has now been heading toward the same H&S short target, currently near $25, as shown in the chart below.LUNA/USD daily price chart. Source: TradingViewMeanwhile, the volume recorded during the H&S breakout appears consistent, underscoring that the ongoing downtrend has enough bearish sentiment. This raises risks of further declines in the Terra market.LUNA’s daily momentum indicators, primarily the relative strength index (RSI) and the money flow index (MFI), have both entered their respective oversold regions, which some might consider to be a buy signal. CRYPTOPIKK recognized that they could prompt the LUNA price to rebound but said “the trend still seems [to be] heading down.”Where’s the bottom?The bearish outlook appears as LUNA trades under the pressure of strong macroeconomic catalysts, mainly the U.S. Federal Reserve’s decision to unwind its $120 billion a month asset purchasing program entirely by March, followed by the first interest rate hike from its current near-zero levels.Tightening monetary policies had started hurting assets that had been bullish when these policies were loose. That includes some sections of the U.S. stock market and Bitcoin (BTC). So, LUNA seems to have been tailing Bitcoin’s losses against the ongoing market uncertainty, especially as it sits atop a year-over-year profit of 3,200% versus BTC’s 11.50% gains.Related: Defying the bear market, this automated strategy is up 15% so far in 2022LUNA/USD weekly price chart. Source: TradingViewIn its short history as a financial asset, LUNA’s downtrends have typically come to exhaustion as it tests its 50-week simple moving average (50-week SMA; the blue wave in the chart below) as support. That price floor was near $30 at the press time.LUNA/USD daily price chart. Source: TradingViewMeanwhile, on the daily timeframe chart, LUNA has been testing its 200-day exponential moving average (200-day EMA) for a potential rebound. Should it happen, LUNA’s next upside target appears to be near $75, as shown in the chart above.Conversely, a decisive move below the 200-day EMA wave may trigger the H&S setup toward $25.The views and opinions expressed here are solely those of the author and do not necessarily reflect the views of Cointelegraph.com. Every investment and trading move involves risk, you should conduct your own research when making a decision.

Čítaj viac

Bitcoin 'Doji' points to bullish reversal scenario as BTC holds $36K support

It is not too late for Bitcoin (BTC) to reclaim its bullish bias as it halfway paints an indecisive ‘Doji’ candle on the weekly chart.In detail, Bitcoin’s price correction this week to below $33,000 had it form a lower wick, suggesting that bulls bought the dip. A sharp retracement ensued and took BTC price to as high as $38,960 on Jan. 27. However, the bulls failed to hold the said week-to-date top for too long, resulting in another wick, but also pointing to the upside.BTC/USD weekly price chart featuring Doji candlestick. Source: TradingViewBTC price has since corrected to near its weekly opening rate of $36,200. In doing so, it has formed a transitional candlestick, called “Doji,” that reflects indecision between bears and bulls. If found at the bottom of trends, Doji candlesticks could signal the reversal of price direction.The $30K support sticksBitcoin has been trending lower since it established its record high at $69,000 in Nov. 2021. In doing so, the cryptocurrency wiped more than 50% of its profits, even dropping below its 50-week exponential moving average (50-day EMA; the red wave), a support key support level.But Bitcoin’s strongest interim support comes in at $30,000, a level that has been capping the cryptocurrency’s downside attempts since Jan. 2021. Notably, in May-July 2021, the level was instrumental in attracting accumulators that helped the BTC price climb to its record high.”If the support around $30K holds, it’s possible we will see a strong upward trend resuming,” noted Crypto Batman, a pseudonymous market analyst.BTC/USD weekly price chart. Source: TradingViewAdditionally, a Doji formation ahead of the BTC price hitting $30,000-support shows a weaker bearish sentiment near the level.Bearish outlookOn the flip side, Bitcoin’s bullish outlook may fizzle out if its price drops decisively below $30,000.In detail, Bitcoin’s weekly relative strength index is currently near 38, and still heading toward its oversold territory below ’30.’ It shows that the BTC price still has room to continue its decline in the coming sessions, at least until it tests $30,000.BTC/USD weekly price chart. Source: TradingViewMeanwhile, a close below $30,000 puts Bitcoin at the risk of falling towards its 200-week exponential moving average (200-week EMA; the blue wave in the chart above) near $25,000. That is primarily due to the wave’s history of ending bearish cycles in 2018 and 2019, which followed by sharp retracements to new record highs.Fundamentals support a downside scenarioThis week, Bitcoin wobbled between extreme highs and lows due to the suspense around the Federal Reserve’s rate hike plans for 2022 to combat inflation. On Wednesday, the cryptocurrency’s gains fizzled out after the U.S. central bank confirmed that it would raise interest rates in mid-March.Jerome Powell’s press conference after the statement further revealed the Fed’s likelihood to increase rates after every policy meeting for the rest of the year. The Fed chairman admitted that the inflation outlook had worsened since their policy meeting in December, underscoring that the ongoing supply chain issues may not get resolved by the end of 2022.Reading the Powell transcript now. I think this was a good question from @colbyLsmith and a helpful answer from Powell in terms of understanding the FOMC’s thinking. pic.twitter.com/KDizwQf4Jr— Joe Weisenthal (@TheStalwart) January 26, 2022Bitcoin see-sawed in the hours leading up to the Fed’s statement and during Powell’s conference Wednesday afternoon. It briefly jumped to almost $39,000 after the central bank released its policy decision but started falling after Powell started speaking to journalists later in the afternoon.Independent market analyst CryotoBirb played down the fears surrounding the Fed’s tightening policy, stating that the central bank would not take “a destructive approach towards financial markets.” Related: Is the bottom in? Data shows Bitcoin derivatives entering the ‘capitulation’ zoneThe chartist noted that a Fed-led stock market collapse would look bad on the politicians, which may leave the central bank with the option to only bring “short-term bearish implications” to the risky markets, followed by strong medium-term increases.”It is also worth adding into the larger context that Bitcoin has freshly taken advantage over the equities, and while the stocks tumbled down, Bitcoin took off to the upside,” he added.The views and opinions expressed here are solely those of the author and do not necessarily reflect the views of Cointelegraph.com. Every investment and trading move involves risk, you should conduct your own research when making a decision.

Čítaj viac

Získaj BONUS 8 € v Bitcoinoch

nakup bitcoin z karty

Registrácia Binance

Burza Binance

Aktuálne kurzy