Autor Cointelegraph By Yashu Gola

Solana price 'bear flag' paints $50 target as Wormhole hack exposes security hole

Solana (SOL) became one of the worst performers among the top cryptocurrencies on Feb. 3 as traders assessed its links with the second-biggest hack to date.$325M worth of wETH goneSOL price dropped by 5.50% to below $96.50 as Wormhole, a bridge between Solana and Ethereum blockchains, reportedly lost $325 million worth of Wrapped Ethereum (wETH) due to a technical vulnerability. Prior to the hack on Wednesday, SOL was trading as high as $112.Solana security hole needs fixing asap?Seems their consensus proceeds with only 33% of the nodesHard math proofs show you need 66%+ for safety. No ifs no butsPossibilities: 1) is insecure, 2) is centralized, or 3) they’ve broken Computer Science (unlikely) pic.twitter.com/yqfW3QnfeK— dom.icp ∞ (@dominic_w) February 3, 2022In detail, hackers tricked a series of Solana’s smart contracts into signing illicit transactions digitally posing as “guardians,” reported blockchain researcher Kelvin Fichter Wednesday night after the hack. He wrote:”The attacker made it look like the guardians had signed off on a 120k deposit into Wormhole on Solana, even though they hadn’t. All the attacker needed to do now was to make their “play” money real by withdrawing it back to Ethereum.”And one withdrawal of 80k ETH + 10k ETH later (everything in the bridge on Ethereum), everything was gone.— smartcontracts (@kelvinfichter) February 3, 2022

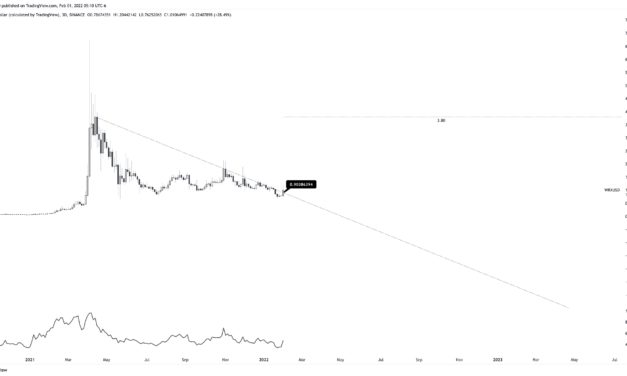
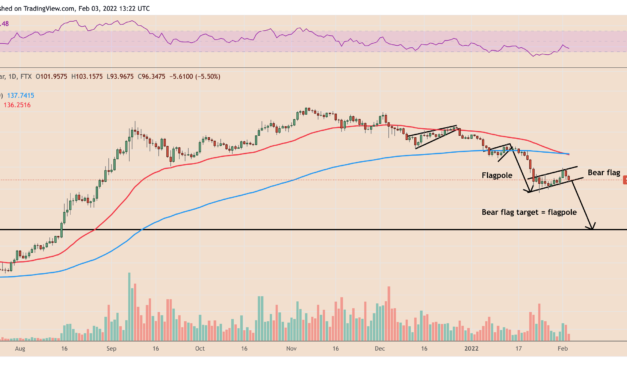
Wormhole said that it would add Ethereum’s native token Ether (ETH) “over the next hours” to back wETH on the Solana network on a 1:1 basis. However, the project did not clarify the source of the funds that would be used to buy ETH tokens.Bear flag triggeredThe selloff in the Solana market across the last 24 hours came closer to triggering a bearish continuation setup that may send the SOL price down by another 50%.Dubbed “bear flag,” the pattern emerges when the price consolidates sideways/higher after a strong downside move, called “flagpole.” In a perfect world, the price eventually breaks below the consolidation range and falls by as much as the flagpole’s length.So far, SOL/USD has been forming the same bear flag pattern, as shown in the chart below.SOL/USD daily price chart featuring bear flag setup. Source: TradingViewThe downside target put forth by Solana’s bear flag sits near $50, almost halfway down where the SOL price has been trading on Thursday.Related: Report crowns Solana for using least energy per transaction, but there’s a catchLast year, Solana sprinted into the top-ten cryptocurrencies by market cap with SOL rising by more than 11,000% as investors bet on the growth of decentralized finance (DeFi) and nonfungible token (NFT) sectors.However, entering 2022, the SOL price has fallen sharply, wiping almost half Solana’s market capitalization amid a broader crypto market decline — that also battered Bitcoin (BTC), Ether, and other top-ranking digital assets.The views and opinions expressed here are solely those of the author and do not necessarily reflect the views of Cointelegraph.com. Every investment and trading move involves risk, you should conduct your own research when making a decision.

Čítaj viac

Canadian Bitcoin ETF sees its third-biggest daily inflow ever

Canada-based Purpose Bitcoin ETF attracted over $38 million worth of Bitcoin (BTC) this Tuesday, its third-largest daily inflow to date.According to data provided by Glassnode, investors poured about 1,054 BTC into the fund, marginally lower than the inflows recorded on Dec. 6, 2021. However, the capital injection still came out to be almost half the amount that entered the Purpose Bitcoin ETF on its debut on Feb. 22, 2021 — over 2,250 BTC.Purpose Bitcoin ETF flows. Source: GlassnodeInvestors buying the dip?Bitcoin exchange-traded funds (ETF) mimic the cryptocurrency’s spot price performance, thus allowing investors to gain exposure in its market without holding the actual BTC directly. In simple terms, ETF backers buy real Bitcoin with the money they attract from an investor, thus becoming a proxy method to measure markets’ interest in the cryptocurrency.Typically, markets believe that strong inflows into funds drive up the underlying assets’ prices by attracting more return-chasing investors. As a result, Bitcoin’s price should move in the same direction as the fund flows — to the upside — in a perfect world.The higher inflows surfaced despite Bitcoin’s recent price correction, wherein BTC’s price traded around $37,000 on Feb. 3, almost three months after hitting a record high of $69,000. BTC/USD daily price chart. Source: TradingViewBut in the same period, the total amount of BTC held in the Purpose Bitcoin ETF reserves has climbed from nearly 24,100 to a little over 31,000. That suggests that Purpose ETF investors have been buying the Bitcoin dip.Means people bought the etf so they had to buy more coins.— tiredfornow (@tiredfornow) February 2, 2022But the story appears different when one takes all the Bitcoin funds into consideration. Cautious accumulation in playAccording to a report published on Jan. 31 by CoinShares, the Bitcoin funds experienced a weekly inflow of $22 million worth of BTC as of Jan. 28. Meanwhile, its collective year-to-date readings showed about $132 million in BTC exiting the market.In doing so, the total assets under management at all the Bitcoin funds dropped to their July 2021 low of $29 billion in January before recovering to over $31 billion.“We are seeing an increasing price sensitivity to monetary policy statements, with the recent FOMC meeting having an immediate intraday price response,” wrote CoinShares, noting that the funds encompassing all the digital assets saw inflows worth $19 million in the week ending Jan. 28. “While small, it continues to suggest investors are beginning to cautiously add to positions at these depressed price levels.”Flow by digital assets. Source: Bloomberg, CoinSharesEric Balchunas and Athanasios Psarofagis, senior ETF analysts at Bloomberg Intelligence, noted that Bitcoin ETFs would continue to attract inflows in 2022 as investors wait for the United States Securities and Exchange Commission to “approve a spot Bitcoin ETF.”Spot Bitcoin recovery stallsAs Bitcoin ETFs indicate cautious accumulation, spot BTC has been threatening to continue its correction in the coming sessions.Related: Willy Woo: ‘Peak fear,’ but on-chain metrics say it’s not a bear marketIn detail, BTC/USD resumed its downside moves after failing to reclaim $40,000 on Feb. 1. The correction also appeared as the price tested a downward sloping trendline as resistance, serving as a descending channel’s upper trendline.BTC/USD daily price chart featuring descending channel. Source: TradingViewThat increased Bitcoin’s potential to extend its bearish momentum toward the channel’s lower trendline, sitting near $30,000, a strong support level.The views and opinions expressed here are solely those of the author and do not necessarily reflect the views of Cointelegraph.com. Every investment and trading move involves risk, you should conduct your own research when making a decision.

Čítaj viac

The US Federal Reserve is making some analysts bullish on Bitcoin again

Signs of a steady Bitcoin (BTC) price recovery emerged earlier this week as investors shifted away from the U.S. dollar on weaker-than-expected economic data.In detail, Bitcoin’s drop last week to below $33,000 met with a healthy buying sentiment that pushed its per token rate to as high as $39,300 on Feb. 1. As of Thursday, BTC’s price dipped below $37,000 but was still up 13% from its local bottom.Meanwhile, the U.S. dollar index (DXY), which measures the greenback’s strength against a basket of top foreign currencies, rose to 97.441 last Friday, logging its best level since July 2020. However, the index corrected by nearly 1.50% to over 96.00 by Feb. 3.DXY vs. BTC/USD daily price chart. Source: TradingViewSome market analysts saw the dollar’s renewed weakness as a sign of waning rate hike fears.For instance, Lyn Alden, the founder of Lyn Alden Investment Strategy, tweeted that the Fed “reached a fever height last week in terms of making more and more aggressive tightening scenarios,” noting that the central bank may turn dovish as “economic deceleration/weak PMI data takes center stage.”U.S. factory activity, employment dropsAlden cited the U.S. manufacturing growth, which, according to data released on Tuesday, dropped for the third month in a row in Jan. 2022. Notably, the Institute for Supply Management’s gauge of factory activity reached 57.60, its worst level since Nov. 2020, compared to 58.80 a month earlier.U.S. manufacturing growth data. Source: ISM, BloombergAdditionally, the ADP Research Institute data released Wednesday also showed cracks in the ongoing U.S. economic recovery, revealing that employment across the regional companies fell by 301,000 in December 2021, the highest since the early days of the Covid-19 pandemic.The lower-than-anticipated data came a week after the Federal Reserve Chairman Jerome Powell’s press conference. He raised speculations about raising interest rates three times in 2022 to tame the rising U.S. inflation.Powell’s hawkish turn pushed the price of Bitcoin down as the U.S. dollar strengthened. Currently, U.S. rate futures hint at four to five rate hikes in 2022. James Bullard, president of the Fed’s St. Louis branch, further stoked the “tightening” fears, stating earlier this week that five rises were “not too bad a bet.”Nonetheless, his hawkish comments coincided with a recovery rally in the Bitcoin market as the dollar pared gains, prompting Alden and other analysts to say that the market may have overreacted to Powell’s tightening outlook. Fed officials now cautiously hawkishOne of the primary catalysts behind the Fed’s rate hike plans was a steady recovery in the U.S. jobs market. But with lesser-than-expected ADP readings, the central bank could backtrack on its tightening plans. “They have moved from nearly all talk and little action to 100% hot air,” noted Preston Pysh, the founder of the Pylon Holding Company.Related: US crypto executive order looms — 5 things to watch in Bitcoin this weekSome Fed officials have also noted that the central bank might not go ahead with rate hikes as aggressively as anticipated. For instance, Kansas City Fed President Esther George said “unexpected adjustments” would not be in anybody’s interest. Similarly, San Francisco Fed chief Mary Daly also cautioned against tightening too quickly. Fed @ max hawkishness. Dovish from here. Implications for the dollar.— Teddy Vallee (@TeddyVallee) January 28, 2022Currently, the CME’s Fed Watch Tool predicts a 94.40% possibility of a 25 bps rate hike in March 2022. But whether there would be back-to-back increases for the rest of 2022 remains unclear. “They will hike, but not as much as the forward curve implies,” wrote Teddy Vallee, the founder of Parvelle Global, a New York-based hedge fund, adding: “Digital asset space pricing in worst case.”As a result, the very narrative that pushed the Bitcoin price to new multi-month lows last week appears to be showing cracks.The views and opinions expressed here are solely those of the author and do not necessarily reflect the views of Cointelegraph.com. Every investment and trading move involves risk, you should conduct your own research when making a decision.

Čítaj viac

Why did WazirX token WRX jump 30% after India announced its big crypto tax?

WazirX exchange’s native token WRX benefited the most from India’s latest u-turn on crypto this week.WRX price jumps on India tax newsWRX price surged nearly 30% to over $1, hitting a three-week high after the Indian government announced a new tax regime for the regional crypto sector, reversing entirely from its earlier strict stance that even contemplated an outright ban on the emerging industry.$WRX – Up on news! https://t.co/Ln504eUZzm pic.twitter.com/zN3pW84DPY— Yo! Crypto ₿ (@YoCrypto) February 1, 2022In her budget speech on Tuesday, Finance Minister Nirmala Sitharaman said that they plan to tax the income from trading cryptocurrencies at 30%, which while among the highest rates in the world, also means that digital assets are officially recognized in India.WRX price jumped after Sitharaman’s speech, probably due to its association with an India-based crypto exchange, WazirX. The WRX token serves as a utility token on the platform, benefitting users with trading fee discounts and access to new token airdrops. Another 250% rally ahead?Utility tokens typically derive their value from speculations that their adoption would grow in tandem with the growth of their platform, one that is no longer in regulatory limbo. Javon Marks, an independent market analyst, predicted further price booms in the WRX market, noting that the WazirX token could climb toward $3.80 from its current $1-levels. At the core of his bullish analogy was a technical setup, as shown in the attached chart.WRX/USD three-day price chart. Source: Javon Marks, TradingViewIn detail, WRX’s ongoing price boom had its price break above a multi-month downward sloping resistance trendline. Marks noted that the breakout “technically” positions the WazirX token to rise by another 252% in the coming sessions to its April 2021 resistance targets.”As long as WazirX holds this break, this target will remain pushable,” the analyst tweeted Wednesday.The statement also surfaced as the crypto market, on the whole, remained in a state of turmoil after a depressive January performance. WRX itself dropped more than 30% into the month, mirroring similar moves across the top-ranking crypto-assets, including Bitcoin (BTC), which tanked nearly 18% in the same period.The interim pullback scenarioWazirX’s day-to-day correlation with broader crypto market trends, however, puts WRX at risk of bearish continuation. It is primarily because the catalysts that played a key role in pushing the digital assets lower in January 2022 — the Federal Reserve’s hawkish turn — remain intact.Related: Bitcoin ‘gives back gains’ after Fed comments ‘add downside risks’ to crypto marketsAdditionally, the WRX price faces a technical resistance confluence that may limit its recovery bias in the sessions ahead. Specifically, a combination of price ceilings, including a descending triangle’s upper trendline, have already been capping the WazirX token’s upside attempts.WRX/USD daily price chart featuring descending triangle setup. Source: TradingViewOther resistance levels include a 50-day exponential moving average (50-day EMA; the red wave) and a 200-day EMA (the blue wave). A pullback upon testing them risks dropping the WRX price to the descending triangle’s lower trendline near $0.75.The views and opinions expressed here are solely those of the author and do not necessarily reflect the views of Cointelegraph.com. Every investment and trading move involves risk, you should conduct your own research when making a decision.

Čítaj viac

Can Ethereum price reach $4K after a triple-support bounce?

Ethereum’s native token Ether (ETH) looks ready to continue its ongoing rebound move toward $4,000, according to a technical setup shared by independent market analyst Wolf.Classic bullish reversal pattern in the works? The pseudonymous chart analyst discussed the role of at least three support levels in pushing the ETH price up by nearly 30% from its local bottom of $2,160. These price floors included a 21-month exponential moving average (EMA), the 0.786 Fib level of a Fibonacci retracement graph drawn from $1,716-swing low to $4,772-swing high and the lower boundary of an ascending triangle pattern.ETH/USD daily price chart featuring the three-supports. Source: TradingViewWolf noted that the triple-support scenario could push Ether price to $3,330. In doing so, the confluence would activate a classic bullish reversal setup, dubbed inverse head-and-shoulders (IH&S). In detail, the IH&S pattern could have Ether form three consecutive troughs, with the middle trough (the head) deeper than the other two (the left and right shoulders). Meanwhile, all the troughs will hang upside down below a common resistance trendline, called the neckline.In a “perfect” scenario, a break above the IH&S neckline may push the Ether price to as high as the maximum distance between the neckline and the head. That puts the ETH price en route to $4,000.ETH/USD daily price chart featuring IH&S setup. Source: Wolf, TradingViewBut if ETH gets rejected in the run-up to $3,000, it would mean a pullback toward the ascending triangle support. ETH bulls ain’t out of the woodsAs Cointelegraph covered earlier this week, Ether’s ongoing price rebound comes as a part of a broader correction that started after ETH reached its record high above $4,850 in November 2021. In doing so, the Ethereum token fell by as much as 55.65% to $2,159 before bouncing upward by 30% to reach its current price levels.The retracement could come out as a temporary respite in Ether’s general downtrend. As a result, its price could still fall lower, according to a “bear flag” setup shown in the attached chart below, with a downside target near $2,000.ETH/USD daily price chart featuring ‘bear flag’ pattern. Source: TradingViewSeveral on-chain indicators agree with the bearish outlook. For instance, Glassnode data shows that the Ethereum balance on all exchanges has been rising since early December 2021, coinciding with the ETH’s price declines.Ethereum balance on all crypto exchanges. Source: GlassnodeA rising number of ETH held by exchanges raises the likelihood of traders selling them for other assets. Notably, a yearlong decline in the number of ETH in exchanges’ reserves had coincided with the Ether price rallying from $730 to over $4,800.Ethereum whales vs. fishesMore downside cues for the Ethereum token come from a clear absence of influential buyers in the market. For instance, some of Glassnode’s metrics show that the number of Ether wallets that hold more than 100 ETH and less than 1,000 ETH has been declining steadily since the beginning of 2021.Ethereum number of addresses with a balance of at least 100 ETH. Source: GlassnodeEther is also not immune to the ongoing macroeconomic trends. For instance, its recent price decline appeared primarily in the wake of the Federal Reserve’s plans to speed up the withdrawal of its $120 billion a month COVID-19 stimulus program by March 2022, followed by at least three rate hikes.The U.S. central bank’s tapering plans have dented investors’ appetite for riskier assets, hurting tech stocks, gold and cryptocurrencies. As a result, Ethereum’s fundamental outlook risks turning extremely bearish.Related: Altcoins rack up 30% gains as Bitcoin price chases after $39,000Nevertheless, retail investors look unfazed by the macroeconomic developments. On Feb. 1, the number of ETH addresses with a non-zero balance reached a new record high of over 74.137 million. Last week, the total amount of wallets with at least 1 ETH had also peaked near 1.414 million.Ethereum number of addresses with balance of at least 1 ETH. Source: GlassnodeEthereum addresses with a balance of at least 10,000 ETH — the real whales — also show a slight improvement. In detail, their numbers increased from 1,157 to 1,163 during the January 2022 price correction, showing that the richest wallet holders had been buying the dip.Easing will returnAccording to Nick, a market analyst from Ecoinometrics, the cryptocurrency market is still in a “danger zone” due to the Fed’s hawkish turn. But there is still hope that the central bank would once again switch to quantitative easing if the stock market falls by another 15%–20%.”It is when there is blood on the streets that you can find good opportunities to make money,” Nick wrote in the latest analysis, adding;”Even though there are some risks of more downside or simply a prolonged period of weak price action until the Fed comes back to its senses, now is probably a good time to build a position and wait for the real pump to begin.”The views and opinions expressed here are solely those of the author and do not necessarily reflect the views of Cointelegraph.com. Every investment and trading move involves risk, you should conduct your own research when making a decision.

Čítaj viac

Získaj BONUS 8 € v Bitcoinoch

nakup bitcoin z karty

Registrácia Binance

Burza Binance

Aktuálne kurzy