Can Bitcoin break out vs. tech stocks again? Nasdaq decoupling paints $100K target
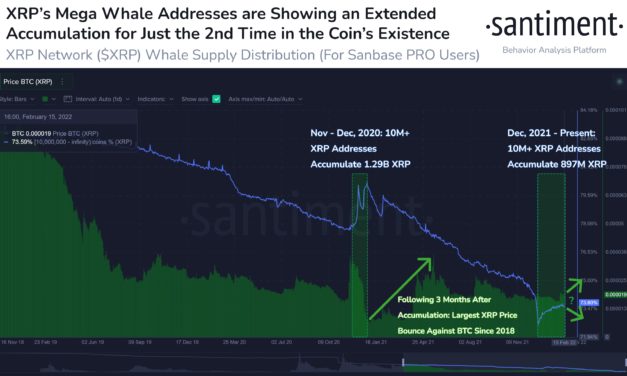
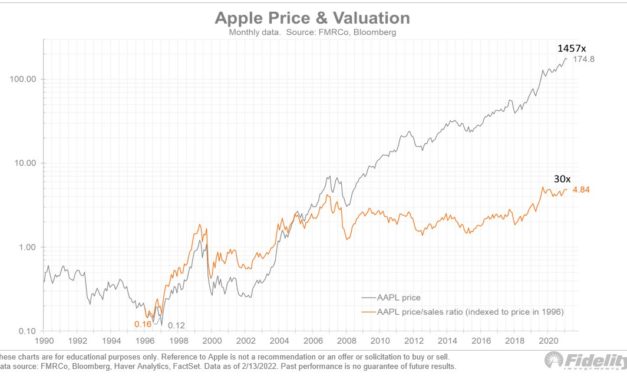
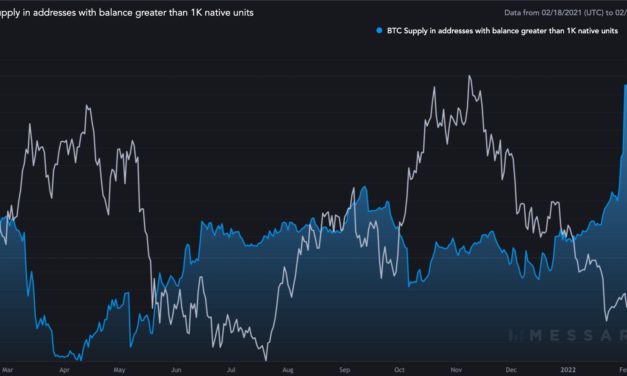
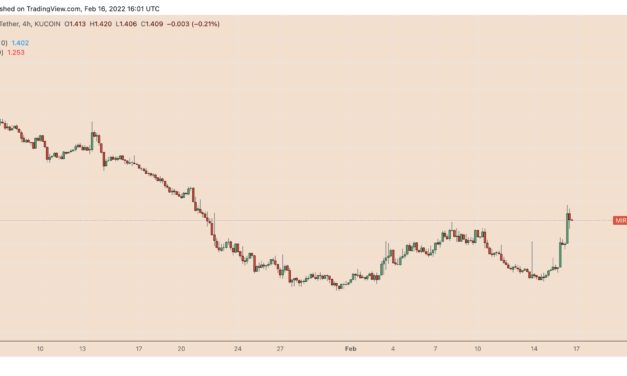
A potential decoupling scenario between Bitcoin (BTC) and the Nasdaq Composite can push BTC price to reach $100,000 within 24 months, according to Tuur Demeester, founder of Adamant Capital.Bitcoin outperforms tech stocksDemeester depicted Bitcoin’s growing market valuation against the tech-heavy U.S. stock market index, highlighting its ability to break out every time after a period of strong consolidation. “It may do so again within the coming 24 months,” he wrote, citing the attached chart below.BTC/USD vs. Nasdaq Composite weekly price chart. Source: Tuur Demeester, StockCharts.comBTC’s price has grown from a mere $0.06 to as high as $69,000 more than a decade after its introduction to the market, as per data tracked by the BraveNewCoin Liquid Index for Bitcoin (BLX). BTC/USD versus Nasdaq Composite monthly price chart. Source: TradingViewThat amounted to around a 64.50 million percent increase in Bitcoin’s price since 2010. In comparison, Nasdaq’s returns in the same period come to be nearly 650% — from 20.99 points on June 22, 2020, to 171.54 as of Feb. 18, 2022. As a result, Bitcoin’s market cap has grown to $755 billion compared to Nasdaq’s $28.68 billion.Will Bitcoin decouple from tech stocks again?Bitcoin’s history so far has witnessed multiple periods of its strong correlation with U.S. tech stocks. For instance, earlier this month, the cryptocurrency’s correlation efficiency with Nasdaq reached 0.73, almost near its five-year high of 0.74 in 2020, as per data from Bloomberg.Bitcoin and tech stocks price performance since. September 2017. Source: BloombergBTC’s price per token dropped from its record high of $69,000 to below $33,000 last month amid a selloff across broader risk-on markets. The decline was accompanied by the Federal Reserve’s decision to aggressively raise benchmark rates against rising consumer prices, which reached their four-decade high in January 2022.Matthew Sigel, head of digital assets research at VanEck Associates, anticipated Bitcoin to fall alongside Nasdaq and other U.S. stock indexes, albeit more severe. However, he notes that Bitcoin’s volatility has been in a downtrend in recent years. In comparison, Nasdaq 100 has been exhibiting more standard deviation moves than its five-year average. The outlook portrays that Bitcoin has been gradually improving to become a dependable safe-haven asset against rising inflation. As a result, its correlation with risk-on assets, such as tech stocks could decline. Related: U.S. inflation breaks 40-year record: Can Bitcoin serve as a hedge asset?”It’s correlated for now,” said James Butterfill, head of research at data analytics firm CoinShares, told Bloomberg, adding that the cryptocurrency is “quite sensitive to rising interest rates” fears. He noted:”But what happens in a situation where you have a policy mistake, i.e. the Fed hikes too aggressively, for instance, or they don’t hike aggressively enough, and there’s an inflation problem. That would actually probably be much more supportive of Bitcoin and less supportive for equities.”Additionally, Joey Krug, CEO of Pantera Capital — a crypto-focused hedge fund, anticipates the decoupling to happen in the “next number of weeks,” noting that “crypto will begin to trade on its own.”That $100K BTC price targetDemeester cited Bitcoin’s ability to consolidate around $50,000 despite reeling under the pressure of its correlation with Nasdaq as one of the primary reasons why it could embark on a run-up toward $100,000.Related: https://t.co/0qBrwPQCLe— Tuur Demeester (@TuurDemeester) February 19, 2022The price target came in line with what Goldman Sachs anticipated at the beginning of 2022. The investment giant, which manages $1.2 trillion worth of assets globally, noted that Bitcoin could reach $100,000 if it takes some part of the market share of gold, a traditional safe-haven asset. Today, Bitcoin’s market cap is just under 6% of gold’s.The views and opinions expressed here are solely those of the author and do not necessarily reflect the views of Cointelegraph.com. Every investment and trading move involves risk, you should conduct your own research when making a decision.
Čítaj viac