Bitcoin Elliott Wave Theory suggests BTC price can drop to $25.5K this year
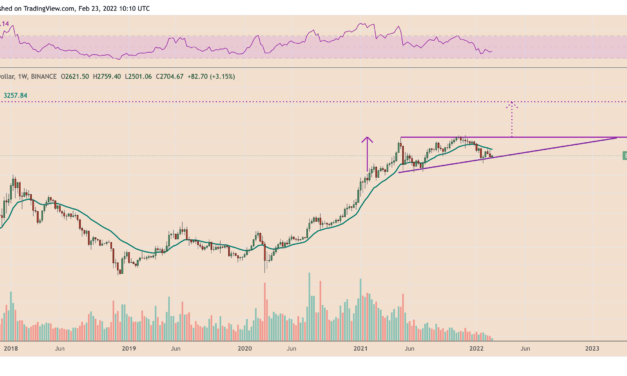
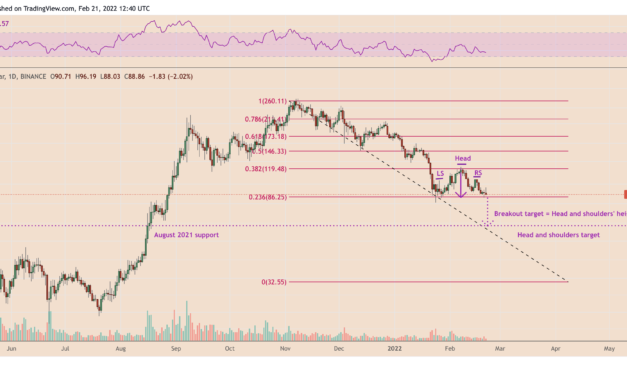
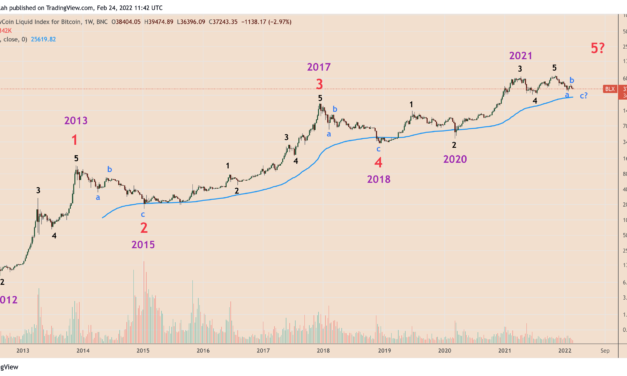
The ongoing Bitcoin (BTC) price correction could continue as per almost a century-old technical analysis principle called the “Elliott Wave Theory.”The interim bearish outlook put forth by the Elliot Wave Theory appeared as Bitcoin tumbled below $35,000 amid the Russia-Ukraine conflict.Bitcoin wave fractal eyes repetitionThe theory, which divides a price cycle into two sets—one consisting of five upward-trending impulse waves and the other having three follow-up corrective waves—points to the possibility of BTC’s price dropping toward $25,500 in 2022. At the core of its bearish outlook is its record of predicting cyclical tops and bottoms throughout the Bitcoin market’s history, as shown in the chart below.BTC/USD weekly price chart featuring Elliott Waves. Source: TradingViewThe Bitcoin chart shows three primary impulse waves (1, 3, and 5 in red) and two corrective waves (2 and 4 in red). The fifth wave is still in development, underscoring BTC’s potential to reach above $100,000 in the future. But together, these five waves represent an upward structure that will likely exhaust at wave 5 and follow up with three corrective waves: A, B, and C.Meanwhile, each large wave marked in red consists of sub-waves, featuring a five-wave advance (impulse) in the direction of the trend of one large degree (from 1 to 5 in black), followed by a three-wave correction against the higher degree trend (from a to c in blue).BTC/USD weekly price chart featuring sub-waves. Source: TradingViewBetween 2012 and 2018, Bitcoin’s price has repeatedly rallied between wave 1 to wave 5 followed by a correction from wave a to wave c. Each time, wave c, which coincided with Bitcoin’s 200-week exponential moving average (50-week EMA), marked BTC’s price bottom and the completion of the so-called Elliott Wave Cycle, be it in 2015 or 2018.Related: FTX CEO weighs in on Bitcoin market outlook amid Ukraine crisisAfter 2018, Bitcoin entered a new Elliott Wave Cycle. It has already undergone the five-wave advance — from near $3,200 in December 2018 to around $69,000 in November 2021 — and is now in the midst of its three-wave correction, awaiting the formation of its final wave c. BTC/USD weekly price chart featuring the ongoing Elliott Wave Cycle. Source: TradingViewConsidering the next wave c appears around the 200-day EMA, it could mean BTC will hit levels around $25,500.The views and opinions expressed here are solely those of the author and do not necessarily reflect the views of Cointelegraph.com. Every investment and trading move involves risk, you should conduct your own research when making a decision.
Čítaj viac