Autor Cointelegraph By Yashu Gola

Terra price gains 75% in February as $2.57B in LUNA tokens removed from supply

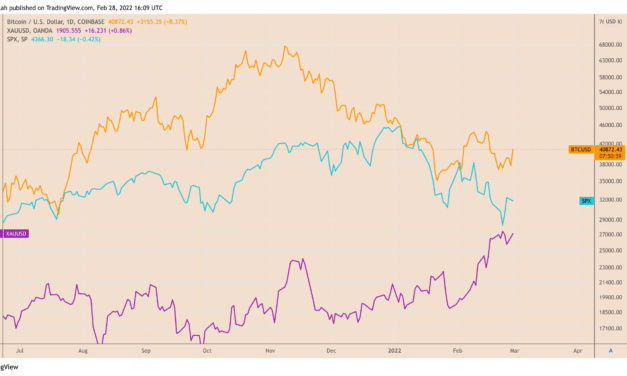
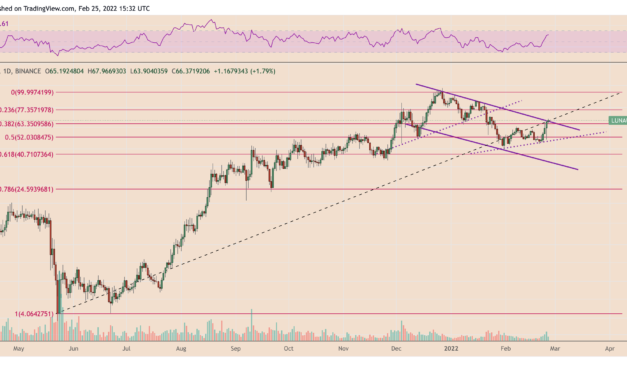
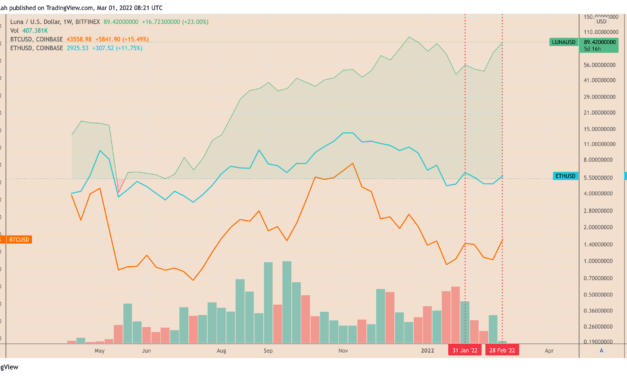
Terra (LUNA) emerged as one of the best performing financial assets in February, a month mired by geopolitical conflicts and their negative impacts on the crypto market.LUNA decouples from the crypto marketLUNA’s price surged by a little over 75% to reach $91.50 at the month’s UTC close. In comparison, the percentage performance of other top tokens, mainly Bitcoin (BTC) and Ether (ETH), in the same period came out to be around 12.25% and 9%, respectively.LUNA/USD versus BTC/USD and ETH/USD weekly price charts. Source: TradingViewInterestingly, most of LUNA’s gains in February surfaced on the month’s last day. The Terra token jumped 26% on Feb. 28, in part due to similar upside moves elsewhere in the crypto market. For instance, BTC and ETH rose 14.50% and over 11.50%, respectively, on the same day.While still positive at 0.09, LUNA’s correlation with Bitcoin has come off lately after hitting 0.81 on Feb. 21, data from TradingView shows. A correlation of 1 means that two assets are in lockstep, while 0 shows that their price moves independently.LUNA/USD correlation coefficient on the daily chart. Source: TradingViewTerra’s LUNA/BTC pair also showed its growing valuation against the top cryptocurrency. In detail, the LUNA/BTC pair rose by over 56% to 21,171 satoshis in February, suggesting traders sought hedge in the Terra token as Bitcoin’s correlation with a bearish stock market grew, reaching 0.70 earlier this year.Bitcoin correlation with stocks since March 2021. Source: Bloomberg As to why traders appeared to have considered LUNA as their interim safe haven in the first place, the answer might lie in Terra’s token economics.29M Terra tokens destroyedData fetched by analytics platform Smart Stake showed that Terra protocol burned 29 million LUNA tokens worth $2.57 billion recently. That happened as the supply of TerraUSD (UST), a stablecoin backed not by the U.S. dollar but LUNA, increased from around 11.26 million on Feb. 1 to almost 12.92 million on Feb. 28, marking an increase of nearly 14.75%.LUNA and UST supply all across February 2022. Source: Smart StakeTraders consider an increasing UST supply a bullish catalyst for LUNA, mainly because of the so-called UST-LUNA token model. In detail, Terra preserves UST’s peg of USD through an elastic monetary policy. So when the value of UST goes above $1, Terra incentivizes its users to burn LUNA and mint UST.But when the UST supply contracts, LUNA valuation decreases due to a slowdown in the burning mechanism. All and all, LUNA’s valuation tends to rise alongside UST’s supply.On Feb. 22, the Luna Foundation Guard (LFG) — a nonprofit organization supporting the Terra blockchain ecosystem, announced that it had raised $1 billion in a LUNA token sale round led by Three Arrows Capital, a venture capital firm backed by Ethereum-skeptic Su Zhu and Jump Crypto, a trading group known for assisting Solana’s cross bridge platform Wormhole in replenishing their stolen $300 million.1/ The long awaited [REDACTED] 3 is here!The Luna Foundation Guard (LFG) has closed a $1 billion private token sale to establish a decentralized $UST Forex Reserve denominated in $BTC! — Terra (UST) Powered by LUNA (@terra_money) February 22, 2022LFG revealed that it would use the proceeds to build a “UST Forex Reserve,” raising prospects of boosting the stablecoin’s supply by another billion-dollar worth of LUNA-backed tokens.LUNA’s price has risen by nearly over 90% since the LFG’s announcement. In contrast, the total market capitalization of all the cryptocurrencies combined has rallied by just 13% in the same period, underscoring that crypto traders have been flocking into the Terra market.What’s ahead for LUNA?Terra’s technical outlook looks skewed to the upside owing to an ongoing “bull flag” breakout move.Bull flags are bullish continuation patterns that appear when the price consolidates lower inside a descending channel after a strong move upward. Eventually, it breaks out of the channel range to the upside, with a price target ideally at length equal to the size of the upside move that preceded the bull flag formation.LUNA appears to have entered the final phase its bull flag setup, as shown in the chart below. It now eyes a run-up toward $120, an all-time high for Terra if achieved.LUNA/USD three-day price chart featuring bull flag setup. Source: TradingViewOn the flip side, LUNA’s volumes on the three-day chart appear weak, showing the ongoing upward retracement remains less convincing to traders. Its volume profile also shows little historic activity above $70.Related: $300M in crypto liquidations accompanies Bitcoin’s surge to $44KAdditionally, LUNA’s daily relative strength indicator (RSI) has been flashing an “overbought” warning, noting that it could go a degree of price correction in the coming sessions.LUNA/USD daily price chart featuring RSI. Source: TradingViewNonetheless, in the long term, the Terra token’s path of least resistance remain to the upside, with its year-over-year performance against the dollar coming out to be over 1,200% as of Feb. 28, 2022.  The views and opinions expressed here are solely those of the author and do not necessarily reflect the views of Cointelegraph.com. Every investment and trading move involves risk, you should conduct your own research when making a decision.

Čítaj viac

Bitcoin rebounds over $41K after painting a 'bullish hammer' — Can BTC hit $64K next?

Bitcoin (BTC) rallied above $41,000 on Feb. 28 in a new sign of buying sentiment returning after last week’s brutal selloff across the risk-on markets, including the S&P 500.BTC’s price jumped by over 9% to reach $41,300 in part as traders reacted to the ongoing development in the Russia-Ukraine crisis. In doing so, the cryptocurrency briefly broke its correlation with the U.S. stock market indexes to perform more like safe-haven gold, whose price also went higher in early trading Monday.BTC/USD versus XAUUSD and S&P 500 daily price chart. Source: TradingViewBitcoin downtrend exhausting — analystJohal Miles, an independent market analyst, spotted “significant buying pressure” in the market, adding that its downtrend might be heading towards exhaustion.Miles highlighted Bitcoin’s recent upside retracement moves upon testing levels near $34,000 as support. For instance, on Jan. 24 and Feb. 24, BTC’s price formed a bullish hammer candlestick on its daily chart, hinting at a U-turn during an established downtrend.BTC/USD daily price chart. Source: Johal Miles, TradingViewThe same bullish hammers appeared last year in May and June, with their bottoms sitting below the key support level of $30,000. This was followed up with a sharp price reversal in the Bitcoin market with BTC’s price reaching as high as $69,000 in November 2021.Additionally, Miles noted that the buying sentiment in the area between $28,500 and $34,200 came to be comparatively higher than around $46,000, a support Bitcoin broke to the downside in January 2022.”The key difference between the current range and the range we had previously at 46k is we are now seeing significant buying pressure when we visit the lows,” the analyst tweeted Monday, adding: The spells exhaustion of the downtrend to me, similar to summer.Buying pressure at the lows on equities. Bottom forming a clear possibility. Acceleration out of here possible we could also sweep the lows once more but expect buyers to step in again.Smart money buying, dumb money selling.$BTC pic.twitter.com/eNSibdZkfd— Miles J Creative (@JohalMiles) February 28, 2022BTC to $64K?Alexander Tkachenko, CEO and Founder, VNX — a Luxembourg-based token issuance platform, highlighted Bitcoin’s potential to rebound sharply following a confirmed U.S. stock market bottom, adding that its price could reach $64,000 based on Wycoff methodology.BTC/USD daily price chart featuring Wycoff model. Source: TradingView”From a global perspective, all signs are that Bitcoin has entered the re-accumulation stage according to Wycoff’s methodology,” he told Cointelegraph, adding:”One can expect a move towards USD64,000 and a further upward trend mid-term. The potential growth in the price of Bitcoin is imminent as projected, particularly drawing on the coin’s close ties to mainstream or the traditional stock market, the S&P Index.”Macro analysts also noted that the benchmark S&P 500 might have started bottoming out after staging a historical reversal on Feb. 24. In detail, the index rebounded by nearly 4.5% despite being initially down by more than 2.5%. Such a retracement has not happened since the 2008 financial crisis.PC Oscillator has now found a local bottom at the support of February 2020, which may hint at a continuation of the local rebound. The question is if the rebound continues, will #Bitcoin follow it or not? Correlation says YES, but it may be OTHERWISE!$SPX $BTC #btc #crypto pic.twitter.com/zB9crBCXhg— barovirtual.io (@BaroVirtual) February 27, 2022

Chris Murphy, co-head of derivatives strategy at Susquehanna International Group, said sharp stock market reversals during a price correction are “indicative of a classic bear market rally,” except when the economy has not been undergoing a phase of recession.”Historical precedence says we are [near the lows of the ongoing correction] if we avoid a recession,” he told Business Insider while highlighting the improving U.S. economic data, ranging from a strong consumer balance sheet to record-high corporate earnings to a strengthening labor market.SPX daily price chart ft. MACD indicator. Source: TradingViewThe views lined up with what FS Insight predicted in its recent S&P 500 market analysis. Co-founded by JPMorgan’s former equity strategist Tom Lee, the firm noted that the index showed signs of bottoming out.Related: Hodl, don’t trade, says the AI Bitcoin trading bot”Prices remain under prior days’ highs amidst a negative trend with bearish momentum,” said Mark Newton, FS’s head of technical strategy, in a note, adding: “I favor being long and buying dips, anticipating that markets work higher into March FOMC and that Growth outperforms Value.”Classic Bollinger Band W bottom on the weekly $SPX chart.https://t.co/FHEInV5pwE— John Bollinger (@bbands) February 25, 2022

The correlation between Bitcoin and S&P 500 was 0.36 above zero as of Feb. 28, 16:30, UTC.The views and opinions expressed here are solely those of the author and do not necessarily reflect the views of Cointelegraph.com. Every investment and trading move involves risk, you should conduct your own research when making a decision.

Čítaj viac

Terra's Mirror Protocol MIR rebounds 40% two days after crashing to record low

Mirror Protocol, a decentralized finance (DeFi) protocol built on the Terra blockchain, was hit by one of the biggest collapses in financial history this week after Vladimir Putin ordered military strikes against Ukraine. Terra tokens rallyMirror Protocol’s native token, MIR, dropped to $0.993 on Feb. 24, its worst level to date amid a selloff across the broader crypto market. But a sharp rebound ensued, taking the price to as high as $1.41 two days later, up more than 40% when measured from MIR’s record low.MIR/USD four-hour price chart. Source: TradingViewJust like the drop, MIR’s upside retracement came in the wake of similar recoveries elsewhere in the crypto market. But interestingly, MIR/USD returns appeared larger than some of the highly valued digital assets, including Bitcoin (BTC) and Ether (ETH). Notably, Bitcoin rallied up to 17% after bottoming out locally on Feb. 24, below $34,500. In contrast, Ether’s gains in the same period came out to be a little over 25% after bouncing from $2,300. On the other hand, Terra (LUNA), whose protocol hosts the Mirror Protocol’s synthetic assets platform, rebounded by more than 50% in the same period.Interestingly, another Terra blockchain-backed token, Anchor Protocol (ANC), jumped more than 45% from its Feb. 24 low of $2.64, reaching its best level to date just shy of $4.MIR paints a “golden cross” but…The recent upside boom in the Mirror Protocol market also resulted in the formation of a so-called golden cross pattern.In detail, MIR’s 20-4H exponential moving average (20-4H EMA; the green wave) surged above its 50-4H EMA (the red wave), a move that typically follows up with a short-term uptrend, as per the Mirror Protocol’s recent market history.Nonetheless, the readings on the MIR’s four-hour relative strength index (RSI) — which went above 70 during the weekend — alerted about its “overbought” status. That has coincided with a correction in the Mirror Protocol market, with MIR now down over 10.5% from its retracement high near $1.41.MIR/USD four-hour price chart featuring golden cross and Fibonacci retracement levels. Source: TradingViewThe decline has had MIR break below $1.36, one of its previous support levels that also confluences with the 61.8 Fib line of a Fibonacci Retracement Graph made from $1.58-swing high to $1.00-swing low. The price now eyes additional drops toward the next support levels near the 0.5 Fib line around $1.29, followed by the 0.236 Fib line at $1.13.Related: Cointelegraph Consulting: A look at Terra’s ecosystemConversely, if MIR holds above its 20-4H and 50-4H EMAs, its likelihood of retesting $1.58 might increase. Its bullish outlook also depends on how the ongoing geopolitical conflict in Eastern Europe plays out, and its impact on Bitcoin.MIR/USD four-hour price chart featuring correlation between Bitcoin and Mirror Protocol. Source: TradingViewNotably, the correlation coefficient between Bitcoin and Mirror Protocol sits near 0.75 above zero, meaning MIR price is more or less mirroring the moves of the top digital asset for the time being. The views and opinions expressed here are solely those of the author and do not necessarily reflect the views of Cointelegraph.com. Every investment and trading move involves risk, you should conduct your own research when making a decision.

Čítaj viac

Terra LUNA price nears key level after rallying 45% this week

A rebound rally in the Terra (LUNA) market this week risks exhaustion as the price retests a key trendline for a potential pullback.Descending channel risks LUNA declineLUNA has been trending lower inside a falling channel—made up of two parallel descending trendlines—since December 2021. In doing so, the Terra token typically tests the lower trendline as support for a rebound to the upper trendline, as shown in the chart below.LUNA/USD daily price chart featuring falling channel. Source: TradingViewSimilarly, a pullback from the upper trendline sends the price to the lower trendline. For now, LUNA looks poised to repeat the correction move, taking further cues from its daily relative strength index that now treads near its overbought reading of 70 — a sell indicator. If the pullback occurs, the price would risk dropping to its interim downside target near $52, coinciding with the 0.5 Fib line of the Fibonacci retracement graph drawn from $4-swing low to $100-swing high. If an extended correction occurs, LUNA could retest $40, a 0.618 Fib line that comes closest to the falling channel’s lower trendline.LUNA best performer this week so farThe short-term bearish outlook appears after Terra’s 45% price rally to around $68 this week, its best level since Jan. 25. Interestingly, LUNA/USD went higher despite a gloomy outlook elsewhere in the crypto market, led by the Russian military’s invasion of Ukraine that dampened investors’ risk-on sentiments. Related: Terra avoids Ukraine concerns rallying 18% in three days — Can LUNA price reach $200 next?The next-best performing token this week among the top cryptos has been Cardano (ADA). Interestingly, ADA’s week-to-date returns sit near 6% below zero, meaning LUNA has been outperforming its nearest rivals, including Bitcoin (BTC) and Ether (ETH), by a wide percentage margin in the said period.LUNA weekly performance vs. other top assets. Source: MessariLUNA’s superior performance appeared partly due to the news surrounding the $1 billion raised to establish a Bitcoin reserve for Terra’s stablecoin UST. Additionally, Anchor Protocol (ANC), which recently received a $450 million UST from the Luna Foundation Guard (LFG), rose by nearly 70% under Terra’s shadow.The views and opinions expressed here are solely those of the author and do not necessarily reflect the views of Cointelegraph.com. Every investment and trading move involves risk, you should conduct your own research when making a decision.

Čítaj viac

Bitcoin investors ‘buy the dip’ as BTC nears $40K, gaining 16% in less than 24 hours

Buyers returned to the Bitcoin (BTC) market, locating interim upside opportunities as the price rebounded to nearly $40,000 on Feb. 25, gaining 16% in less than 24 hours. Investors bulk up Bitcoin holdingsThe number of Bitcoin addresses with a balance greater than 0.01 BTC (~$400) reached a record high of 9.51 million, the latest data from Coin Metrics shows. Meanwhile, the number of addresses that hold at least 0.1 BTC (~$3,850) also reached 3.34 million for the first time in history.Bitcoin addresses with a balance greater than 0.1 BTC. Source: Coin Metrics, MessariOn the whole, Bitcoin’s network added a little over 24,500 addresses with a non-zero balance on Thursday, coinciding with BTC’s choppy price moves — from around $37,200 to below $34,500, followed by a recovery toward $40,000.Bitcoin on-chain accumulation trends. Source: EcoinometricsData resource Ecoinometrics divided the addresses into two groups — one that holds less than 1 BTC and the other that holds anywhere between 1,000 BTC and 10,000 BTC — noting that both groups have been “buying the Bitcoin dip” and saying:“Probably a smart move if you have a long term investment horizon.” BTC/USD hourly price chart. Source: TradingViewAs the Ukraine crisis unfolds…The prospects of higher inflation may also be rising, with the Ukraine–Russia conflict leading to higher commodity prices globally despite the United States Federal Reserve preparing to tighten policy next month. But Mohamed El-Erian, chief economic adviser at Allianz, stated that the central bank’s officials would not pursue its aggressive rate-hiking plans amid the worsening geopolitical outlook.“This takes the 50 basis point [rate increase] completely off the table,” he told CNBC, adding:“It takes the eight, nine hikes people were talking about for this year off the table. I don’t think the U.S. economy could accommodate such slamming of the brakes of monetary policy. It means the Fed is going to have to be even more careful and tolerate inflation.”GOLDMAN SACHS: THINK GEOPOLITICAL UNCERTAINTY FURTHER LOWERS THE ODDS OF A 50 BPS HIKE IN MARCH— *Walter Bloomberg (@DeItaone) February 24, 2022Michael Saylor, CEO of MicroStrategy, commented on El-Erian’s Fed outlook, saying that the ongoing Ukraine–Russia conflict could create inflation and “make Bitcoin compelling.”Saylor’s firm holds over 125,000 BTC worth aroun $4.84 billion in its treasury, as per Bitcoin Treasuries.Wars create inflation, cripple commerce, and make #bitcoin compelling. pic.twitter.com/YksI21FcXS— Michael Saylor⚡️ (@saylor) February 24, 2022

Bitcoin below $30K next?Despite Saylor’s upside outlook, which appeared after Bitcoin’s intraday rebound toward $40,000, the market’s Fear & Greed Index score came out to be 27, showing uneasiness among investors andtraders for the near term.Bitcoin Fear & Greed ndex. Source: Alternative.meNick, an analyst at Ecoinometrics, also noted that Bitcoin’s price could undergo a price correction below $30,000 despite having a strong upside outlook in the long term. The reason cited is the imbalance between bearish and bullish positions on the Chicago Mercantile Exchange’s (CME) Bitcoin options market, skewed more toward the former.Related: Ukraine Bitcoin exchange volume spikes 200% as Russia war sparks currency concerns“The puts to calls ratio on the CME Bitcoin options market remains at three puts for every call,” he wrote in a report published on Feb. 23, adding that “50% of the puts are on strikes” are now below $30,000.“So that gives you an idea on what the market expects in the short term.”The views and opinions expressed here are solely those of the author and do not necessarily reflect the views of Cointelegraph.com. Every investment and trading move involves risk, you should conduct your own research when making a decision.

Čítaj viac

Získaj BONUS 8 € v Bitcoinoch

nakup bitcoin z karty

Registrácia Binance

Burza Binance

Aktuálne kurzy