Autor Cointelegraph By Yashu Gola

Institutions increase exposure to Grayscale Bitcoin Trust as GBTC discount nears 30%

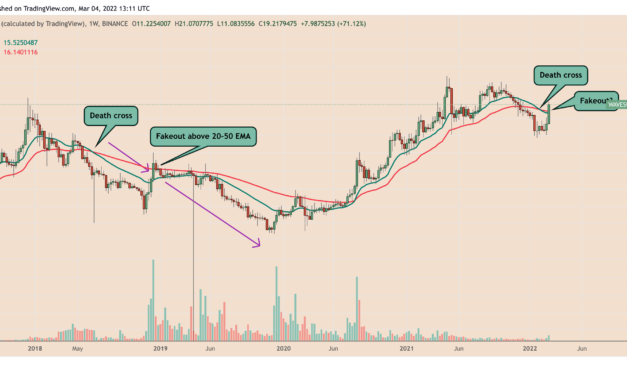
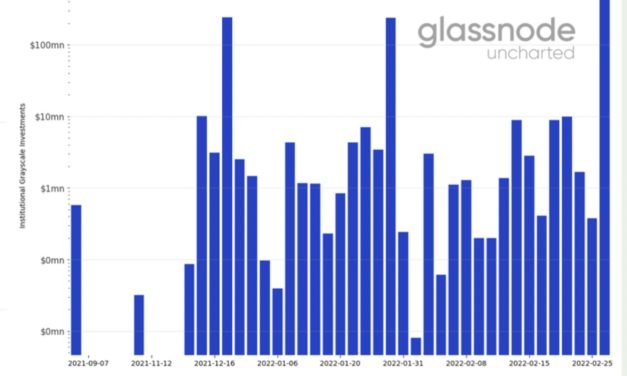
Institutional investors are returning to accumulate Grayscale Bitcoin Trust (GBTC) shares as the discount to spot price his risen to nearly 30%, data on Glassnode shows.Since December 2021, some weekly sessions saw investors pouring in between $10 million and $120 million into Grayscale’s flagship fund. Meanwhile, the biggest capital inflow — amounting to nearly $140 million — appeared in the week ending on Feb. 25, as shown in the chart below.Institutional Grayscale Investments since September 2021. Source: GlassnodeNo selloff yet among high-profile GBTC backersThe GBTC trust attracted investments as global markets faced back-to-back shocks in the past few months, including a dramatic selloff in the technology stocks, followed by Russia’s invasion of Ukraine that left many fund managers with a double-digit percentage loss.For instance, Cathie Wood’s ARK Next Generation ETF (ARKW), which holds $478 million worth of GBTC, crashed by nearly 45% year-over-year, primarily owing to its exposure in the sectors that suffered the most during the recent market turbulence, including technology (43.14%) and communication (27.99%). ARKW weekly price chart. Source: TradingViewBut in November 2021, ARKW added over 450,000 GBTC shares to its portfolio, when their discounts were as steep as nearly 17.5%.Similarly, the Morgan Stanley Insight Fund (CPODX) held over 1.5 million GBTC as of Sep. 30, 2021, according to its securities filings with the U.S. Securities and Exchange Commission (SEC). Its year-over-year performance as of March 6, 2022, came to be around minus 43%.Both ARKW and CPODX underperformed as GBTC fell by 43% in the past 12 months. Nonetheless, neither ARKW nor CPODX reported selling significant shares of GBTC.Institutional Grayscale Investments. Source: Swissblock Technologies, GlassnodeETF hype?Many factors attribute to GBTC’s underperformance, including rising competition from exchange-traded funds (ETF) in Canada. Unlike GBTC, ETFs allow investors for Share Redemptions, a process through which a fund can destroy shares based on demand-supply dynamics.Digital Currency Group, Grayscale’s parent company, has attempted to reduce the discount by buying back GBTC shares. But its efforts have been mired further by the launch of ProShares Bitcoin Strategy ETF (BITO), which holds futures contracts. This has ended up dislocating GBTC’s price further away from Bitcoin’s spot price.Grayscale Bitcoin Trust’s discount/premium to net asset value. Source: YChartsNow, Grayscale has been working on a discount killer switch, through its attempts to convert GBTC from a trust fund to an ETF tied to Bitcoin’s price. If the SEC approves Grayscale’s application, it would prompt the GBTC discount to reset from its current discount levels to zero.Nonetheless, the SEC has not approved a single spot Bitcoin ETF application citing risks relates to price manipulation. In comparison, regulators in Canada and Europe have been more welcoming to physical Bitcoin-backed investment products.Investment management firm Investor Trip asserted that the SEC would eventually approve the spot ETF “due to pressure from 3rd party supporters.”Related: Grayscale launches campaign to encourage public comments on Bitcoin ETF application”If approved, Grayscale will convert the trust into a Spot ETF and the discount opportunity will no longer exist,” it wrote in its analysis published Feb. 14.Conversely, analysts at Conservative Income Portfolio called GBTC an investment that is “destined for zero,” noting that its discount of net-asset-value of Bitcoin “is not really relevant.””It might be relevant from a shorter term bounce perspective as a measure of sentiment.”The views and opinions expressed here are solely those of the author and do not necessarily reflect the views of Cointelegraph.com. Every investment and trading move involves risk, you should conduct your own research when making a decision.
The views and opinions expressed here are solely those of the author and do not necessarily reflect the views of Cointelegraph.com. Every investment and trading move involves risk, you should conduct your own research when making a decision.

Čítaj viac

WAVES risks 'death cross' plunge after price rallies 88% in six days

A major rally in WAVES price this week that saw it nearly double risks faltering in the coming sessions due to a “death cross” technical pattern.WAVES price crashed 85% after ‘death cross’ in 2018A death cross measure appears when an asset’s long-term moving average closes above its short-term moving average. Notably, on the WAVES’ weekly chart, its 50-week exponential moving average (50-week EMA; the red wave) jumped above its 20-week exponential moving average (20-week EMA; the green wave) in the week ending Feb. 21 — a bearish crossover.WAVES/USD weekly price chart featuring ‘death cross.’ Source: TradingViewThat is WAVES’ first “death cross” occurrence on a weekly chart since June 2018. In both cases, the correction in the WAVES market appeared due to selloff across the broader crypto market following a massive bull run. As it happened, WAVES fell by up to 85% after the 2018 death cross formation, despite briefly closing above both its 20-week and 50-week EMAs in impressive but fake bullish rebound moves.Therefore, WAVES’ latest upside retracement, albeit its best weekly performance since April 2018, still treads under long-term bearish risks. As a result, a price drop below the 20-week and 50-week EMA could spell another selling round in the market.That WAVES selloff levelTo recap, WAVES, the native token of a blockchain platform of the same name, rallied by as much as 88% week-to-date to reach over $21 apiece during the weekend. As Cointelegraph covered earlier, migration to Waves 2.0, partnership with interoperable blockchain service provider Allbridge, and an upcoming $150 million fund to boost Waves’ growth in the U.S. served as tailwinds to WAVES upside boom.Related: 3 reasons why Waves price gained 100%+ in the last weekBut signs of correction have emerged as WAVES falls nearly 10% from its local top near $21 this Saturday. Interestingly, the inflection point coincides with the 1.00 Fib line of the Fibonacci retracement graph made from the 21.60-swing high to 0.54-swing low, which served as key resistance during January 2018, April 2021, and November 2021 corrections — as shown in the chart below.WAVES/USD weekly price chart featuring its ‘critical resistance.’ Source: TradingViewFor instance, in April 2021 and November 2021, bulls attempted to flip $21.60 as support but failed. As a result, WAVES has spent most of its time under the said 1.00 Fib level than above it, suggesting an unstable upside sentiment around it.The Fibonacci fractal suggests that WAVES would undergo a pullback move toward its next line of supports near $17, $13.50, and $11. Conversely, a decisive move above $21.60 could have bulls retest levels above $34.50.The views and opinions expressed here are solely those of the author and do not necessarily reflect the views of Cointelegraph.com. Every investment and trading move involves risk, you should conduct your own research when making a decision.

Čítaj viac

Terra's Anchor Protocol erases 'crypto winter' losses, ANC price rebounds 300% in a month

Anchor Protocol (ANC), the decentralized finance (DeFi) platform built on the Terra blockchain protocol, rebounded nearly 300% in over a month after bottoming out near $1.26.ANC price went as high as $4.97 on the Bitfinex cryptocurrency exchange on March 3, 2022, breaking above the previous record peak near $4.50 established on Dec. 3 last year. In doing so, the Anchor Protocol also erased all the losses it had incurred during what some called the “crypto winter” that started in Q4/2021 — against the prospects of the Federal Reserve’s aggressive rate hikes.ANC/USD daily price chart featuring its recent bottom and top levels. Source; TradingViewANC is the governance token of the Anchor Protocol’s decentralized money market that offers UST (Terra’s dollar-pegged stablecoin) depositors a stable 20% annual percentage yield (APY). In addition, it enables borrowers to collateralize UST loans using bonded LUNA (bLUNA).Funded. pic.twitter.com/NLvnSa0bBu— Do Kwon (@stablekwon) February 18, 2022As a result, the Anchor Protocol creates demand for UST, which, in turn, promises to remove more LUNA tokens out of circulation. That is due to Terra’s economic model, which incentivizes users to mint UST when its value goes above $1 by burning LUNA supply.Terra correlationANC’s upside retracement in January 2022 started primarily in the wake of similar price recoveries across the crypto market but picked up momentum at the end of February while mirroring bullish moves in the Terra (LUNA) market.Notably, the correlation coefficient between ANC and LUNA rose from zero on Feb. 23 to 0.91 on March 3, meaning Anchor Protocol’s price has been more or less mirroring the moves of the Terra blockchain’s native token.ANC/USD daily price chart featuring its correlation with LUNA/USD. Source: TradingViewAs Cointelegraph covered earlier, the upside boom in the Terra market emerged after Luna Foundation Guard (LFG) — a nonprofit organization supporting its blockchain ecosystem, raised $1 billion in a LUNA token sale round to create a so-called “UST Forex Reserve.”In response, LUNA’s price rallied by nearly 90%. ANC also surged under LUNA’s impression, mostly due to its involvement in the Terra ecosystem. The price of MIR, the native token of another Terra-based project, Mirror Protocol, was also up 30% on March 3 when measured from its Feb. 24 low of circa $1.Is ANC overheated?The latest period of buying in the Anchor Protocol market has made ANC excessively valued, according to a key momentum indicator.The readings on the ANC’s daily relative strength index (RSI) came out to be near 80, which makes the token technically “overbought.” Traders typically find opening new upside positions extremely risky when the RSI crosses above 70. Conversely, they prefer to sell the asset to secure interim profits.Related: Rune’s upcoming mainnet launch and Terra (LUNA) integration set off a 74% rallyANC/USD daily price chart featuring RSI. Source: TradingViewIf a selloff ensues, the Anchor Protocol’s next support level appears near $4, coinciding with the 1.0 Fib line of the Fibonacci retracement graph made from $1-swing high to $1.26-swing low. Meanwhile, an additional decline could bring ANC’s 20-day exponential moving average (20-day EMA; the green wave) near $3.14 in focus as the next downside target.More downside could bring ANC’s 20-day exponential moving average (20-day EMA; the green wave) near $3.14 in focus as the next downside target.Conversely, further upside could have ANC bulls target $5.50 as their next resistance level.The views and opinions expressed here are solely those of the author and do not necessarily reflect the views of Cointelegraph.com. Every investment and trading move involves risk, you should conduct your own research when making a decision.

Čítaj viac

Bitcoin a 'good bet' if Fed continues easing to avoid a recession — analyst

Bitcoin (BTC) has the potential to become a “good bet” for investors if the Federal Reserve does everything it can to keep the U.S. economy afloat against impending recession risks, according to popular analyst Bitcoin Jack.The independent market analyst pitted the flagship cryptocurrency, often called “digital gold” by its enthusiasts, against the prospects of further quantitative easing by the U.S. central bank, noting that the ongoing military standoff between Ukraine and Russia had choked the supply chain of essential commodities, such as oil and wheat, resulting in higher global inflation.For instance, consumer prices in Europe jumped 5.8% year-over-year in February compared to 5.1% in the previous month, greater than the median economist forecast of 5.6% in a recent Bloomberg survey. Interestingly, the energy sector was responsible for whipsawing anticipations by recording a 31% rise in prices, way higher than food and services.Similarly, the U.S. consumer price index (CPI) advanced 7.5% year-on-year in January 2022, its highest level in nearly four decades.Jack hinted that the ongoing inflationary risks of the Russia-Ukraine crisis could leave the Fed with two options. First, they could hike interest rates aggressively to bring inflation down, thus raising recession risks. Or, they could continue their quantitative easing program only to burden the economy with higher consumer prices and a lower U.S. dollar purchasing power.”If easing continues, inflation keeps going higher, they [Bitcoin and gold] seem good bets as long as a recession/crash remains avoided,” Jack tweeted March 2, adding: “But if everything crashes, (almost) everything crashes and you buy the phoenixes that rise out of the ashes.”Powell indicates aggressive rate hikesJack’s analogy appeared hours before Jerome Powell, the chairman of the Federal Reserve, confirmed that he would propose a 25 basis point increase in the interest rates in the next Federal Open Market Committee (FOMC) meeting mid-March.Powell noted that the Fed had been assessing the prospect of raising rates consecutively for the rest of 2022. But the recent invasion of Ukraine by Russia has prompted them to “proceed carefully along the lines.”[embedded content]”We’re going to avoid adding uncertainty to what is already an extraordinarily challenging and uncertain moment,” he told the House Financial Services Committee during his testimony on Wednesday.However, Powell did not rule out the possibility of raising interest rates by a half-point percentage if the next CPI readings come any higher than anticipated. Excerpts:”To the extent inflation comes in higher or is more persistently high than that, then we would be prepared to move more aggressively.”Bitcoin’s safe-haven narrative sustainsBitcoin continued its decline after Powell’s remarks, briefly dropping by over 2% to below $43,000 on Thursday. The move downside appeared in contrast to a jump in the U.S. dollar index (DXY), which rose 0.25% in the same period, suggesting that global investors had been rushing to the greenback’s safety against the ongoing economic and geopolitical uncertainty.BTC/USD versus DXY daily price chart. Source: TradingViewAppetite for safe-havens also boosted Bitcoin’s demand earlier this week. On Feb. 28, BTC’s price rallied by a little over 14.50% in a day, registering its biggest one-day increase in a year. An Arcane Research report asserted that Ukrainians seeking “powerful fundraising tools” and Russians trying to circumvent “the strictest capital controls in decades” were behind the BTC price jump.”This speculation may have contributed to the 15% increase in the bitcoin price over the past seven days,” Arcane Research wrote on March 1, adding that BTC/USD could climb to $47,000 next. Similarly, Bitcoin-based investment vehicles attracted $195 million worth of capital inflow month-to-date until Feb. 25, the latest CoinShares report revealed.Another massive #Bitcoin inflow to the Canadian Bitcoin Purpose spot ETF on Tuesday with 1.15k $BTC added to the fund! AUM is now sitting at a new all-time high of 33.5k bitcoin! pic.twitter.com/PuP4vQw0hD— Jan Wüstenfeld (@JanWues) March 2, 2022Related: Billionaire admits he was wrong about Bitcoin as Citadel looks to crypto marketsBut risks of recession kept clouding over Bitcoin’s upside potential. For instance, Brian Coulton, chief economist at credit rating agency Fitch Ratings, anticipated core inflation to remain high throughout 2022, especially as the Ukraine-Russia crisis exacerbated the risks of global price shocks.”If core inflation remains high and inflation expectations rise the Fed, and the BOE could be left with no choice but to quickly move rates to neutral or restrictive levels,” he wrote, adding that it could push the Fed fund rate to 3% by the end of 2022. Excerpts:”US GDP growth could fall to 0.5% or below in 2023 in such a scenario, compared with Fitch’s baseline forecast of 1.9%.”The views and opinions expressed here are solely those of the author and do not necessarily reflect the views of Cointelegraph.com. Every investment and trading move involves risk, you should conduct your own research when making a decision.

Čítaj viac

Solana price eyes $150 as SOL's 25% jump this week puts 'double-bottom' in play

The price of Solana (SOL) may rise by over 45% in the coming weeks as the cryptocurrency intends to complete a double-bottom chart pattern against the U.S. dollar.A $150 SOL ahead?Double-bottoms typically appear at the end of a downtrend when the price falls to a low, rebounds, and returns to the level near the previous low. With bears unable to push the price to a newer low, the selling sentiment exhausts, leading to a sharp upside retracement and a breakout move afterward.SOL has been somewhat painting a similar pattern since Jan. 24, especially after extending its rebound move by rising 25% week-to-date (WTD) to reach above $100. Additionally, a visible bullish divergence between the Solana token’s price and relative strength index (RSI) trends indicates a high probability of a double-bottom breakout. SOL/USD daily price chart featuring double bottom and bullish divergence setups. Source: TradingViewNonetheless, a bullish confirmation might come if SOL’s price breaks above the double-bottom neckline near $120 with a rise in trading volume. As it happens, the Solana token’s upside target could be at length equal to the maximum distance between the double-bottom pattern’s lowest point and its neckline.That would put SOL en route to at least $150, with a possibility of continuing the bullish move toward $170, marked in red in the chart above.Bull trap risksAs double-bottom envisioned SOL at $150 or above, popular market analyst “Capo” warned about a potential bull trap in the Solana market, noting that altcoins, on the whole, would resume their downtrends.The pseudonymous analyst presented $120, the double-bottom neckline, as a solid resistance level that would most likely limit SOL’s ongoing upside retracement. He also applied the popular Elliott Wave Theory to hint about the beginning of Solana’s next bearish wave cycle, as tagged with “c” in the chart below.SOL/USD daily price chart. Source: Capo, TradingView”It’s impossible to me to be bullish here, after the break of all the bullish MS + correctives moves to the upside,” Capo said on March 1, adding: “You can enjoy the LTF pumps while they last, but don’t get too comfy.”The bearish outlook lined up with a CoinShares report published last week showed most altcoin-based investment vehicles witnessing negative investor sentiment, including Binance Coin (BNB), Polkadot (DOT), Cardano (ADA), Ripple (XRP), and Litecoin (LTC).Flow by asset in the week ending Feb. 25. Source: Bloomberg, CoinSharesRelated: Crypto investment funds attract $36M in capital despite market turmoilSolana also suffered as the week ending Feb. 25 saw SOL investment products losing $2.6 million in capital outflows. In contrast, all the digital asset investment products combined attracted $36 million in the same period, with multi-asset portfolios injecting the highest capital — of $14 million, followed by Bitcoin’s 17.3 million.The views and opinions expressed here are solely those of the author and do not necessarily reflect the views of Cointelegraph.com. Every investment and trading move involves risk, you should conduct your own research when making a decision.

Čítaj viac

Získaj BONUS 8 € v Bitcoinoch

nakup bitcoin z karty

Registrácia Binance

Burza Binance

Aktuálne kurzy