Autor Cointelegraph By Yashu Gola

Terra off to new record high as LUNA price outperforms market with 30% rebound in 3 days

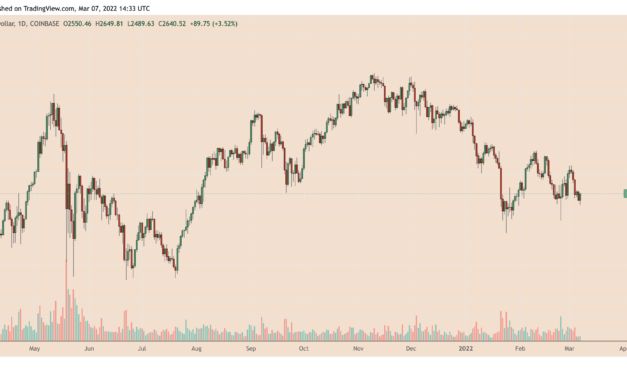
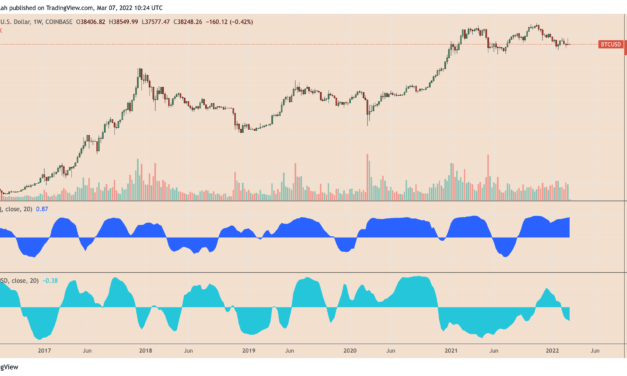
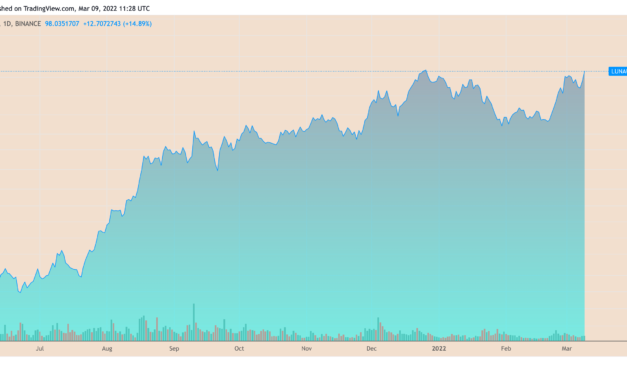
Terra (LUNA) resumed its upward march this week as its price per token rebounded by more than 30% three days.LUNA’s price almost reached $100 on March 9 following a 15% intraday rally, coming near its record high of $106 from December 2021. At its week-to-date (WTD) low, the Terra token was trading at $75.60.LUNA/USD daily price chart. Source: TradingViewOver 120 million LUNA burned alreadyThe recent bout of buying in the Terra market appeared in part due to similar recoveries elsewhere in the crypto market. For instance, Terra’s leading competitor in the smart contracts space, Ethereum, saw Ether (ETH) rising by 13.50% in the same period. Similarly, Bitcoin (BTC) also jumped by over 14% from its WTD low below $37,200.Arthur Cheong, the founder of Defiance Capital, hinted on Wednesday that LUNA price increased because of Terra’s ability to capture at least $1 trillion or more worth of decentralized stablecoin market space via its native U.S. dollar-pegged token, TerraUSD (UST).The total addressable market size for the de-facto decentralized stablecoin is at least a few trillion dollars.$LUNA— Arthur ⛩️ (@Arthur_0x) March 9, 2022Notably, the supply of UST tokens reached over 1.4 billion on Wednesday, its highest level to date, according to data provided by Smart Stake. At the same time, the Terra protocol removed 120 million LUNA tokens from the supply permanently.To recap: LUNA maintains UST’s dollar peg. So, if the stablecoin’s price rises above $1, the Terra protocol burns LUNA and mints more stablecoins. Similarly, if UST’s price falls below $1, LUNA’s valuation declines in tandem due to a slowdown in the burning mechanism. UST versus LUNA supply in the past 30 days. Source: Smart StakeThus, an increasing UST supply likely boosted LUNA’s price rally in addition to the broader recovery in the crypto market.Terra TVL hits all-time highLUNA’s gains also appeared against the backdrop of more capital flowing into the Terra ecosystem.The total value locked (TVL) inside the Terra protocol surged from nearly $18 billion at the beginning of this year to $25.58 billion as of March 9, its highest level to date. This includes a spike in total locked LUNA tokens from 215.80 million to 298.89 million in the same period.Terra total value locked as of March 9, 2022. Source: Defi LlamaTerra also emerged as the highest staked asset among all the cryptocurrencies on a 24-hour adjusted timeframe, with over $35.75 million worth of LUNA tokens now locked across multiple platforms, according to data resource Stakingrewards.What’s next for LUNA price?While LUNA looks poised to establish a new record high this week, its longer-timeframe technical indicators suggest the possibility of downside risk.Related: Ethereum’s TVL dominance drops to 55% as Bloomberg analyst paints $1.7K bearish targetFor instance, LUNA/USD has shown a clear bearish divergence between its rising prices and falling momentum, as indicated by its weekly relative strength index (RSI) — forming lower highs since the beginning of 2021 — in the chart below.LUNA/USD weekly price chart. Source: TradingViewSimilarly, the volumes attached with LUNA’s recent weekly price rally also appeared weaker, further suggesting that the underlying upside momentum could stall. If it happens, LUNA will risk undergoing a sharp pullback to test its exponential moving averages (EMA), primarily the 20-week EMA (~$64) and the 50-week EMA (~38), as supports.The views and opinions expressed here are solely those of the author and do not necessarily reflect the views of Cointelegraph.com. Every investment and trading move involves risk, you should conduct your own research when making a decision.

Čítaj viac

Bitcoin price holds key support level — Can BTC rebound to $43K next?

Bitcoin (BTC) looks poised to test the $43,000 level in March, according to a technical setup shared by Rekt Capital, a pseudonymous market analyst. BTC rebounds from solid 2022 supportBitcoin’s drop toward $37,000 on March 7 was met with modest buying sentiment, leading to a price rebound above $39,000 on March 8. Interestingly, the upside retracement move originated around the same upward sloping trendline serving as an accumulation zone for traders in 2022.Update after 2 months: Too many retail investors on derivative exchanges could be a bearish signal.The good news is that we have some whales who are accumulating $BTC in this price range of 35k-45k lately.Live Chart https://t.co/N7kJnbe06k pic.twitter.com/gK9AtzGoy6— Ki Young Ju 주기영 (@ki_young_ju) March 8, 2022Rekt Capital spotted the successful retest of the trendline in his latest outlook, noting that the move could have Bitcoin climb above $43,100 next, providing it breaks above the green dashed diagonal resistance as shown in the chart below.BTC/USD weekly price chart. Source: Rekt Capital, TradingView”Successful retest here and BTC could actually repeat last week’s move,” commented Rekt Capital on March 8.Bitcoin to $30K?The interim bullish outlook appeared as Bitcoin remained stuck inside a wide trading range — between $34,000 and $45,000 — all across Q1/2022. In doing so, BTC withstood extreme selloff pressure leveled up by the ongoing macroeconomic and geopolitical concerns, including rate hike fears and the military conflict between Russia and Ukraine.$BTC– Sideways — 32-34k key support, 43-47k key resistance– Headline algo trading + correlation chop in between– Mid-term bull. momentum case validated if 43-47k finally breaks (tested several times)– Sideways = wait for extremes/boundaries to trade, not there yet pic.twitter.com/RsytMYajWf— DonAlt (@CryptoDonAlt) March 8, 2022

Filbfilb, the cofounder of trading suite DecenTrader, also noted last weekend that “Bitcoin is rangebound on a macro level,” but its long-term structure suggests that it would break to the upside.”In the immediate term, if the 50 DMA and 3-day level can prove to be supported, a retest of the $43K and high timeframe level could occur,” said Flibflib, adding that a further break above Bitcoin’s yearly pivot level of $48,000 would be “very significant and implicit of a fundamental change.”BTC/USD four-hour price chart. Source: Decentrader, TradingViewBut Rekt Capital’s upside setup revealed little possibility of Bitcoin extending its rebound toward $48,000. That is because the setup resembles a bearish “ascending triangle” pattern, a consolidation range that typically sends the price further lower after its breakout move.Notably, the profit target of an ascending triangle is calculated by measuring the maximum distance between the pattern’s two trendlines and by subtracting that from the breakout level. The chart below assumes the breakout point to be anywhere between $37,500 and $45,000, meaning that a successful break below the triangle range could have Bitcoin drop to between $30,000 and $35,000.BTC/USD daily price chart featuring ascending triangle breakout targets. Source: TradingViewInterestingly, both $30,000 and $35,000 had acted as solid support levels in recent history.BTC bottoming out?Flibflib also highlighted the $30,000-level for coinciding with the bottom of Bitcoin’s logarithmic regression bands — a “tried-and-tested” support level.Related: Bitcoin heading to 36K, analysis says amid warning global stocks ‘look expensive’”The good news is that Bitcoin has less far to fall because it did not run up quite as hard,” the analyst asserted, adding: “The confluence with this now sitting at the bottom of the weekly range is significant in our opinion and supports the idea that we will not see such a drawdown as in previous cycles.”BTC/USD 3D chart featuring yearly pivots and log growth curve. Source: TradingView, DecenTrader Nonetheless, an aggressive capitulation event near the $30,000-level could have Bitcoin fall refresh its downside target to the 200-week simple moving average (200-week SMA), a “catch-all level” marking the end of previous bearish cycles in March 2020 and December 2018.The 200-week SMA sits around $20,000.The views and opinions expressed here are solely those of the author and do not necessarily reflect the views of Cointelegraph.com. Every investment and trading move involves risk, you should conduct your own research when making a decision.

Čítaj viac

Ethereum's TVL dominance drops to 55% as Bloomberg analyst paints $1.7K bearish target

Another big drop in the U.S. stock market could leave Ethereum’s native token Ether (ETH) in a similar downside spell, according to the latest Bloomberg report on digital assets.Ethereum faces global recession risksMike McGlone, the senior commodity strategist at Bloomberg Intelligence, anticipates U.S. equities to face downside pressure against the prospects of the ongoing energy-price spikes and their ability to invoke a 2008-like global market recession”The war in Ukraine and spiking crude make a potent combination for a global recession,” wrote McGlone in the report, adding that top cryptocurrencies like Bitcoin and Ether could also face initial pressures.WTI crude oil weekly price chart. Source: TradingViewCorrelations between U.S. stock indexes and top cryptocurrencies have only increased during the ongoing global market rout and Ukraine-Russia conflict. In particular, Ether’s correlation efficiency with tech-heavy Nasdaq 100 rose to 0.93 four days after Russia invaded Ukraine but has since corrected to 0.67. An absolute value of 1 means the two assets move perfectly in tandem. ETH/USD daily price chart featuring its correlation with Nasdaq 100. Source: TradingViewMcGlone spotted Ether trading in the middle of a range defined by its 100-week exponential moving average (100-day EMA; the red wave in the chart below) near $6,000 and its 30-week EMA (the green wave) near $2,000. He also expects significant selling pressure at the interim resistance level of $4,000.ETH/USD weekly price chart. Source: Bloomberg Intelligence”Our graphic depicts Ethereum at about the middle of the range,” the strategist wrote, asserting that “if the stock market takes another leg lower, Ethereum is more likely to revisit the lower end” near $2,000. He added:”If equities drop fast, Ethereum could repeat last summer and revisit about $1,700.” Ethereum TVL share drops to record lowsThe latest data shows that Ethereum’s market dominance is also giving up ground to competitors like Cardano (ADA), Solana (SOL), Avalanche (AVAX), and Terra (LUNA).The share of the total value locked (TVL) on the Ethereum network declined below 55%, its lowest level on record, from 97% at the start of 2021, according to data from DeFi Llama. Share of total value locked by chain. Source: Defi Llama, Galaxy Digital ResearchTom Dunleavy, a researcher at Messari, notes that new layer-one blockchains are comparatively “faster, cheaper, or provide a more attractive reward structure” than Ethereum. Nonetheless, he adds that completely overtaking Ethereum and Ethereum Virtual Machine (EVM), a software platform to create decentralized applications (DApps), would be hard due to first-mover advantage.”The EVM’s advantage has been so great that major competitors use or bridge to the EVM, rather than try to compete head-to-head without this capability,” Dunleavy wrote, adding: “Even competitors that held out like Solana and Cardano have recently added or are adding EVM compatibility (Terra being the notable exception). In many cases, the EVM has already cemented itself through its network effects.”But most of the so-called “Ethereum killers,” except Terra, have fared far worse so far in 2022 when faced with geopolitical conflicts, energy crises, and rate hike risks. For instance, Solana and Cardano dropped by more than 50% year-to-date versus Ether’s 30% price decline. Avalanche price dropped by 37% in the same period.Can Ethereum regain market share? Not everyone expects Ethereum’s TVL market share downtrend to continue, however. Marcus Sotiriou, an analyst at GlobalBlock, anticipates Ethereum to regain its dominance as it switches to proof-of-stake later this year from its current proof-of-work protocol.”This is because it should dramatically reduce the cost of transactions on the Ethereum network, which is currently Ethereum’s main drawback,” he told Business Insider earlier this month. As of now, Ethereum works on a surge-pricing model, leading to highly volatile transaction fees.In August 2021, the network underwent a so-called “London hard fork” that employed a key EIP-1559 protocol. In particular, the EIP-1559 allows the Ethereum protocol to burn gas fees, meaning that a portion of Ether’s supply goes out of circulation permanently. Related: Buyback-and-burn: What does it mean in crypto?”Bitcoin and Ethereum remain in early adoption days, with increasing demand vs. declining supply and related price implications,” explained McGlone, adding: “Our bias is why complicate it — unless something unlikely reverses the proliferation of the nascent technology, prices should rise.”The strategist also anticipates that Ether’s correlation with the U.S. stock market will also decrease due to to so-called “declining relative risk.” Ethereum volatility vs. the Nasdaq. Source: Bloomberg Intelligence”Closer to 3x now, the relative risk of the nascent technology/asset is poised to keep falling, particularly if the war increases recession risks and stock market volatility,” he asserted.The views and opinions expressed here are solely those of the author and do not necessarily reflect the views of Cointelegraph.com. Every investment and trading move involves risk, you should conduct your own research when making a decision.

Čítaj viac

Ethereum risks crashing under $2K as ETH paints bearish 'symmetrical triangle' — analyst

Ethereum’s native token Ether (ETH) will likely fall below $2,000, according to one popular market analyst.Ether paints a classic bearish continuation setupPseudonymous market analyst Wolf shared the downside outlook on March 7 as Ether’s price rebounded by over 3% to nearly $2,650, a day after testing its upward sloping trendline near $2,500. Ignoring the intraday upside reversal, Wolf anticipated the Ether’s decline to continue further.ETH/USD daily price chart. Source: TradingViewAt the core of Wolf’s analogy was a “symmetrical triangle,” a classic technical analysis pattern that forms when the price fluctuates between two converging trendlines. In a “perfect” scenario, the price breaks out of the triangle range in the direction of its previous trend. For the same reason, many analysts call symmetrical triangles a continuation pattern.Ether has been bouncing inside a symmetrical triangle pattern since the beginning of this year. ETH had fallen by more than 50% after topping out in November 2021 at above $4,850. As a result of the “continuation” rule, ETH’s triangle pattern appears to be skewed toward the bears.ETH/USD daily price chart featuring symmetrical triangle setup. Source: TradingViewIn other words, the price can fall by as much as the maximum distance between the triangle’s upper and lower trendline after breaking out of the pattern. As a result, Ether’s decisive move below the Triangle support — if accompanied by a spike in volume — could have it test levels below $2,000 as the next downside target.”Bulls will try to defend long time diagonal, bears will try to push price to $1.8 thousand–1.9 thousand,” Wolf wrote.ETH accumulation continuesWolf’s bearish outlook for Ether came despite a recent uptick in ETH’s accumulation by its richest investors.Ethereum addresses, which hold between 1 million and 10 million Ether, have accumulated 2.2% of the total ETH supply minted in the past six months, according to data from Santiment. Moreover, the buying spree coincided with ETH’s price correction, suggesting they had been buying the dip.Ethereum supply distribution. Source: SantimentRetail traders also entered the Ethereum market during the recent Ether price correction, according to data from Glassnode. For instance, the number of Ethereum addresses that hold at least 0.1 ETH reached an all-time high of 6.972 million on March 7. Similarly, addresses with a minimum balance of 0.01 ETH also climbed to a record high of 21.8 million.Ethereum number of addresses with balance of at least 0.1 ETH. Source: GlassnodeOn the flip side, the number of addresses holding at least 1 ETH reached an all-time high of 1.42 million on Feb. 10, but has since decreased to 1.41 million. Related: Whales’ stablecoin buying power grew over 7% in one month: Here’s what it meansBut many analysts remain bullish on Ether, citing the upcoming transition to proof-of-stake from proof-of-work this year. For instance, Marcus Sotiriou, GlobalBlock market analyst, noted that upgrade would have a “positive impact” on Ether’s price in the long term.”This is because it should dramatically reduce the cost of transactions on the ethereum network, which is currently Ethereum’s main drawback,” he told Business Insider.The views and opinions expressed here are solely those of the author and do not necessarily reflect the views of Cointelegraph.com. Every investment and trading move involves risk, you should conduct your own research when making a decision.

Čítaj viac

3 reasons why Bitcoin can rally back to $60K despite erasing last week's gains

Bitcoin (BTC) plunged to below $38,000 on Monday, giving up all the gains it had made last week, which saw BTC/USD rally over $45,000.BTC back below $40K as oil soarsThe losses appeared primarily in part due to selloffs across the risk-on markets, led by the 18% rise in international oil benchmark Brent crude to almost $139 per barrel early Monday, its highest level since 2008. Nonetheless, Bitcoin’s inability to offer a hedge against the ongoing market volatility also raised doubts over its “safe haven” status, with its correlation coefficient with Nasdaq Composite reaching 0.87 on Monday.BTC/USD weekly price chart featuring its correlation with Nasdaq and Gold. Source: TradingViewConversely, Bitcoin’s correlation with its top rival gold came to be minus 0.38, underscoring they have been largely moving in opposite to one another during the ongoing market turmoil. Keeping an open mind about crypto, but given the inflating US dollar and the stark reminder that governments can and will under certain circumstances freeze accounts and block payments, wouldn’t you think crypto would be having a moment now? Not seeing it in the price, so far….— Lloyd Blankfein (@lloydblankfein) March 7, 2022On one hand, Bitcoin’s potential to continue its decline remains high amid the worsening geopolitical conflict between Russia and Ukraine and prospects of higher rate hikes in March. Nevertheless, some technical and on-chain indicators are flashing bullish on lower timeframes, suggesting a potential price rebound towards $60,000 in the months ahead.Multi-year ascending trendline supportIf history repeats, Bitcoin’s recent decline to its multi-year ascending trendline support could set the stage for a potential rebound toward the $60,000 resistance level.BTC/USD weekly price chart featuring bear markets within technical patterns. Source: TradingView Notably, BTC’s trendline support constitutes a technical pattern called ascending triangle in conjugation with a horizontal resistance level above. This setup has been active since December 2020, with the lower level serving as an accumulation area and the upper level acting as a distribution area for traders.Number of BTC whales on the riseElsewhere, on-chain data provided by CoinMetrics indicate that rich investors have been purchasing Bitcoin near the same level.For instance, the number of Bitcoin addresses that hold at least 1,000 BTC spiked from 2,127 on Feb. 27 to 2,266 on Feb. 28.Bitcoin addresses with balance greater than 1K BTC. Source: CoinMetrics, MessariIn the same period, BTC’s price climbed from near $38,000 to almost $45,000. As of March 6, the number of Bitcoin addresses was down to only 2,263 even as BTC dropped below $38,000, suggesting rich investors decided to hold their Bitcoin tokens despite the interim downside sentiment.Related: Digital gold narrative valid as long as MicroStrategy holds Bitcoin, says execJohal Miles, an independent market analyst, further noted that the area between $33,000 and $38,000 has been a “high volume accumulation zone” for Bitcoin bulls, adding that it would be “tough for bears” to pull through the said range.Bitcoin currently resting on the entire range point of control.High volume accumulation zone, a tough order for bears to push through this. Best of luck to them.$BTC pic.twitter.com/0LWgPFMiR5— Miles J Creative (@JohalMiles) March 6, 2022

Bitcoin outflow trend intactData from crypto analytics service Santiment shows that the Bitcoin weekly outflow from exchanges has been positive 81% of all time since October 2021, even as BTC trades near its six-month low.”Interestingly, 21 of the past 26 weeks saw BTC moving more off of exchanges than on to exchanges,” Santiment tweeted Monday, citing the BTC exchange flow balance chart attached below.BTC exchange flow balance. Source: SantimentMore Bitcoin outflow from exchanges suggests investors are looking to hold for the longer term. Conversely, increasing Bitcoin inflows to exchanges shows intention to trade BTC for other digital assets or fiat currencies.BTC exchange reserve. Source: CryptoQuantOverall, the amount of BTC on exchanges continues to decrease with less than 2.4 million BTC currently sitting on crypto exchanges, the lowest since September 2018, according to CryptoQuant. The views and opinions expressed here are solely those of the author and do not necessarily reflect the views of Cointelegraph.com. Every investment and trading move involves risk, you should conduct your own research when making a decision.

Čítaj viac

Získaj BONUS 8 € v Bitcoinoch

nakup bitcoin z karty

Registrácia Binance

Burza Binance

Aktuálne kurzy