Autor Cointelegraph By Yashu Gola

Avalanche price can double by summer as AVAX's 20% weekly rally rekindles 'bull flag'

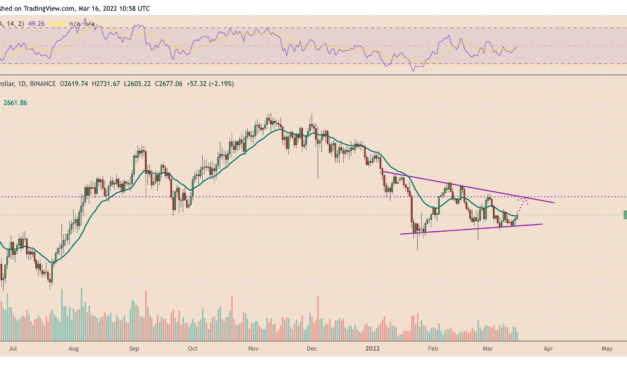
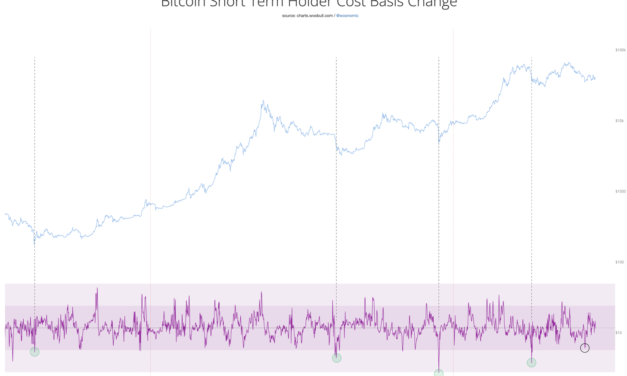
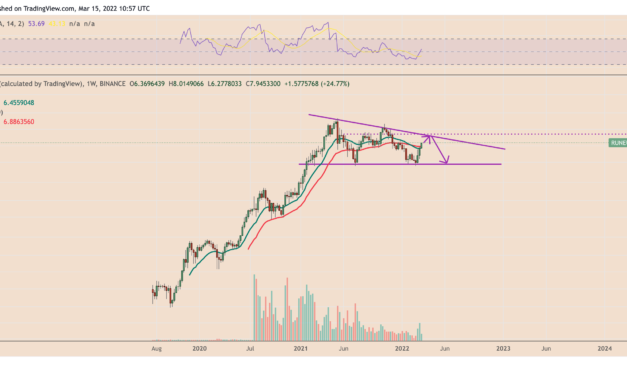
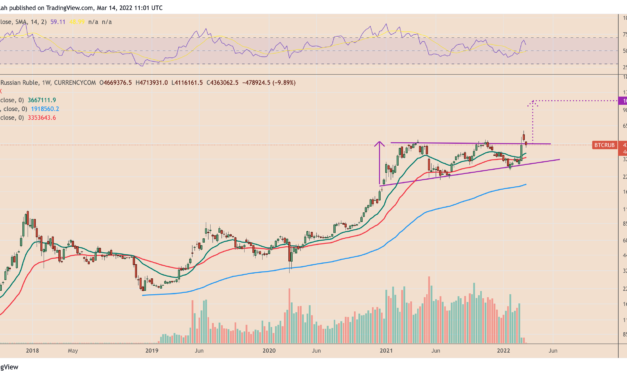
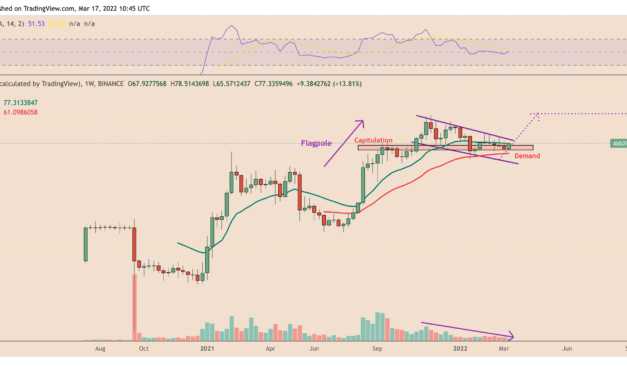
A sharp upside retracement in the Avalanche (AVAX) market this week has raised its possibilities to rise by another 100% in Q2.Avalanche chart painting a ‘bull flag’The bullish outlook primarily appears in the wake of AVAX’s multi-month bull flag setup, which formed after a strong price move higher to over $150, an all-time high in the Avalanche market. In detail, the setup is a downward sloping channel, denoted by two parallel trendlines against the previous trend, with volumes declining to underscore a weakening downtrend.AVAX/USD weekly price chart featuring ‘bull flag’ pattern. Source: TradingViewIn a perfect scenario, bull flags resolve with a breakout move above their upper trendlines, followed by an extended uptrend, with the profit target at length equal to the size of the underlying asset’s previous uptrend (also called flagpole).That could have AVAX’s price to undergo a similar upside move in the coming weeks, beginning with a close above its interim resistance of 20-week exponential moving average (20-week EMA; the green wave in the chart above) and later with a breakout above the flag’s upper trendline.As a result, AVAX may eye a run-up towards $157, up more than 100% from its current prices near $77.AVAX price downside risksThe latest bout of buying in the Avalanche market has appeared largely due to its strong positive correlation with Bitcoin (BTC).Notably, AVAX and BTC were moving in tandem almost perfectly at the beginning of 2022, with their correlation coefficient coming out to be between 0.90 and 0.99. However, as of March 17, the reading had corrected to around 0.79, still underscoring Avalanche’s continued preference of mirroring the benchmark cryptocurrency’s moves.AVAX/USD and BTC/USD daily price chart featuring their correlation coefficient. Source: TradingViewNonetheless, the correlation exposed AVAX to the same downside risks that Bitcoin has been facing since November 2021, including Federal Reserve’s quantitative tightening and the ongoing Ukraine-Russia conflict.On March 16, Fed’s chairman Jerome Powell said that the U.S. economy is strong enough to bear higher interest rates as he announced the central bank’s first rate hike since 2018. Meanwhile, Joel Kruger, a strategist at crypto exchange LMAX Digital, noted that the central banker’s hawkish tone could pressure Bitcoin into falling further away from its all-time high of $69,000.”Rates going higher will strangle equity markets. So if we see a mass exodus out of risk assets, it’ll weigh on everything,” he told Bloomberg, stressing that Bitcoin could fall to $20,000, thus contributing “to a decline in crypto assets.”Related: Avalanche aims to accelerate subnet adoption with multiverse incentive programAs a result, AVAX’s bullish outlook risks invalidation as long as it tails Bitcoin’s price accurately. That could mean a potential price pullback from its interim resistance level of around $80, coinciding with the 0.618 Fib line of the Fibonacci retracement graph drawn from $9-swing low to $152-swing high.AVAX/USD daily price chart. Source: TradingViewIf the correction occurs, AVAX’s next support line appears at the 0.786 Fib line around $64.The views and opinions expressed here are solely those of the author and do not necessarily reflect the views of Cointelegraph.com. Every investment and trading move involves risk, you should conduct your own research when making a decision.

Čítaj viac

3 reasons why Ethereum price can still retest $3K this month

Ethereum’s native token Ether (ETH) could reach back to $3,000 in March, backed by a mix of short-term technical, fundamental, and on-chain catalysts.ETH price paints “symmetrical triangle”The first interim bullish outlook for Ether ironically comes from a bearish continuation patternNotably, ETH’s 50%-plus decline from its all-time high of around $4,650 on Dec. 2, 2021, followed up with forming a consolidation channel called a symmetrical triangle. Hence, the Ethereum token has been fluctuating between a falling upper trendline and a rising lower trendline since the beginning of this year.ETH/USD daily price chart featuring symmetrical triangle. Source: TradingViewETH/USD last retested the triangle’s lower trendline as support on March 14 near $2,500, following a sharp correction after finding sellers near the 20-day exponential moving average (20-day EMA; the green wave in the chart above). Since then, ETH’s price has rebounded by as much as 9.26%, closing above the 20-day EMA resistance on March 16 to reach almost $2,750. A decisive rebound move, accompanied by a rise in trading volumes, could have Ether eye the triangle’s upper trendline as its next upside target near $3,000.The Merge On March 15, Ethereum developer Tim Beiko announced that they have successfully tested the “Merge” on the Kiln testnet, raising speculations that the protocol would completely switch from proof-of-work (PoW) to proof-of-stake (PoS) in Q2/2022. And it seems to have worked Post-merge blocks are being produced by validators, and they contain transactions! https://t.co/xearnsuZFpJust waiting on finalization now https://t.co/BEfJOI4qqj pic.twitter.com/c4p1UXB5vw— Tim Beiko | timbeiko.eth (@TimBeiko) March 15, 2022The euphoria around the Merge has acted as one of the main bullish prospects behind Ethereum’s growth since the introduction of its first consensus layer upgrades in December 2020. Arcane Research noted in its latest weekly report that a total of 312,000 validators staked 10 million ETH on the Merge — also called Ethereum 2.0 — smart contacts. That amounts to nearly $26 billion worth of Ether, more than 8% of its total circulating supply, now locked away. The prospects of more Ether going out of circulation, coupled with hopes of higher demand, have pushed its price up by nearly 360% from its December 2020 low of around $525 to date.Lito Coen, the founder of Crypto Testers, a product comparison platform, anticipates Merge’s launch to have Ethereum’s daily emission rate slashed from 12,000 ETH a day to 1,280 a day, noting that the network’s “yearly inflation will go down from 4.3% to 0.43%” — equivalent of three Bitcoin halvings. Ethereum supply growth. Source: Lito Coen”And the 0.4% inflation figure is without taking into account the automated ETH burn introduced by EIP-1559 ($5b burnt since launch) taking ETH burn into account Ethereum will be deflationary,” Coen wrote.Positive divergence between utility and pricesA bullish divergence between Ethereum’s daily active addresses (DAA) and ETH’s price is also emerging, according to data from analytics platform Santiment.Notably, Ethereum’s DAA fell but not as much as the prices, which dropped about 35% in the past four months. That indicated that users continued to interact with the Ethereum network for reasons beyond speculation and trading.Related: How professional Ethereum traders place bullish ETH price bets while limiting lossesETH active addresses divergence remains in the area where prices historically rise,” noted Santiment, while citing the chart below.Ethereum DAA-price divergence. Source: Santiment”This is a vote of confidence in Ethereum and a statement that it’s here to stay (and grow),” said Michael Pearl, COO of dapp developer Kirobo, adding that its growth in the DeFi space would boost ETH’s price even beyond $3,000.The views and opinions expressed here are solely those of the author and do not necessarily reflect the views of Cointelegraph.com. Every investment and trading move involves risk, you should conduct your own research when making a decision.

Čítaj viac

Bitcoin risks final 'bear market capitulation' as rich investors continue BTC selloff — analyst

Bitcoin (BTC) could undergo one last bear market capitulation if “whales” — addresses that hold more than $1 million worth of Bitcoin — ramp up their selling pressure, according to on-chain analyst Willy Woo.Room for another Bitcoin drop?Woo assessed the average price at which short-term investors entered the Bitcoin market across history and charted the daily change in the value. That resulted in a cost basis, a metric that signals when “inexperienced” traders sell BTC to “experienced” traders during a BTC free fall, which typically coincides with the market bottom.The cost basis underwent significant dips during the previous bear markets, also before strong accumulation took place, as shown in the chart below. Interestingly, Bitcoin’s ongoing correction — from $69,000 in November 2021 to around $39,000 in March 2022 — has not resulted in a massive drop in its cost basis.Bitcoin short-term holder cost basis change. Source: Willy Woo”It’s inconclusive whether we have capitulated yet,” said Woo, adding that “there’s room for another drop” based on the cost basis signal.Whales have been selling their BTCWoo’s outlook appeared in line with the rising speculations about Bitcoin’s next big drop. For instance, Christopher Yates, the editor at AcheronInsights, said BTC’s price could crash to $30,000 due to the “deteriorating macro environment.””What makes me increasingly wary that the low is not yet in for 2022 is the fact that we are yet to see a capitulation style spike in volume that has occurred at all the recent lows in late 2019, early 2020, and mid-2021,” Yates wrote in his latest BTC analysis, adding: “Though not a prerequisite for a market bottom, such a capitulation-like spike in volume helps to give us confidence for when such a bottom may be near.”Data resource Ecoinometrics provided evidence of the demand gap between small and rich Bitcoin investors in its latest weekly report. For example, it noted that addresses that hold as much as 10 BTC have been accumulating the coins in the past 30 days.Bitcoin on-chain accumulation and distribution. Source: EcoinometricsConversely, those that hold more than 10 BTC have been distributing them.Woo also noted that Bitcoin whales have been selling off their stash, thus maintaining the downward pressure on price. That means small investors have been absorbing the sell-side pressure, and so far preventing Bitcoin price from dipping below $30,000.Additionally, Ecoinometrics analyst Nick, noted that the ongoing accumulation trend is “as sluggish as it gets,” adding that it could grow weaker after the Federal Reserve’s expected rate hike in March to tame rising inflation. Excerpts:”To summarize, the Fed is in control. If they mess up their tightening cycle, all risk assets will tank. Bitcoin currently trades like a risk asset, so it is unlikely to be an exception.”Ecoinometrics and Willy Woo’s analysis also show that inexperienced investors have not been dumping their coins, thus becoming long-term holders (LTH) in the process. Bitcoin is “most deflationary” in historyMeanwhile, another metric dubbed “LTH Inflation/Deflation ratio” is also corroborating the aforementioned theory, according to ARK Invest on-chain analyst David Puell. In detail, Bitcoin inflation points to LTH releasing their BTC into circulation faster than the natural sell-side of miners. Conversely, deflation suggests that LTHs have absorbed a proportional amount of the miner sell-side every day alongside the outstanding total supply.Related: Crypto vs. physical: Musk-Saylor inflation debate boils down to scarcityThe attached chart below shows the LTH Inflation/Deflation ratio showing the period of inflationary outcomes flashed in red and deflationary readings in green.Bitcoin LTH market inflation/deflation ratio. Source: ARK, Glassnode”Our analysis suggests that Bitcoin, proportional to supply held by long-term holders (LTH), is at its most deflationary in history,” noted David Puell, an on-chain researcher at ARK Invest.The views and opinions expressed here are solely those of the author and do not necessarily reflect the views of Cointelegraph.com. Every investment and trading move involves risk, you should conduct your own research when making a decision.

Čítaj viac

THORChain quietly outperforms crypto market in Q1 — Can RUNE price break $10 next?

THORChain (RUNE) could continue its upward momentum in the coming weeks even as it treads inside a classic bearish reversal structure.RUNE’s price has rebounded strongly by over 165% four weeks after testing its multi-month horizontal level support near $3.15. What’s more, its upside retracement has opened up possibilities about an extended bull run toward $11.50, about 45% above the current price level near $7.89, as shown in the chart below.RUNE/USD weekly price chart featuring descending triangle setup. Source: TradingViewThe $11.50-level coincides with RUNE’s multi-month falling trendline resistance, forming a descending triangle, a bearish setup, in conjunction with the lower horizontal support. That could have RUNE’s price correct again to $3.15 after reaching $11.50, followed by another breakout to the downside.A long-term bullish setup, meanwhileAdjusting RUNE’s lower horizontal trendline in the descending triangle setup hints at restructuring the pattern into a symmetrical triangle.A Symmetrical triangle is a continuation pattern, meaning they typically send the price in the direction of its previous trend after a period of consolidation. In doing so, the triangle’s ideal profit target comes to be at length equal to the maximum distance between its upper and lower trendline.RUNE/USD weekly price chart featuring ‘symmetrical triangle’ setup. Source: TradingViewThat puts RUNE en route to between $30 and $80 in 2022, depending on its breakout point.THORChain’s fundamentals skewed towards bullsThe mixed outlook in the THORChain market appears as the entire crypto market trades under geopolitical and macroeconomic risks. Notably, the market capitalization of all the cryptocurrencies combined has fallen by nearly 25% year-to-date (YTD). RUNE has so far bucked the trend, rising nearly 9% YTD. Interestingly, the THORChain token has secured most of its gains in the past 30 days, gaining over 100% owing to the hype surrounding its back-to-back feature updates.For starters, THORChain rolled out “synthetic assets” on March 10,  a feature that enables users to trade tokens backed by 50% of their target assets and 50% of RUNE. In addition, the protocol allows traders to redeem the synthetic assets for the real ones at 1:1.@THORChain just hit $20m daily volume in synths, hasn’t even been launched a week.$RUNE has a bright future— Harry.UST (@CryptoHarry_) March 15, 2022Related: Rune’s upcoming mainnet launch and Terra (LUNA) integration set off a 74% rallyMeanwhile, THORChain core developer Chad Barraford also revealed that he expects the launch of Thorfinance (Thorfi) — a protocol integrating DeFi tools, such as lending and borrowing, into the THORChain ecosystem — by June 17.The revelation also included a proposal to build a native stablecoin called THOR.D, employing Terra’s burn-and-mint tactic featuring its native token LUNA and stablecoin UST.TLDR: Huge alpha is being dropped in this Twitter space by @CBarraford about Thorfinance (Thorfi). Target release for Thorfi is on June 17th. Thorfi will burn $RUNE, effectively making $RUNE deflationary as the THOR.USD stablecoin is adopted. https://t.co/uYJQA60vsg— AltcoinAsian⚡️ (@Asian0xV) March 11, 2022

The optimistic updates focusing on RUNE’s adoption could provide additional tailwinds to its interim technical price target near $11.50. The views and opinions expressed here are solely those of the author and do not necessarily reflect the views of Cointelegraph.com. Every investment and trading move involves risk, you should conduct your own research when making a decision.

Čítaj viac

Bitcoin could crush Russian ruble by rising another 140%, classic technical setup suggests

Bitcoin (BTC) has declined by around 30% after topping out at 5.8 million rubles a token on March 9. Nonetheless, the said drop could be an excuse for traders to dump another big stash of the Russian national currency if a classic bullish continuation pattern plays out.Bitcoin heads towards 11 million rublesDubbed the “ascending triangle,” the pattern appears when the price consolidates between a rising lower trendline (support) and a flat upper trendline (resistance). It completes after the price breaks out of the consolidation range in the direction of its previous trend, eyeing levels at length equal to the maximum distance between the triangle’s upper and lower trendline.BTC’s price against the ruble has been trending inside a similar structure since January 2021, as shown in the chart below. It closed above the triangle’s upper trendline, rising more than 20% to its all-time high of 5.88 million rubles. BTC/RUB weekly price chart featuring “ascending triangle” setup. Source: TradingViewNonetheless, BTC corrected to test the range’s resistance as support, a common sight following breakouts as traders seek confirmation of the pattern with more upside. If this is the case, the likelihood of rebounding and continuing toward 11 million rubles appears high in the future, an almost 140% rise.Russia’s capital controlsThe technical bullish outlook for the BTC/RUB market also comes amid an ongoing exodus from Russian assets since Russia’s invasion of Ukraine, as western nations have collaborated to damage the country’s ties with the global banking system.As a result, Moscow Exchange has suspended trading from Feb. 28 until further notice. Similarly, shares of Russia-backed companies abroad have suffered, with an MSCI index tracking their exchange-traded funds reporting nearly a 78% outflow since the invasion began on Feb. 24.Related: Ally or suspect? The war in Ukraine as a stress test for the crypto industryiShares MSCI Russia ETF weekly price chart. Source: TradingViewAs of March 7, the ruble had tumbled by more than 50% year-to-date against the U.S. dollar, its biggest decline since 1998 when Russia defaulted on its debt. The Russian central bank intervened through a sequence of capital control measures, including a ban on foreign currency sales for six months.The views and opinions expressed here are solely those of the author and do not necessarily reflect the views of Cointelegraph.com. Every investment and trading move involves risk, you should conduct your own research when making a decision.

Čítaj viac

Získaj BONUS 8 € v Bitcoinoch

nakup bitcoin z karty

Registrácia Binance

Burza Binance

Aktuálne kurzy