Autor Cointelegraph By Yashu Gola

Ethereum Classic up 75% in 8 days, but will ETH miners migrate after ETC ‘fifthening’?

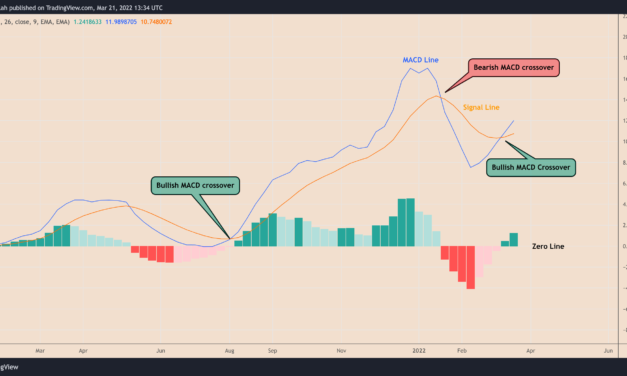
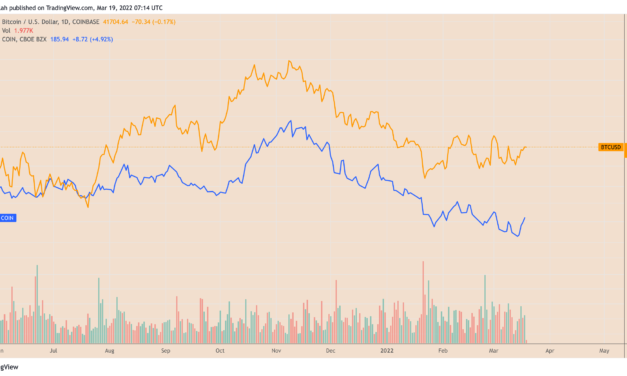
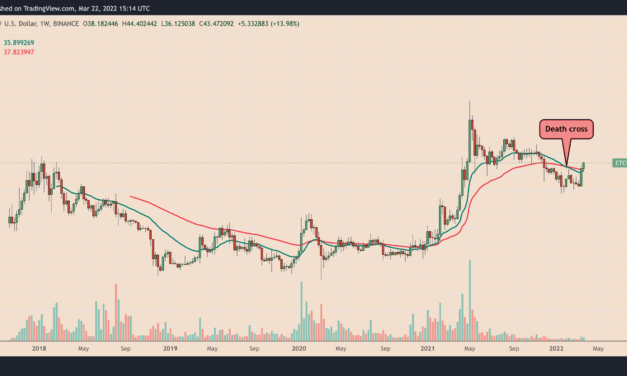
Ethereum Classic (ETC) price climbed on March 22, ignoring a deadly “death cross” on the weekly chart, as traders raised their bets on its potential to become a haven for miners fleeing the rival Ethereum blockchain. ETC’s price jumped over 15.5% to reach $44 a token for the first time since Dec. 9, 2021. The coin’s intraday gains came as a part of a broader rebound move that saw its price rallying more than 75% eight days after bottoming out near $25.ETC/USD daily price chart. Source: TradingViewMost of ETC’s course to the upside saw it tracking general crypto market trends. For instance, the Ethereum Classic token showed an extremely higher correlation with Bitcoin (BTC), the leading cryptocurrency by market cap, reaching 0.98 on multiple occasions.A correlation coefficient reading of 1 between the two assets show that they move completely in lockstep. ETC/USD versus BTC/USD correlation coefficient. Source: TradingViewBut ETC’s 75%-plus gains in the last eight days largely outperformed BTC’s 15.5% returns in the same period. That may have to do with speculations about Ethereum Classic’s ability to attract miners from its rival Ethereum.A “viable alternative” to Ethereum miners?Ethereum Classic, however, failed to attract as many users by comparison, leaving the network in the hands of few miners. This resulted in a double spend attack worth $1 million on Coinbase in January 2019 and other instances of 51% attacks on the network.In December 2020, Cardano founder Charles Hoskinson later announced that his firm, IOHK, initiated the Mantis project to upgrade Ethereum Classic and support its community. Last year, the cooperative noted that “Ethereum’s move to Proof-of-Stake and Sharding may disrupt many in the community who prefer PoW and a strong base-layer approach to blockchain security,” adding:”This is where #EthereumClassic becomes a viable alternative for #Ethereum projects to migrate to.”As ETC rallies in March, the hash rate has not risen to new all-time highs, suggesting that miners aren’t jumping over just yet. Nevertheless, social media has started to take up the miner exodus mantra, as shown in the tweets below.#EthereumClassic ( $ETC) is trading higher by 11.73% in the last 24 hrs. ETC is rising because its tech. indicators turned bullish on 3/18. Also, $ETH will go #PoS in few months, hence #ETC stands to benefit from increased hashrate and security, as miners look for alternatives.— Weiss Crypto (@WeissCrypto) March 22, 2022#EthereumClassic $etc is becoming extremely profitable to mine. The miners recognize this, and they are porting over to #etc in mass. #bitcoin— ETC Sage Capital (@EtcSage) March 20, 2022

No. Miners are not switching over….yet. So calm down. But when they do, the real fireworks start. $ETC pic.twitter.com/l07yFPL56a— BreakoutRob.ETC (@BreakoutRob) March 21, 2022

And that ETC block reductionETC’s price also surged in the run-up to its third block reward reduction, or “fifthening,” expected to arrive on April 15, 2022 at block 15,000,000.In detail, the Ethereum Classic’s block rewards get cut periodically by 20% every five million blocks (roughly every 2.5 years), following the improvement proposal ECP-1017, launched in 2017. The last of such events occurred on March 16, 2020, which followed up with ETC rising by more than 350% to date.We pumping the markets because ETC halving in 40 days? pic.twitter.com/dah4P3YeU4— 50Sats – maintain your pride (@stacksats42069) March 22, 2022

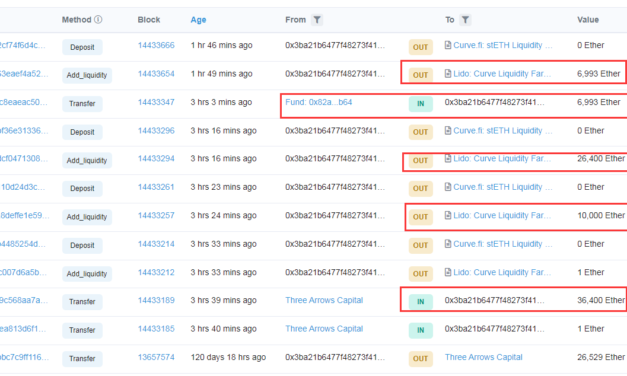
Related: ETH price hits $3K as major crypto fund adds over $110M Ethereum to Lido’s staking poolTechnically, ETC appears oversold due to its daily relative strength index rising above 70, a sell signal. The ETC/USD pair now tests $44 as its interim resistance, a level with a history of acting as a strong support between July 2021 and December 2021. ETC/USD daily price chart. Source: TradingViewAs a result, ETC may correct towards its 200-day exponential moving average (200-day EMA) near $37 next. Conversely, a decisive move above $44 could have it eye $50 — a psychological resistance level — as its interim upside target. The views and opinions expressed here are solely those of the author and do not necessarily reflect the views of Cointelegraph.com. Every investment and trading move involves risk, you should conduct your own research when making a decision.

Čítaj viac

ETH price hits $3K as major crypto fund adds over $110M Ethereum to Lido's staking pool

Ethereum’s native token Ether (ETH) rose above $3,000 on March 22 as fresh data suggests Three Arrows Capital staked at least $110 million worth of ETH into Lido’s liquidity pools.The Singapore-based hedge fund manager provided liquidity worth 36,401 ETH to Lido’s “Curve stETH pool” using a third-party Ether wallet, data from Etherscan shows. As a result, it became eligible to receive at least 36,401 stacked Ether (stETH) tokens from Lido: To ensure low slippage when un-staking those tokens for real ETH plus staking reward.Third-party Ethereum wallet that received ETH from Three Arrow Capital. Source: Etherscan.ioAlmost an hour later, another Ether address, marked with the word “fund,” sent 6,993 ETH (worth $21.12 million) to the Curve stETH pool, hinting that Three Arrows Capital was adding more liquidity to the Lido’s coffers. If correct, the fund may have already staked more than $130 million worth of Ether on March 22.Participating in ETH 2.0?The Three Arrows Capital’s massive Ether inflow into Lido staking pools came ahead of the launch of Ethereum’s new validation system in summer 2022.Ethereum will switch its network protocol from energy-intensive proof-of-work to proof-of-stake, which lets users validate transactions and add blocks to the Ethereum blockchain by staking 32 ETH or its multiples for at least one year to earn annual yields.Ethereum total number of validators as of March 21, 2022. Source: GlassnodeBut only 8% of the current ETH supply has been staked into ETH 2.0 contracts since its introduction in December 2020, underscoring that average Ether users are reluctant to lock 32 ETH — about $100,000 at today’s price — for a year. That has created opportunities for liquidity mining providers like Lido.Notably, Lido allows users to lock any amount of Ether to participate in running the ETH 2.0 chain without lock-ups. As a result, it now represents more than 80% of the Ethereum liquid mining space, holding nearly $8.25 billion worth of ETH in its pools at today’s prices.Lido versus other Ethereum liquidity mining pools. Source: Defi LlamaHence, Three Arrows Capital’s looks intent to become a validator on the Ethereum network via a less risky alternative like a liquidity staking pool. Meanwhile, the fund appears to have also been accumulating more Ether.Accumulation after stakingThree Arrows Capital’s address received about $22.50 million worth of Ethereum tokens from wallets associated with crypto exchanges FTX and Deribit on March 22, less than an hour after it staked 36,401 ETH into the Lido’s pool.The Three Arrows Capital address (0x4862733B5FdDFd35f35ea8CCf08F5045e57388B3) has inflowed 7,500 ETH in the past seven hours, with a total value of about $22.43m; of which 5,500 ETH was withdrawn from FTX and 2,000 ETH was withdrawn from Deribit. https://t.co/27A1u6o4su— Wu Blockchain (@WuBlockchain) March 22, 2022Related: Ether bulls eye resistance at $3K as the network prepares to undergo ‘The Merge’It wasn’t clear whether Three Arrows purchased the coins anew or merely withdrew them for holding or further staking. But in either case, the firm contributed to what appears like a constant depletion of Ether reserves across the crypto exchanges, considered by many ETH traders a bullish signal.Nonetheless, PostyXBT, an independent market analyst, highlighted $3,000 as a key inflection zone for ETH price, noting that only flipping above it decisively could have Ether eye a move toward $3,500.ETH/USD 12-hour price chart. Source: PostXBT, TradingView”I think we see a further +10% move towards key resistance,” he wrote.The views and opinions expressed here are solely those of the author and do not necessarily reflect the views of Cointelegraph.com. Every investment and trading move involves risk, you should conduct your own research when making a decision.

Čítaj viac

Terra price signal that preceded an 80% LUNA rally is back

A technical setup that preceded a circa 80% price rally in the Terra (LUNA) market in August 2021 has appeared again.LUNA paints bullish MACD crossoverThe technical setup involves a so-called “signal line crossover” between LUNA’s weekly MACD line — equal to the difference between the token’s 12-week and 26-week moving averages (MA) — and the 9-week MA called the Signal Line, plotted above the zero line, as shown in the chart below.LUNA/USD weekly MACD illustration. Source: TradingViewTogether, these lines represent Moving Average Convergence Divergence (MACD), a momentum oscillator to determine a market’s direction and momentum. So, if the MACD line crosses above the signal line, markets interpret it as a bullish MACD crossover. Conversely, a bearish MACD crossover occurs when the MACD line falls below the signal line.LUNA’s weekly MACD line closed above its signal line earlier this month, raising speculations about a strong bullish momentum ahead. For instance, independent market analysts “Argonauts” cited a similar bullish crossover from August 2021 that occurred before the Terra token’s circa 80% price rally — from $12 to $102.Something is up on $LUNA weekly timeframe. Last time the MACD crossover occured it sent $LUNA from $12 to $106. #luna #nfa pic.twitter.com/9TYyGmp88j— Argonauts (@terra_hodler) March 20, 2022Bearish divergence detectedThe MACD-based bullish outlook in the Terra market also stems from LUNA’s incredible price performance in the last thirty days.Notably, LUNA’s price has surged by nearly 90% after bottoming out at $47.25 on Feb. 20, now eyeing a run-up above $100. Nonetheless, the Terra token’s strong upside move accompanies a decreasing momentum, as illustrated by its weekly relative strength index (RSI), and weakening trading volumes, suggesting bullish exhaustion is close.LUNA/USD weekly price chart featuring price-momentum bearish divergence. Source: TradingViewTherefore, a pullback from levels near $100 could have LUNA retest its previous resistance-turned-support levels near $75.50 and $50, coinciding with the 0.236 and 0.5 Fib lines, respectively, of the Fibonacci retracement graph attached below. LUNA/USD weekly price chart featuring Fibonacci retracement support/resistance levels. Source: TradingViewLUNA price double-top risksLUNA’s close above its previous record high of around $106 could have it enter unchartered territory with a Fibonacci retracement graph drawn from $102-swing high to $45.50-swing low, suggesting an extended upside move toward $138.LUNA/USD weekly price chart. Source: TradingViewRelated: ‘We’re already buying:’ Terra founder plans to obtain $10B BTC for reservesOn the other hand, a pullback move from levels near $100 could also trigger the classic double-top setup, which entails two high points in the market, signifying an impending bearish reversal signal. LUNA could paint one in the coming weeks, as shown in the chart below.LUNA/USD weekly price chart featuring ‘double top’ setup. Source: TradingView In a “perfect” double top scenario, the Terra token would risk crashing by more than 50% to $44 on the next pullback, followed by a breakout move towards $19.50, also coinciding with LUNA’s 50-week exponential moving average (the red wave). The views and opinions expressed here are solely those of the author and do not necessarily reflect the views of Cointelegraph.com. Every investment and trading move involves risk, you should conduct your own research when making a decision.

Čítaj viac

Ethereum balance on crypto exchanges falls to lowest levels since 2018

The amount of Ethereum’s native token Ether (ETH) kept with crypto exchanges has fallen to its lowest levels since September 2018, signaling traders’ intention to hold the tokens in hopes of a price rally in 2022.Notably, nearly 550,000 ETH tokens — worth around $1.61 billion — have left centralized trading platforms year-to-date, according to data provided by Glassnode. The massive outflow has reduced the exchanges’ net Ether balance to 21.72 million ETH, down from its record high of 31.68 million ETH in June 2020.Ethereum balance on all exchanges as of March 18, 2022. Source: GlassnodeBiggest weekly ETH outflow since October 2021Interestingly, over 30% of all Ether’s withdrawals from exchanges witnessed in 2022 appeared earlier this week, data from IntoTheBlock shows. In detail, over 180,000 ETH left crypto trading platforms on March 15, bringing the weekly outflow’s worth to a little over $500 million as of March 18.Ethereum net exchange flows. Source: IntoTheBlockChainalysis data showed similar readings, revealing that Ether tokens could have left exchanges this week at an average of about 120,000 units per day, a bullish signal. Excerpts:”Assets held on exchanges increase if more market participants want to sell than to buy and if buyers choose to store their assets on exchanges.”IntoTheBlock provided a similar upside outlook while citing a fractal from October 2021 that saw the Ether’s price rising by 15% ten days after the Ethereum network detected massive ETH withdrawals from centralized crypto exchanges.Ethereum supply crunch underwayThe increase in Ether withdrawals from exchanges this week coincided with about 190,000 ETH moving into Lido’s “stETH liquid staking” pools, IntoTheBlock noted.To recap, Lido is a non-custodial staking service that enables users to overcome challenges associated with staking on the Ethereum 2.0 Beacon Chain, including the requirement of staking a minimum of 32 ETH or its multiples. Furthermore, Lido proposes to solve the capital efficiency problem by issuing stETH, the tokenized version of staked ETH.The last 30 days showed Ether holders adding over 1 million ETH into the Ethereum 2.0 contract. And as the protocol prepares to switch completely to proof-of-stake in summer — in the wake of its “Merge” earlier this week on the Kiln testnet — the probability of more Ether tokens going out of active supply has increased.Lol. No one told anon that there’s going to be a liquidity squeeze in newly minted Ether in a few months. No newly minted Ether will enter circulation between the Merge (Juneish) and Shanghai (Decemberish). I’d text them but I don’t even have their number. You got it? Poor anon.— superphiz.eth (@superphiz) March 16, 2022ETH price rebound continuesThe bullishness surrounding Ethereum’s switch to proof-of-stake has prompted Ether to enter a rebound mode this week. Related: Vitalik Buterin talks crypto’s perils in Time Magazine interviewIn detail, ETH’s price rallied by more than 17% week-to-date to nearly $3,000. Interestingly, the upside retracement originated at a technical level — rising trendline support with a recent history of limiting Ether’s bearish outlooks, as shown in the chart below.ETH/USD daily price chart. Source: TradingViewNonetheless, as Cointelegraph covered earlier, Ether could pare its gains owing to another technical level, this time a falling trendline resistance that has also been instrumental in capping its upside attempts since January 2022.Together, these trendlines appear to have formed a continuation pattern called a symmetrical triangle, indicating that Ether will most likely go in the direction of its previous trend, i.e., down. For now, ETH could fall back toward the triangle’s support trendline on a pullback from its resistance one.  The views and opinions expressed here are solely those of the author and do not necessarily reflect the views of Cointelegraph.com. Every investment and trading move involves risk, you should conduct your own research when making a decision.

Čítaj viac

Bitcoin beats owning COIN stock by 20% since Coinbase IPO

Buying a Coinbase stock (COIN) to gain indirect exposure in the Bitcoin (BTC) market has been a bad strategy so far compared to simply holding BTC. Notably, COIN is down by nearly 50% to almost $186, if measured from the opening rate on its IPO on April 14, 2021. In comparison, Bitcoin outperformed the Coinbase stock by logging fewer losses in the same period — a little over 30% as it dropped from nearly $65,000 to around $41,700BTC/USD (orange) vs. COIN price (blue). Source: TradingViewWhat’s bothering Coinbase?The correlation between Coinbase and Bitcoin has been largely positive to date, however, suggesting that many investors consider them as assets with similar value propositions. That is primarily due to the buzz around how COIN could become a simpler onboarding experience for investors into the crypto sector compared to buying Bitcoin, Ether (ETH), and other digital assets.COIN’s correlation with BTC on daily basis. Source: TradingViewBut the COIN product is facing increasing competition with the arrival of crypto-based exchange-traded products (ETP), mining stocks, and similar crypto-enabled firms listed across Wall Street indexes. This may have reduced its demand as the go-to asset for gaining crypto exposure.Related: Bitcoin faces new ‘milestone’ in 2022 as new forecast predicts BTC price ‘in the millions’Additionally, COIN faces downside risks due to its depressive forecasts for FY22. Coinbase stated in its latest earnings report that the crypto volatility could turn 2022 into an unprofitable year, noting their adjusted EBITDA losses could come to be around $500 million if its monthly transaction users come at the lower end of its guidance range.Coinbase’s adjusted EBITDA margins. Source: JR ResearchJere Ong, the principal analyst and founder of JR Research, noted that 96% of Coinbase’s total revenue in Q4/2021 came from the fees charged on retail transactions, which highlights its business model’s “inherent weakness.” Excerpts from his report:”We believe it offers a short-term buying opportunity for speculative investors. But, we do not encourage investors to hold COIN stock for the long term unless you have a very high conviction of its execution.Bitcoin’s risks are entirely differentBitcoin is a different beast when compared to the shares of centralized company like Coinbase. Absolute scarcity, censorship-resilient decentralized ledger, and gold-like properties as a potential hedge against-inflation in the digital age are just some of the concepts driving up BTC price today. With 7.5% inflation and real inflation numbers at 19.5% (shadowstats) the fed is doing a great job! Just 100x more, and they will be at Paul Volcker’s level of 30% interest rates!!! Got #Bitcoin? pic.twitter.com/qesZ2iU0Mv— Davinci Jeremie (@Davincij15) March 17, 2022As a result, analysts and strategists predict Bitcoin to reach anywhere from zero to “millions” per 1 BTC, depending on who you ask.Elsewhere, most of the crypto-exposure stocks have also suffered more compared to Bitcoin. Namely, Nasdaq-listed mining firms Canaan, whose stock value fell by nearly 80% year-over-year, and Riot Blockchain, which dropped 67.55% in the same period.The views and opinions expressed here are solely those of the author and do not necessarily reflect the views of Cointelegraph.com. Every investment and trading move involves risk, you should conduct your own research when making a decision.

Čítaj viac

Získaj BONUS 8 € v Bitcoinoch

nakup bitcoin z karty

Registrácia Binance

Burza Binance

Aktuálne kurzy