Autor Cointelegraph By Yashu Gola

Solana price up 50% in two weeks, but here's why $120 will be hard to crack

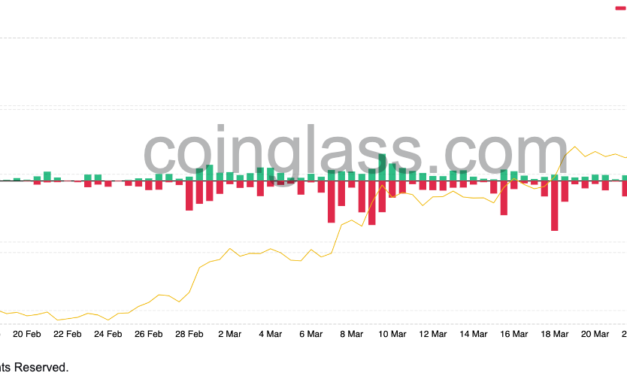
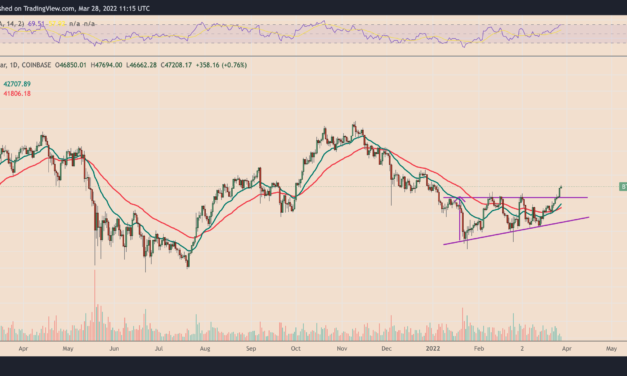
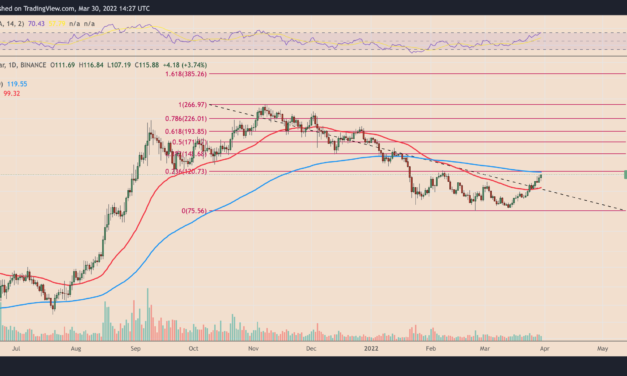
Solana (SOL) continued its two-week uptrend on March 30, rising in part owing to its integration with OpenSea, the world’s biggest nonfungible token (NFT) by volume. SOL price rises to multi-week highsSOL’s price gained 4.5% in the past 24 hours to around $117 per token, its best level since Feb. 11, 2022. The coin’s latest move upside pushed its two-week paper returns to over 50%. Nonetheless, SOL/USD is still down 30% on a year-to-date timeframe, risking pullback as the price tested its 200-day exponential moving average (200-day EMA; the blue wave) near $120 as resistance.SOL/USD daily price chart. Source: TradingViewThe 200-day EMA coincided with the 0.236 Fib line of the Fibonacci retracement graph — drawn from $266-swing high to $75-swing low. This adds another layer of selloff risks near $120, which will likely prove to be a hard level to break. SOL NFT transactions hit record highOpenSea’s decision to integrate Solana’s NFTs into its marketplace on Tuesday might have boosted SOL’s price. The rally also coincided with Solana-based NFT marketplaces recording their best day in terms of volumes and transactions on March 29, according to data from Dune Analytics. The total number of transactions executed across these Solana platforms crossed 57,000. Meanwhile, their net valuation came out to be around 136,000 SOL, approximately $15.2 million at today’s price, making it the largest daily transaction volume observed inside Solana’s NFT ecosystem to date.Solana NFT daily transaction volume. Source: Dune AnalyticsInterestingly, Magic Eden processed about 80% of the total reported transactions on March 29. The NFT marketplace, which recently raised $27 million in a Series A funding round led by Paradigm, has been consistently outperforming its peers across the Solana ecosystem since its launch in October 2021. But NFT sales volume downtrend remainsSolana NFT marketplaces have been underperforming in terms of sales volume despite witnessing growth in their transactional activity.The owner-to-owner NFT sales volume has dropped by more than 13% to $147.41 million in the past 30 days, according to data provided by CryptoSlam. Meanwhile, it has shed 30% compared to January’s $202.19 million figure.Solana sales volume. Source: CryptoSlamHowever, Solana is not alone with similar decline in NFT sales across other chains, noted Philip Gunwhy, partner at sports NFT marketplace Blockasset. He adds tha increased crypto regulations in the U.S. and China might have dampened the demand for NFTs as well.Related: OpenSea set to integrate Solana in April, further expanding the NFT ecosystemFor instance, Ethereum (ETH), the leading smart contract platform that hosts more than 90% of all the NFT volumes, witnessed a decline of nearly 38% in sales volumes in the last 30 days, almost thrice higher than Solana. Ethereum NFT sales volume and unique buyers. Source: CryptoSlamOther blockchain projects, including Avalanche (AVAX), Ronin, and Flow, also suffered 30%-60% drops in their NFT sales volume — in the same period.”Clearly, the level of sales is proportional to the number of users, which is currently decreasing in the majority of marketplaces,” Gunwhy explained.”NFT market correlates with investor sentiment rather than fundamental factors, this is a trend that we cannot ignore for the time being.”The views and opinions expressed here are solely those of the author and do not necessarily reflect the views of Cointelegraph.com. Every investment and trading move involves risk, you should conduct your own research when making a decision.

Čítaj viac

Nearly $13.75M liquidated as WAVES rallies 70% in a day — what's next?

WAVES price surged by up to 70% on March 29, reaching a new all-time high around $54. Traders betting against the rise of Waves — the native token of the WAVES blockchain network — suffered losses worth millions of dollars as the WAVES/USD pair extended its recovery to a record level in the past 24 hours.The price rebound, which started on Feb. 22 when WAVES price was at $8.25 caused around $13.75 million worth of liquidations due to crypto-based futures on a 24-hour adjusted timeframe, data from Coinglass shows.WAVES liquidations every 12-hours. Source: CoinglassAround $11 million of the total liquidated positions were short.2.0 hype, Neutrino behind WAVES rallyAs Cointelegraph earlier covered, traders may have jumped into the WAVES market after assessing its three consecutive optimistic updates: the migration to Waves 2.0, the launch of a $150 million fund and the partnership with Allbridge.Edson Ayllon, product manager at dHEDGE — a decentralized asset management platform, told Cointelegraph that the euphoria surrounding the release of Waves 2.0 in October was reflective in the rising total value locked (TVL) in the Waves ecosystem that reached an all-time high of $4.36 billion on March 29.”Waves 2.0 adds EVM support to the execution layer, and adds proof-of-stake with sharding to the consensus layer,” the analyst noted, adding:”Sharding and proof-of-stake have been concepts Ethereum has been working towards for years on their roadmap.”Interestingly, Neutrino, an algorithmic price-stable “assetization” protocol built atop the Waves blockchain, appeared largely behind the increasing Waves TVL. Notably, the protocol witnessed an inflow of 8.91 million WAVES in one day — worth nearly $450 million — to its smart contract, data from Defi Llama shows.Waves inflow into the Neutrino smart contract. Source: Defi LlamaNeutrino allows the creation of decentralized stablecoins that maintain their U.S. dollar-peg by collateralizing WAVES tokens. The protocol has launched just one stablecoin project so far, called Neutrino USD (USDN). The supply of USDN increased from around 800 million to 832 million on a 24-hour adjusted timeframe, coinciding with the rise in the WAVES inflow into the Neutrino smart contract. That presented Neutrino as one of the active WAVES buyers in the past 24 hours.USDN market capitalization in the last 24 hours. Source: CoinMarketCapWhat’s next?WAVES appears to have been breaking out of a bullish continuation pattern called a “bull flag.”In detail, the chart pattern looks like a downward sloping channel that appears after a strong price move upward (called “flagpole”). In a perfect scenario, it resolves by breaking out toward the level at a length potentially equal to the flagpole’s size.Related: Here’s how traders were alerted to RUNE’s, FUN’s, WAVES’ and KNC’s big rallies last weekApplying the classic interpretation of the bull flag pattern to WAVES’ ongoing price action suggests a continued price rally toward $100, as shown in the chart below.WAVES/USD weekly price chart featuring ‘bull flag’ pattern. Source: TradingViewHowever, WAVES’ weekly relative strength index (RSI) has turned overbought — a sell signal. That could have the WAVES/USD pair retrace towards $34 as its interim support level. That would also mean that traders are returning to bull flag’s top for another upside confirmation.As a result, a continued selloff below $17 would risk invalidating the entire flag setup. The views and opinions expressed here are solely those of the author and do not necessarily reflect the views of Cointelegraph.com. Every investment and trading move involves risk, you should conduct your own research when making a decision.

Čítaj viac

Terra LUNA hits new all-time high after 100% rebound from 2022 lows — Correction ahead?

Terra (LUNA) rose to its best level to date on March 29 as the Luna Foundation Guard’s (LFG) plans to increase its Bitcoin (BTC) reserves eased anxiety about the impact of an increasingly hawkish Federal Reserve and the ongoing Ukraine-Russia war on crypto markets.LUNA price hits new record high above $106LUNA’s price breached above the previous record high of $106.29 by minuscule margins, reversing the losses incurred during the selloff between December 2021 and January 2022. The latest price rally pushed Terra token’s net capitalization crossed $37.17 billion, now making up 1.76% of the entire crypto market, compared to 0.39% at the beginning of this year.LUNA market dominance is increasing steadily in 2022. Source: TradingViewTerra does a MicroStrategyBitcoin wallets associated with LFG, a nonprofit spearheaded by Terra’s creator Do Kwon, saw an inflow of 2,830 BTC worth $135 million on Monday. The influx occurred as a part of LFG’s Bitcoin accumulation spree following a community proposal that suggested to use BTC as collateral to “provide deep liquidity at a discount when the UST peg is under pressure.”UST is the Terra’s decentralized stablecoin otherwise collateralized by the blockchain’s native cryptocurrency LUNA. As such, Terra’s economy supports the burning of LUNA tokens to mint more UST units as a strategy to maintain the latter’s dollar-peg.We’re seeing some of the earliest and most ambitious ideas in crypto starting to unfoldCrosschain decentralized stablecoin backed entirely by digitally native assets was the holy grail in 2016Bless$BTC $LUNA— Zhu Su (@zhusu) March 29, 2022LFG has outlined plans to boost its Bitcoin reserves to $3 billion with a long-term strategy to swell the pool to $10 billion. In a theory, that could lead to an increase in demand for UST, thereby forcing more LUNA tokens out of active supply permanently. UST net supply. Source: Smart StakeLUNA faces immediate selloff risksFrom a technical perspective, LUNA faces the prospects of undergoing a 50% price correction in the coming weeks, though this may not necessarily hurt the bullish long-term outlook.In detail, the Terra token has been consolidating inside what appears to be an ascending channel, a continuation pattern that appears after the price fluctuates inside a range defined by an upper horizontal and a lower rising trendline. Related: Terraform Labs donates $1.1B for Luna Foundation Guard‘s reservesIn a perfect scenario, the setup resolves with a breakout in the direction of the asset’s previous trend, rising by as much as the maximum distance between the channel’s upper and lower trendline. As a result, LUNA’s price could rise toward $425 in 2022, as shown in the chart below.LUNA/USD daily price chart featuring “ascending triangle” setup. Source: TradingViewBut the upside outlook needs further confirmation, beginning with a decisive breakout above the triangle’s upper trendline. If it does not come, LUNA’s prospects of a sharp pullback towards the lower trendlines appear higher, which means a price drop towards the $50-$60 range, down around 50% from today’s price. The views and opinions expressed here are solely those of the author and do not necessarily reflect the views of Cointelegraph.com. Every investment and trading move involves risk, you should conduct your own research when making a decision.

Čítaj viac

Bitcoin to $58K next? A 2019-like 'reversal ascending triangle' hints at more upside for BTC

A sharp reversal in the price of Bitcoin (BTC) out of an otherwise bearish technical setup has raised its chances of reaching $58,000 in Q2.Bitcoin price bottoming out?On the daily timeframe, Bitcoin broke out of its ascending triangle on March 27 to the upside, bringing the much-anticipated level of $50,000 within its range. Interestingly, ascending triangles are continuation patterns, meaning they typically resolve by sending the price in the direction of its previous trend once it breaks out of their tightening range. Bitcoin, which was trending downwards before forming an ascending triangle, avoided further downside. Instead, it managed to break above the pattern’s upper horizontal trendline around $45,000, and followed the move upwards by hitting almost $47,700, a level last claimed on Jan. 2, 2022.This turned out to be among the few cases wherein ascending triangles emerge at the end of a downtrend. For instance, Bitcoin underwent a sharp upside retracement — from $3,100 to $14,000 — after painting a similar triangle pattern between December 2018 and April 2019, as veteran market analyst Peter Brandt noted on March 28.The $BTC pattern is called an ascending triangle (right). Read about Asc Tris in Schabacker, Study III, pgs 93-Also, compare present pattern to similar structure in 2019 (left) #Bitcoin pic.twitter.com/IyB2j7f8F6— Peter Brandt (@PeterLBrandt) March 27, 2022The fractal raises Bitcoin’s potential to undergo a decisive breakout out of its “reversal ascending triangle,” for an extended price rally toward the level that is at a length equal to the maximum distance between the triangle’s upper horizontal and lower rising trendline, i.e. around $58,000, as shown in the chart below.BTC/USD daily price chart featuring reversal ascending triangle setup. Source: TradingViewWeekly timeframe: $69K next?Independent analyst “dave the wave” meanwhile anticipates Bitcoin to rally toward its current record high at $69,000.The analyst churned out the bullish forecast based on a broader ascending triangle pattern, coupled with Bitcoin’s logarithmic support level, on a weekly scale. Nonetheless, his setup also posed possibilities of Bitcoin crashing back below $40,000 after failing to break $69,000.I think the way you have your chart highlighted could be a real possibility— Peter Brandt (@PeterLBrandt) March 28, 2022

Why $52,500 is the most decisive levelBitcoin ascending triangles in both shorter- and longer-timeframe charts present extremely bullish outlooks. However, immediate downside risks are still present when considering critical weekly moving averages and Fibonacci retracement levels. Notably, Bitcoin’s ongoing upside move occurred after it tested its 100-week exponential moving average (100-week EMA; the black wave) repeatedly as support. Meanwhile, a 0.236 Fib line (near $36,000) of the Fibonacci retracement graph — drawn from $69,000-swing high to $26,000-swing low — acted as an additional support. The $26,000-level coincides with the 200-week EMA (the blue wave).Interestingly, the rebound appeared exactly similar to price actions witnessed between November 2019 and January 2020. Back then, BTC’s price rally exhausted upon reaching the 0.618 Fib line (near $10,500) in February 2020, leading to a correction towards the 200-week EMA a month later.Related: Bitcoin sellers keep BTC price action in check amid $45K ‘fakeout’ warningIf Bitcoin repeats the same move in 2022, the BTC/USD pair could reach its current 0.618 Fib line near $52,500, only then to correct back toward the 200-week EMA near $26,000. Conversely, a decisive move above the Fibonacci level could trigger the ascending triangle setups, as discussed above.The views and opinions expressed here are solely those of the author and do not necessarily reflect the views of Cointelegraph.com. Every investment and trading move involves risk, you should conduct your own research when making a decision.

Čítaj viac

Ethereum risks 'double-bust' drop despite ETH price rebounding 30% in two weeks

It took Ethereum’s native token Ether (ETH) only two months to recover from a brutal selloff at the beginning of 2022.ETH price breaks out but risks remainETH price reached near $3,350 on March 28 after rallying by over 30% in just two weeks, and by more than 50% when measured from its year-to-date low of around $2,160, established Jan. 24. In doing so, the ETH/USD pair may have also “busted” what earlier appeared to be a bearish continuation setup, called the “symmetrical triangle.”ETH/USD daily price chart featuring ‘symmetrical triangle’ reversal. Source: TradingView”Busted patterns (when the breakout is in one direction only to see price reverse and breakout in the opposite direction) often result in strong moves,” writes Tom Bulkowski, a veteran market analyst. This raises hopes that Ether can rally to the triangle pattern’s target near $4,000 in the coming days. ETH fakeout risksHowever, the market analyst also notes that symmetrical triangles have a tendency to “double-bust,” wherein the final breakout direction comes out to be the same as the original one.A double-bust scenario means Ether’s uptrend could exhaust soon, leading to a reversal toward the symmetrical triangle’s top. The downside outlook appears as ETH retests its support-turned-resistance range that served as a selloff area for traders in the January-February session, as shown in the chart below.ETH/USD daily price chart featuring double-bust scenario. Source: TradingViewAs a result, another selloff near the range could the trigger double-bust risks, prompting Ether’s price to drop toward the symmetrical triangle’s downside target near $1,800, set after measuring widest distance between the triangle’s upper and lower trendline and adding it to the breakout point.Interestingly, the $1,800-level was instrumental in capping Ethereum’s downside attempts during the selloff witnessed in May-July 2021.Conversely, the double-bust setup will be invalidated if the price decisively rises above the resistance range. PostXBT, an independent market analyst, further noted that flipping levels around $3,350 back to support could raise ETH’s possibilities to hit $4,000.$ETH 1WDecent pump but ETH still at weekly resistance. A little cautious and would like to see a bit more here.Flip ~$3,350 and then we can discuss the possibilities of $4k again. pic.twitter.com/zNWqVMRtsg— Posty (@PostyXBT) March 28, 2022Ethereum’s upside catalystsThe beginning of Ether’s 30% rebound rally coincided with the Ethereum Beacon Chain’s merge with the Kiln testnet, signaling that its blockchain would completely move to a proof-of-stake network by summer 2022.Speculators have waited for Ethereum’s move to ETH 2.0 for a long time, since the upgrade promises to deliver cheaper and more efficient transactions. In theory, it would happen by giving network participants carrot-and-stick incentives to collaborate, wherein they would be required to lock up, or “stake,” 32 ETH for 18 months to become validators. In return, they would receive annual yields in the same token. Total number of ETH deposits to ETH 2.0. Source: GlassnodeAs a result, many analysts predict Ether price will rise as supply decreases, particularly if demand stays the same or continues to rise. On the left you see the promised dilution of the Premine. On the right what was fulfilled. Ether supply will decrease after PoS. Think very carefully what this unfulfilled promise and the disguised whales of the Ethereum presale mean for Ethers future, its Proof of Stake & Web3.. pic.twitter.com/kaMgrs23hq— stefan huber.justice (@Leerzeit) March 25, 2022

Related: ETH price hits $3K as major crypto fund adds over $110M Ethereum to Lido’s staking poolSimultaneously, Ether still faces downside risks due to its strong correlation with the U.S. stock market and Bitcoin (BTC). As reported earlier, BTC’s correlation with stocks is being closely watched this week as BTC/USD challenges key areas of resistance. The views and opinions expressed here are solely those of the author and do not necessarily reflect the views of Cointelegraph.com. Every investment and trading move involves risk, you should conduct your own research when making a decision.

Čítaj viac

Získaj BONUS 8 € v Bitcoinoch

nakup bitcoin z karty

Registrácia Binance

Burza Binance

Aktuálne kurzy