Autor Cointelegraph By Yashu Gola

Elon Musk's Twitter investment puts a 150% rally into play for Dogecoin

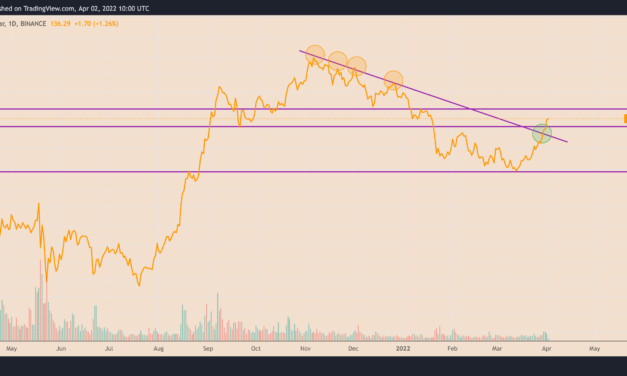
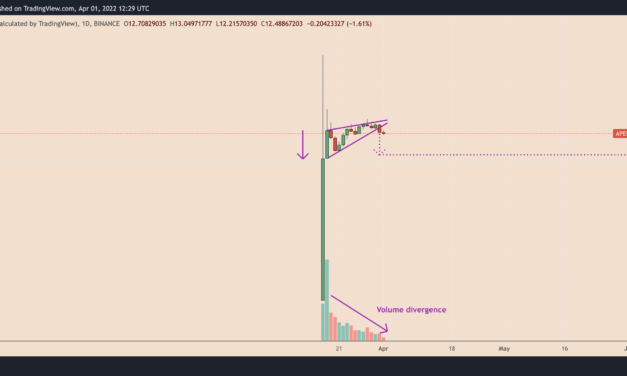
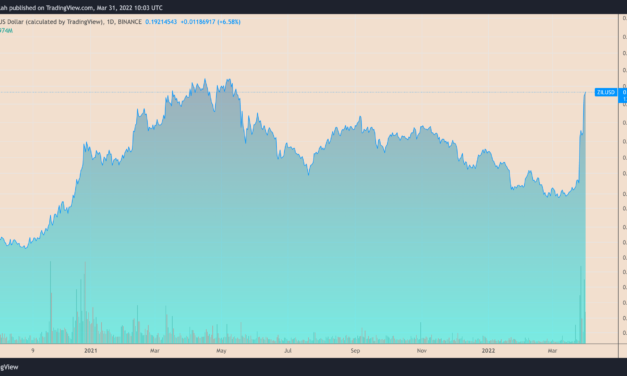
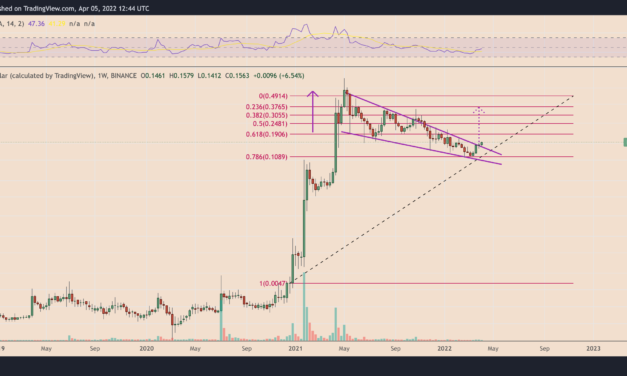
Dogecoin (DOGE) continues its rebound move four weeks after bottoming near $0.10 and is now promising more upside moves in Q2/2022.Dogecoin price nears two-month highsDOGE’s price had risen by nearly 6.5% week-to-date to $0.15 a token. The coin’s recent gains surfaced after Elon Musk disclosed his $3-billion stake in Twitter on April 4, reiterating his influence on its market. Musk has been a big supporter of the Dogecoin community, including his decision to accept DOGE payments at his company Tesla’s online merchandise store. As Cointelegraph reported, Musk’s investment could help push Twitter’s crypto initiatives forward and even see DOGE integration on the social media platform. So, @jack owns 2% of twitter, @elonmusk owns 9%!@jack loves BTC.@elonmusk loves $DOGE.— Ran NeuNer (@cryptomanran) April 4, 2022DOGE’s falling wedge breakout underwayMusk’s Twitter investment also assisted Dogecoin in breaking out of a falling wedge pattern.In detail, falling wedges are considered bullish reversal setups and appear when the price consolidates lower inside a range defined by two converging, descending trendlines while leaving behind a trail of lower highs and lower lows.In a perfect scenario, falling wedges resolve after the price breaks decisively above their upper trendline. As it happens, traders typically eye a run-up toward the level that comes to be at length equal to the maximum distance between the wedge’s upper and lower trendline.As DOGE’s price undergoes a similar pattern, its likelihood of continuing its uptrend has increased following the break above the trendline on April 4. Therefore, the coin now eyes a run-up towards $0.37, about 150% above April 5’s price, as shown in the chart below.DOGE/USD weekly price chart with falling wedge’ pattern. Source: TradingViewDOGE price downside risksNonetheless, the bullish setup comes with downside risks. Notably, Dogecoin’s breakout move above the falling wedge’s upper trendline accompanies weaker volumes, suggesting that traders lack conviction in the rally.Related: What Elon Musk’s investment could mean for Twitter’s crypto plansDOGE also trades below two critical support levels: the 20-week exponential moving average (20-week EMA; the green wave) around $0.15 and the 50-week EMA (the red wave) near $0.17. DOGE/USD weekly price chart featuring moving average resistances and volume. Source: TradingViewA pullback from the said price ceilings could have Dogecoin return to the falling wedge’s upper trendline to test it as a newfound support level. On the other hand, an extended decline risks invalidating the entire bullish reversal setup.Holding the wedge’s upper trendline as support and breaking above the 20- and 50-week EMAs with strong volumes would keep DOGE’s $0.37-target intact.The views and opinions expressed here are solely those of the author and do not necessarily reflect the views of Cointelegraph.com. Every investment and trading move involves risk, you should conduct your own research when making a decision.

Čítaj viac

Neutrino Dollar breaks peg, falls to $0.82 amid WAVES price 'manipulation' accusations

Neutrino Dollar (USDN), a stablecoin issued through Waves-backed Neutrino protocol, lost its U.S. dollar-peg on April 4 amid speculations that it could become “insolvent” in the future.USDN plunges 15% despite WAVES backingUSDN dropped to as low as $0.822 on Monday with its market capitalization also diving to $824.25 million, down 14% from its year-to-date high of $960.25 million.Interestingly, the stablecoin’s plunge occurred despite Neutrino’s claims of backing its $1-peg via what’s called “over collateral,” i.e., when the total value of Waves (WAVES) tokens locked inside its smart contract is higher than the total USDN minted, also called the “backing ratio.”Neutrino Dollar price performance in the last 24 hours. Source: CoinMarketCapNotably, Neutrino smart contract’s backing ratio came out to be 2.62 Monday, according to official data, underscoring that it had adequate funds to back USDN’s dollar-peg by 1:1. That is despite WAVES’ 35%-plus drop in the last five days.Price manipulationWAVES’ price dropped from its record high near $64 on March 31 to as low as $47 on April 4. The coin started declining as its momentum indicator, the relative strength index (RSI), jumped above 70 — an ‘overbought’ area that typically triggers selling sentiment. WAVES/USD daily price chart. Source: TradingViewNonetheless, the selloff occurred also as a pseudonymous analyst accused Waves of artificially pumping WAVES by 750% in the last two months by: 1) collateralizing USDN to borrow USD Coin (USDC) on the Vires.Finance lending platform; 2) use the proceeds to purchase WAVES; 3) converting the tokens to USDN, and 4) redeploy them into the Vires.Finance pool to borrow more USDC. The analyst also said that a decisive WAVES’ price crash would make USDN insolvent.If WAVES prices drop enough —- WAVES mkt cap could be less than USDN outstandingThis would mean USDN is insolvent and would depegIf USDN depegs is material — the USDC short on Vires could liquidate $607mm of the $875mm outstanding USDNThis would be Armageddon— 0xHamZ (@0xHamz) March 31, 2022Waves founder Sasha Ivanov, however, denied the allegations on April 3, noting that one cannot move markets of more than $1 billion daily volume by borrowing a few millions. He further accused Alameda Research, a quantitative crypto trading firm headed by FTX’s Sam Bankman-Fried, of launching a campaign “fueled by a crowd of paid trolls” against WAVES to honor their short positions on the coin.The account started borrowing $waves around March, 20, sending it to Binance – https://t.co/OoSC50EaHl, obviously to sell and make the price go lower. It started around the same time when the FUD campaign started.— Sasha Ivanov (1 ➝ 2) (@sasha35625) April 3, 2022

Related: Here’s how traders were alerted to RUNE’s, FUN’s, WAVES’ and KNC’s big rallies last weekFrom a technical perspective, WAVES holds its bullish bias above the confluence of two support levels: the 20-day exponential moving average (20-day EMA; the green wave) around $40 and the 0.382 Fib line near $42.50.Conversely, a decisive break below the support confluence could risk crashing WAVES toward $30.The views and opinions expressed here are solely those of the author and do not necessarily reflect the views of Cointelegraph.com. Every investment and trading move involves risk, you should conduct your own research when making a decision.

Čítaj viac

Solana jumps past key selloff junction: SOL price eyes $150 in April

Solana (SOL) jumped past a critical resistance level that had limited its recovery attempts during the November 2021-March 2022 price correction multiple times, thus raising hopes of more upside in April.Solana flips key resistance to supportTo recap, SOL’s price underwent extreme pullbacks upon testing its multi-month downward sloping trendline in recent history. For instance, the SOL/USD pair dropped by 60% two months after retracing from the said resistance level in December 2021. Similarly, it had fallen by over 40% in a similar retracement move led by a selloff near the trendline in November 2021.SOL/USD daily price chart. Source: TradingViewBut Solana flipped the resistance trendline as support (S/R flip) after breaking above it on March 30, accompanied by a rise in trading volume that showed traders’ conviction in the breakout move. In doing so, SOL’s price rallied by 25% to reach $135, bringing the psychological resistance level of $150 within reach.Why is SOL (technically) bullish?From a technical perspective, SOL’s breakout move above its falling trendline resistance coincided with a bullish crossover between its two key moving averages: the 20-day exponential moving average (20-day EMA; the green wave) and the 50-day EMA (the red wave).Dubbed the golden cross, the technical indicator occurs when an asset’s short-term moving average jumps above its long-term moving average. Traditional analysts consider this crossover as a buying signal.SOL/USD daily price chart featuring ‘Golden Cross.’ Source: TradingViewFor instance, the 20-50 EMA crossover in August 2020 may have assisted in pushing SOL’s price upward by more than 650% to over $267, in addition to other fundamental and technical catalysts. As such, the golden cross boosts SOL’s likelihood of continuing its rally, as well as its breakout above the falling trendline resistance.RSI divergenceThe upside prospects increase further if a technical fractal highlighted by Delphi Digital is to be believed.The crypto research firm highlighted a correlation between SOL’s price and the combination of its two technical indicators: the S/R flip and relative strength index (RSI) divergence.Notably, the first time Solana’s RSI jumped above 70, an “overbought” area, after a strong price uptrend — that had it also break above the descending trendline support of that period — SOL tended to continue rallying despite its RSI consolidating lower or sideways. Solana daily price chart featuring S/R flip and RSI divergence. Source: Delphi DigitalFor instance, SOL rallied 378% after the first time its RSI broke above 70 in August 2021. Similarly, the period of an overbought RSI during May-June 2021 also coincided with Solana’s 268% upside move. The fractals appeared similar to how SOL has been performing lately, suggested Delphi Digital.Related: Opera integrates Bitcoin, Solana, Polygon and five other blockchainsTherefore, SOL/USD could continues its uptrend when using Fibonacci retracement levels, drawn between $261-swing high to $77.50-swing low, suggesting $147-$150 as the interim upside target.SOL/USD daily price chart. Source: TradingViewConversely, a pullback upon or ahead of testing the $147-$150 price range can result in SOL retesting the $120 as its interim support, with a possible slide toward the 20- and 50-day EMAs.The views and opinions expressed here are solely those of the author and do not necessarily reflect the views of Cointelegraph.com. Every investment and trading move involves risk, you should conduct your own research when making a decision.

Čítaj viac

ApeCoin risks another massive selloff as APE drops 70% in two weeks — Here's why

A euphoric price rally by ApeCoin (APE) seen in mid-March appears to be exhausted already thanks to the coin’s 70% drop in valuation in the past two weeks — and it may fall further in April.At the core of this bearish outlook is a rising wedge, a technical pattern that forms as the price consolidates upward inside a range defined by two converging ascending trendlines. In a perfect scenario, rising wedges resolve into a bearish breakout, confirmed by a decisive drop below the lower trendline that typically takes the price as low as the maximum wedge’s height.ApeCoin has been painting a very similar pattern since March 18, as shown in the chart below. The coin recently broke below its rising wedge’s lower trendline, bringing itself in proximity with the setup’s theoretical price target near $9, about 30% lower than April 1’s price.  APEUSD daily price chart featuring a ‘rising wedge’ setup. Source: TradingViewMeanwhile, a clear divergence between rising prices and falling volumes across the last two weeks also indicated a weakening upside momentum, raising the chances of a drop towards the wedge target, as discussed above.Inflationary risksThe bearish setup emerges as markets continue to look for clues about APE’s utility in the nonfungible token (NFT) and metaverse sector. To recap, Yuga Labs, the firm behind the popular Bored Ape Yacht Club (BAYC) NFT collection, minted 1 billion ApeCoin as the governance tokens of their new decentralized autonomous organization (DAO). Then they airdropped 10,000 APE to each BAYC NFT owner, amounting to 15% of the total supply.Meanwhile, APE gained listing across some of the leading crypto exchanges, including FTX and Binance, on the same day, providing avenues for BAYC owners to liquidate their APE rewards instantly. As it happened, APE rose from nearly $1 to nearly $41 on its March 17 debut, but has since seen a strong correction.Josh Ver, co-CEO of SparkWorld, a prediction platform for NFTs, noted that APE’s current valuation — still around 1,200% higher than its debut price on Binance — is a result of the “hype, excitement and exuberance” around Yuga Labs’ success as a “blue-chip” startup.”Yuga Labs, the studio behind the collection, are a commercially viable business; last year, they saw over $127 million in revenue,” he explained, adding that “if ApeCoin holders received a share of these profits, then APE would hold considerable fundamental value.”But Ben Lilly, a token economist at Jarvis Labs, raised concerns about ApeCoin’s inflationary model, which could weigh its valuation down in the future. He said that 9.4 million APE would likely enter the market each month over the next year as Yuga Labs, the four BAYC Founders, and will be able to unlock their allocated tokens.APE supply chart. Source: ChainPulse, Jarvis Labs”This implies a need for about $132 million of monthly demand or $4.4 million per day that needs to enter the market to soak up new supply,” Lilly wrote, adding:”With these supply unlocks and substantial inflation in the first year, it begs the question to the market… How will Yuga Labs, BAYC, the DAO and venture firms (a16z and Animoca) generate the needed demand? Is it even possible?Protecting APE’s value is possibleBut like Ver, Lilly suggests that Yuga Labs’ brand value could protect ApeCoin from the said inflationary risks, noting that the $4-billion startup could source better technology, artists, and resources that translates to higher potential asset values later if used wisely.Related: NFT creator Yuga Labs raises $450M, bringing company valuation to $4BFor instance, Yuga Labs has already released the teaser video of its upcoming metaverse called “Otherside” that enables the crossover of the NFT world’s most popular collections, including CryptoPunks, with the BAYC.See you on the Otherside in April. Powered by @apecoin pic.twitter.com/1cnSk1CjXS— Yuga Labs (@yugalabs) March 19, 2022″In that same line of thinking it should not be a surprise either if a more accessible NFT hits the market for use in the Otherside NFT metaverse,” wrote Lilly, adding that it may bring more users to “access the virtual world,” thus growing APE’s marketshare in tandem.The views and opinions expressed here are solely those of the author and do not necessarily reflect the views of Cointelegraph.com. Every investment and trading move involves risk, you should conduct your own research when making a decision.

Čítaj viac

Zilliqa's 'metaverse' debut pumps ZIL price 350% in just five days — Selloff ahead?

Zilliqa (ZIL) continues its supersonic bull run this week after reports that it will officially launch a so-called metaverse-as-a-service (MaaS) platform in April.ZIL rallied nearly 25% in one day to $0.22 a token by March 30, its best level since May 13, 2021. Its strong move came as a part of a rebound rally that started March 26 when it was trading for as low as $0.047. As a result, its net gains in the past six days came out to be more than 350%.ZIL/USD daily price chart. Source: TradingViewMetaverse FOMOTraders started flocking to the Zilliqa market the day after it announced the launch of Metapolis, a MaaS platform built on Nvidia Omniverse, during a VIP event coming April 2 in Miami. The metaverse concept and the companies trying to build it attracted nearly $3 billion in funding in 2021 compared to $2.33 billion in the year before that, according to data intelligence firm Dealroom. Investments into Metaverse startups in the recent years. Source: DealroomNotably, metaverse developers have been building everything from virtual events to host fashion shows to all-and-all marketplaces that sell physical goods in the real world as well as digital marketplaces accompanied by nonfungible tokens (NFTs). In November 2021, Facebook’s parent company also changed its name to Meta Platforms Inc. to show its new focus on applications in a virtual universe.Zilliqa shared its plans to tap the booming sector via Metapolis, revealing that it had already “amassed $2 million in pre-launch revenues from its client pipeline,” including Agora, a digital art platform that would host a virtual award event on the Zilliqa metaverse.ZIL, which serves as a utility token inside the Zilliqa ecosystem to execute smart contracts and cover transaction fees, appears to be benefiting from the metaverse hype. Nonetheless, from a technical perspective, the coin has rallied too much, too quickly to sustain its profits near the local highs.ZIL selloff ahead?Zilliqa has become an “overbought” asset on both its daily and weekly period charts, according to its relative strength index (RSI) readings above the threshold of 70, as of March 31.ZIL/USD weekly price chart. Source: TradingViewZIL experienced a selloff upon nearing its interim resistance level of $0.235, also the 1.0 Fib line of the Fibonacci retracement graph — drawn from $0.235-swing high to the $0.037-swing low. As such, the ZIL/USD pair dropped by over 12% to test the 0.786 Fib line near $0.193 as interim support and eyed further downside momentum with its RSI still above 70.Holy Crypto…. $ZIL90 RSI and at resistance, if you own this, probably not a bad time to take profit pic.twitter.com/slyUrEsG1C— Don’t Follow ShardETH B If You Hate Money $ (@ShardiB2) March 30, 2022Meanwhile, ZIL appears to have been trading inside a giant symmetrical triangle since August 2020, confirmed by at least two reactive highs on its upper falling trendline and two reactive lows on its lower rising trendline.ZIL/USD weekly price chart featuring symmetrical triangle. Source: TradingViewOn March 31, the Zilliqa token retested the triangle’s upper trendline (around $0.19) for a potential pullback move toward the lower trendline (below $0.08). That amounts to at least a 55% price drop in the coming weekly sessions if the pattern pans out as expected. Related: Investment tracker Delta expands its Web3 offering with an NFT explorerConversely, a decisive break above the resistance confluence, including the triangle’s upper trendline and two Fibonacci levels, could have ZIL eye $0.35 next, coinciding with the 1.618 Fib line.The views and opinions expressed here are solely those of the author and do not necessarily reflect the views of Cointelegraph.com. Every investment and trading move involves risk, you should conduct your own research when making a decision.

Čítaj viac

Získaj BONUS 8 € v Bitcoinoch

nakup bitcoin z karty

Registrácia Binance

Burza Binance

Aktuálne kurzy