Autor Cointelegraph By Yashu Gola

Near Protocol eyes a Terra-like price rally after new $350M funding raise

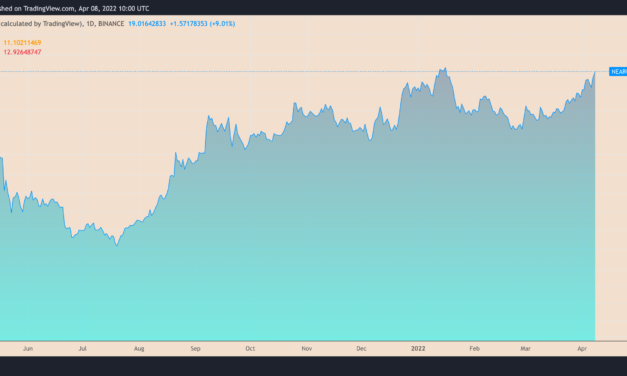
Near Protocol (NEAR) has rallied by almost 30% after announcing on April 6 that it had raised $350 million in a funding round led by Tiger Global, a New York-based hedge fund. NEAR price eyes 100% price rallyNEAR’s price reached over $19.75, just about 2.5% below its all-time high. However, many analysts agreed with the potential for the NEAR/USD pair to reclaim its best level to date, and even rise above it in the coming weeks.NEAR/USD daily price chart. Source: TradingViewAdoption remained the key focus behind the bullish predictions. For instance, Zoran Cole, the founder of the popular Telegram group Crypto Insiders highlighted that Near Protocol will announce the launch of its own native algorithmic stablecoin called USN as early as April 20.The stablecoin will reportedly use a Terra-like native token burn mechanism to maintain the U.S. dollar peg, effectively reducing NEAR supply. Additionally, as Cole asserted in his investment thesis, Near will offer stakers an annual percentage yield of around 20%, thus incentivizing DeFi capital rotation toward its pools and boosting NEAR’s demand simultaneously.2/ $USN by @NEARProtocol : https://t.co/kHNqXVuTSJ— Do Kwon (@stablekwon) April 8, 2022″This will lead to a comparison of Near to Terra as the narrative for attractive stablecoin yields proliferates,” he noted, adding:”Terra currently has a market capitalization of approximately $40 billion while Near sits at $10 billion. The catalysts above will strengthen Near’s fundamentals in both the short and long term and likely cause its market capitalization to appreciate by 100% at minimum over the next few months.”Slim Trady, a pseudonymous market analyst, also expects NEAR to reach new all-time highs, noting that there is “no substantial resistance left” on the coin’s chart that could cap its upside moves.Don’t act like nobody told ya about $NEAR.Patience. That’s all you’ve ever needed in this market.New ATHs are very #NEAR…teehee.✍️✅ https://t.co/M2QdtXvdE7— Slim Trady – non giver of ICP (@TradySlim) April 7, 2022

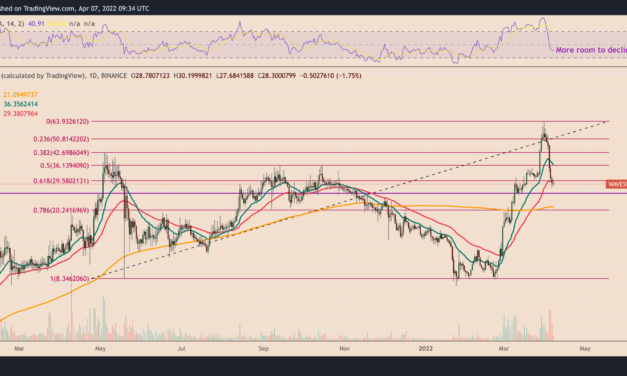
NEAR Coinbase listing near? Despite being in the top-20 crypto assets by market capitalization, NEAR remains listed only on a few crypto exchanges, including Binance, Huobi, KuCoin, and Upbit, limiting its exposure, especially in voluminous markets like the U.S.Related: Terra buys $200M in AVAX for reserves as rival stablecoins emergeBut Kole noted that Coinbase, one of the leading U.S.-based crypto exchanges, will list NEAR on its platform “in the next couple of months,” noting that it would help boost the coin’s retail visibility.”This also paves the way for Near NFTs to be integrated into Coinbase’s upcoming NFT marketplace.FTX, a crypto exchange headed by Sam Bankman-Fried, could also list NEAR pairs given its investment arm FTX Ventures being one of the backers in Near Protocol’s latest $350 million funding rebound.Price levels to watchFrom technical perspective, NEAR now eyes a run-up toward its current record high above $20.50.NEAR/USD daily price chart. Source: TradingViewA decisive break above the level, which coincides with the 1.0 FIb line of the Fibonacci retracement graph, drawn from $20.78-swing high to nearly $6-swing low, could have NEAR eye $29.70 as its next upside target.Conversely, a pullback risks putting NEAR’s price en route below its interim support near $17.55, with the next downside target at around $15.The views and opinions expressed here are solely those of the author and do not necessarily reflect the views of Cointelegraph.com. Every investment and trading move involves risk, you should conduct your own research when making a decision.

Čítaj viac

Stronger dollar prospects risk pushing down Bitcoin price to $32K

The U.S. dollar’s ability to continue its rally in Q2 could prove fatal for Bitcoin (BTC), which has demonstrated an inverse correlation with the dollar since January 2022.BTC/USD daily price chart featuring correlation with DXY. Source: TradingViewDollar paints “bull flag”The U.S. dollar index (DXY), which measures the greenback’s strength against a basket of foreign currencies, reached its 21-month trading high of 99.82 on April 7, the highest level since May 2020. The index now looks poised to continue its upside move further as it breaks out of a classic bullish continuation pattern — called a “bull flag.”In detail, bull flags appear when the price consolidates lower inside a parallel descending channel after undergoing a strong uptrend (called flagpole). In theory, the pattern is resolved after the price breaks out of their range to the upside to reach the level located at a length equal to the flagpole when measured from the breakout point.DXY daily price chart featuring “bull flag'”setup. Source: TradingViewThe bull flag setup therefore puts the next upside target for DXY at 101. Golden cross on the weekly chartThe DXY index is also forming a bullish golden cross for the first time since April 2019.Golden crosses occur when an asset’s short-term moving average rises above its long-term moving average. Many analysts consider the crossover as a bullish technical signal due to its history of preceding strong uptrends.DXY’s last golden cross between its 50-week and 200-week exponential moving averages (EMAs) came before a 4% upside move. A similar bullish setup now nears for a 50-200 EMA crossover in April, notes Alexander Mamasidikov, co-founder of crypto wallet service MinePlex.DXY weekly price chart featuring a golden cross. Source: TradingView”The formation of the golden cross on the U.S. dollar index marks a period of temporary strength for the greenback with an expectation for it to tick stronger growth potentials against other currencies,” he explained, adding: “The ensuing strength of the U.S. dollar following the golden cross formation will help to stump the impact of inflation as the greenback’s purchasing power is boosted.”Where does it leave Bitcoin?Interestingly, Bitcoin has been forming the opposite setup to the dollar, dubbed a bear flag — suggesting more pain ahead for the BTC/USD pair.Related: Bitcoin bulls may have to wait until 2024 for next BTC price ‘rocket stage’Bear flags appear when the price consolidates higher inside a parallel ascending channel and resolve after it breaks below the channel’s lower trendline with convincing volumes. In a “perfect” scenario, a bear flag breakout results in the price falling as low as the height of the previous downtrend. BTC/USD daily price chart featuring ‘bear flag.’ Source: TradingViewThus, Bitcoin could see a drop to the flag’s lower trendline around $40,000, opening the door for a drop toward $32,000.There it is, now we’ll check off the 2nd target box on $DXY drawn months ago.- Daily, Weekly, & Monthly RSI look bullish- Daily, Weekly, & Monthly MACD look bullish- Above 200 W MA since November- May 2020 last time it was this highRisk off for #bitcoin, #crypto, $stocks? https://t.co/jzaCOb4fIk pic.twitter.com/hMEBrxHgW2— Jesse Olson (@JesseOlson) April 7, 2022Nonetheless, Mamasidikov says Bitcoin could hold above $42,500 even if the dollar rises on the other end of the spectrum. Recalling the adoption boom of summer 2021 (when Bitcoin’s correlation with the DXY was largely positive), investors continue to hodl BTC as a part of their long-term strategy.He adds:”Despite the seeming uncertainty in the market, Bitcoin has formed strong support at $42,500 and has the fundamental backing to retest $47,000 in the short term.”The views and opinions expressed here are solely those of the author and do not necessarily reflect the views of Cointelegraph.com. Every investment and trading move involves risk, you should conduct your own research when making a decision.

Čítaj viac

WAVES price crashes 50% in one week — watch these support levels next

Waves (WAVES) lost around half its value in April so far and risks further correction due to weakening technical and fundamental factors.WAVES price risks another 30% decline WAVES dropped from nearly $64 on March 31 to around $27.50 on April 7 — down by over 55%. As it fell, the WAVES/USD pair also broke below a key support confluence, hinting further correction.Notably, the confluence comprises WAVES’ 50-day exponential moving average (50-day EMA; the red wave) and the 61.8% Fib line of the Fibonacci retracement graph — drawn from $64-swing high to $8.34-swing low.Now broken, they suggest that WAVES’ path of least resistance is to the downside, with $25 acting as interim support due to its historical relevance as a price floor in October 2021 and March 2022.WAVES/USD daily price chart. Source: TradingViewAdditionally, WAVES’ daily relative strength index (RSI) also shows room for a further decline, being only 11 points away from slipping below the “oversold” threshold of 30.Meanwhile, breaking below $25 would risk crashing WAVES’ price to its 200-day simple moving average (200-day SMA; the orange wave) near $20, coinciding with the 0.786 Fib line, about 30% lower than today’s price.The bearish setup emerged amid allegations that equaled the Waves Platform with a “Ponzi,” namely a Twitter thread penned by 0xHamZ, who accused Waves’ team of artificially inflating the price by more than 650% from February to March.Meanwhile, Neutrino USD, a “stablecoin” backed by WAVES reserves, also lost its U.S. dollar peg following 0xHamZ’s accusations, further dampening market sentiment.Related: Bitcoin slides below $44K in April first as trader warns ‘something is off’ with BTCJolyon Horsfall, the co-CEO of NFT prediction platform SparkWorld, noted that the Waves Platform founder, Sasha Ivanov, “will need to step up if the token is to be revived and the project re-aligned on its ambitious path.” He warned:”For the time being, the dumping is expected to continue, and the WAVES price may fall to its 30-day low of $21.”Bull flag retest?However, WAVES shows some signs of defying bearish predictions while keeping its long-term uptrend intact.Notably, the ongoing correction brings WAVES closer to testing another double-layered support zone, defined by its 20-week EMA (the green wave) and the upper trendline of its previous “bull flag” setup, as shown in the chart below.WAVES/USD weekly price chart. Source: TradingViewA bounce from this weekly support confluence could see WAVES rally to test its “bull flag” target near $70.The views and opinions expressed here are solely those of the author and do not necessarily reflect the views of Cointelegraph.com. Every investment and trading move involves risk, you should conduct your own research when making a decision.

Čítaj viac

Litecoin price risks 20% drop as LTC whale activity spikes to monthly highs

The daily transactions involving the richest Litecoin (LTC) addresses — “whales” that hold 10,000 to 1 million LTC — have jumped to their highest levels since December 2021.Litecoin selloff ahead?On-chain analytics platform Santiment detected a total of 3,458 LTC transactions worth over $100,000 on April 5, calling it “an indicator of mid-term price direction shifts.” Meanwhile, Litecoin’s price continued its correction move on April 6, down 13% from recent highs of $135 on March 30.Litecoin daily whale transactions in 2022. Source: SantimentWhales are an influential cluster of investors since they hold a comparatively large amount of coins, whose movements can intentionally or unintentionally move markets in either direction.Santiment’s chart revealed little about whether Litecoin whales purchased, sold, or merely transferred their LTC holdings to other addresses. However, it showed that spikes in daily whale transactions have been preceding price declines in the Litecoin market this year, raising the possibility of LTC’s price falling in the coming weeks.LTC price technicalsOver the last ten days, Litecoin has experienced modest selloffs upon twice testing its 20-week exponential moving average (20-week EMA; the green wave) near $133.LTC/USD weekly price chart. Source: TradingViewLTC’s price declined by nearly 7.5% week-to-date to drop below $120. Its path of least resistance looks skewed toward the downside, with its 200-week simple moving average (200-week SMA; the orange wave) near $100 acting as the next pullback target — around 20% below current prices.Related: Crypto billionaires increase by 60% in a year: Who made Forbes annual list?The given level also coincides with the lower horizontal support that constitutes a descending triangle pattern, raising LTC’s chances of a rebound here toward the channel’s upper falling resistance above $200 in Q2.Litcoin hodlers holdingAdditionally, the monthly position change of Litecoin’s long-term investors — or “hodlers” — shows LTC accumulation (green) during its price declines in 2021, suggesting that investors are currently betting on the price to rise in the future. Litecoin holder net position change. Source: GlassnodeMeanwhile, Rekt Capital, an independent market analyst, expects an early rebound in LTC/USD, citing a “falling wedge” — a bullish reversal pattern that starts wide at the top but contracts as prices move lower.LTC/USD daily candle price chart”LTC now pulling back for a post-breakout retest of the Falling Wedge top,” he noted in reference to the chart above, adding:”This Falling Wedge diagonal is confluent with the green Range Low area ($116-$125). LTC will be looking to hammer out a base in this area.”The views and opinions expressed here are solely those of the author and do not necessarily reflect the views of Cointelegraph.com. Every investment and trading move involves risk, you should conduct your own research when making a decision.

Čítaj viac

3 reasons why Ethereum price can hit $4K in April

Three market catalysts suggest that Ethereum’s native token Ether (ETH) is well-positioned to reach $4,000 this month.Google searches for “Ethereum merge” spike Internet users’ interest in Ethereum’s upcoming network upgrade, dubbed “the Merge,” surged substantially in the week ending April 2, Google Trends’ data shows.Searches for the keyword “Ethereum Merge” reached a perfect Google Trends score of 100 on a 12-month timeframe with most traffic coming from the U.S., Singapore, Canada, and Australia.Internet trend score for the keyword ‘Ethereum Merge.’ Source: Google TrendsMerge, also called ETH 2.0, refers to the Ethereum network’s full transition to Proof-of-Stake (PoS) from Proof-of-Work (PoW), a development that had been touted as one of the major catalysts behind Ether’s rebound from $2,500 on March 14 to over $3,500 this week.The bullish outlook stems from Merge’s proposal to reduce Ether’s issuance rate, leading to a possible supply peak in the total number of ETH in circulation. With PoW mining, ETH’s supply has grown by 3% every year.Total value staked in ETH 2.0. Source: GlassnodeThe spike in public interest for “Ethereum Merge” suggests there is growing buzz among crypto investors and traders as the Ethereum upgrade nears. Last month’s launch of Kiln is the final public testnet before the whole network transitions to PoS sometime this year.$ETH I think we see a drive towards $4000 soon as long as price action remains above this support @ $3400.Likely a healthy retrace after a test of 4kThen into a aggressive move to new ATH’s for merge pic.twitter.com/ZDvReVPAWP— Cactus (@thecryptocactus) April 5, 2022Exchange ETH reserves at three-year lowsAt the same time, ETH supply downtrend on crypto exchanges continues. Notably, net Ether reserves across all the exchanges have dropped to their lowest levels since August 2018, suggesting that traders have been withdrawing ETH en masse to hold them long-term or to stake them across DeFi liquidity pools.Ethereum balance on exchanges. Source: GlassnodeWhat’s more, the number of addresses with a non-zero balance continues to rise, suggesting growing adoption and distribution of ETH.Ethereum number of addresses with a non-zero balance. Source: GlassnodeTechnicals hint at $4K ETH priceChances of ETH price reaching $4,000 in April are also boosted by a classic technical pattern.Dubbed “symmetrical triangle,” the pattern usually forms when the price consolidates sideways inside a range defined by a lowering upper trendline and a rising lower trendline, following a sharp move upside or downside. In an ideal scenario, the triangle resolves after the price breaks in the direction of its previous trend, and is thus considered a “continuation pattern.”Related: Crypto venture capital firms see surging assets under managementHowever, symmetrical triangle breakouts do not necessarily result in a continuation trend. For instance, in the book Technical Analysis of Stock Trends, technical analysts Robert Edwards and John Magee note that about 25% of all symmetrical triangle breakouts lead to reversals, i.e., the price does not break in the direction of its previous trend, thus defying anticipations.Ethereum’s current breakout appears to be a reversal as it bounces to the upside instead of continuing its previous trend to the downside, as shown in the chart below.ETH/USD daily price chart featuring symmetrical triangle setup. Source: TradingViewA symmetrical triangle’s potential breakout target is calculated after measuring the maximum length between the pattern’s upper and lower trendline and then adding the result to its breakout point. This puts the ETH/USD bullish target at nearly $4,000.The views and opinions expressed here are solely those of the author and do not necessarily reflect the views of Cointelegraph.com. Every investment and trading move involves risk, you should conduct your own research when making a decision.

Čítaj viac

Získaj BONUS 8 € v Bitcoinoch

nakup bitcoin z karty

Registrácia Binance

Burza Binance

Aktuálne kurzy