Autor Cointelegraph By Yashu Gola

Ethereum price 'bullish triangle' puts 4-year highs vs. Bitcoin within reach

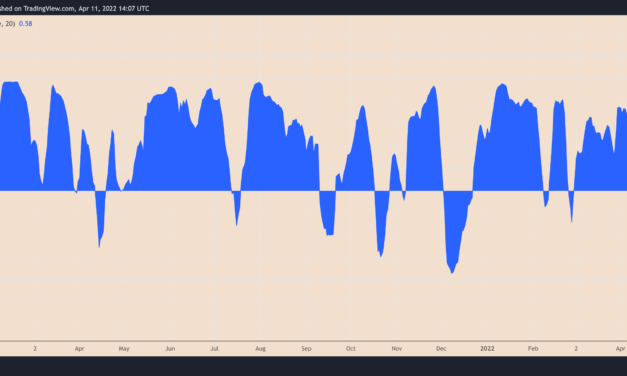
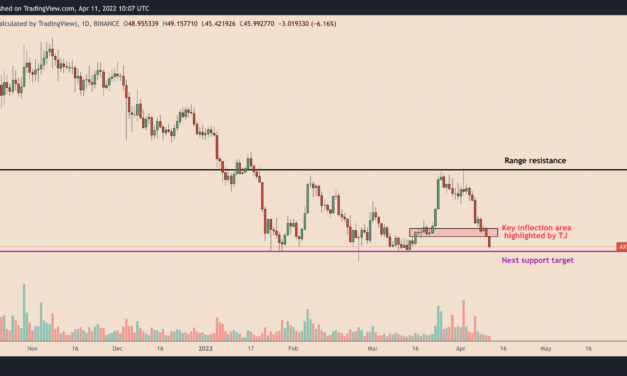
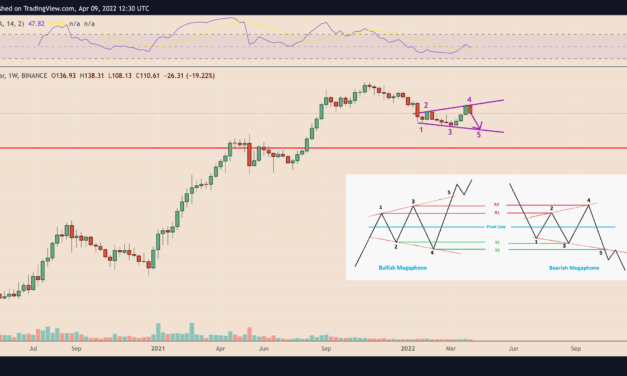
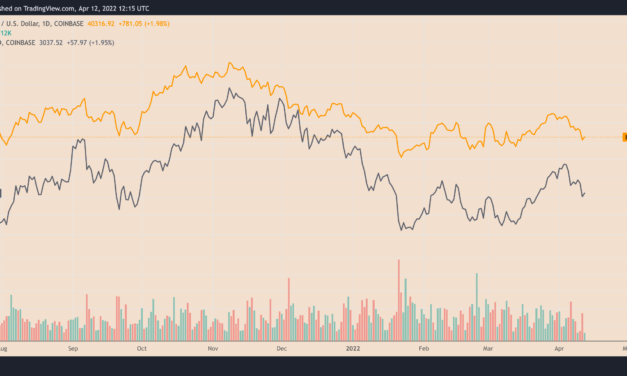
Ethereum’s native token Ether (ETH) has dropped about 17% against the U.S. dollar in the last two weeks. But its performance against Bitcoin (BTC) has been less painful with the ETH/BTC pair down 4.5% over the same period.The pair’s down-move appears as both ETH/USD and BTC/USD drop nearly in lockstep while reacting to the Federal Reserve’s potential to hike rates by 50 basis points and slash its balance sheet by $95 billion per month. The latest numbers released on April 12 show that consumer prices rose 8.5% in March, the most since 1981.BTC/USD vs. ETH/USD daily price chart. Source: TradingViewETH/BTC triangle breakoutSeveral technicals remain bullish despite ETH/BTC dropping in the last two weeks. Based on a classic continuation pattern, the pair still looks poised to resume its strong bull run in 2022.Notably, ETH/BTC has corrected from a horizontal resistance level that constitutes an ascending triangle range in conjunction with rising trendline support. As a rule, ascending triangles send the price in the direction of their previous trends. Therefore, since ETH/BTC was rallying before forming one, there’s a decent chance its bull run could continue toward its Feb. 2018 highs near 0.1 BTC, based on the setup shown in the chart below.ETH/BTC weekly price chart featuring ascending triangle setup. Source: TradingViewNonetheless, the interim market setup looks skewed to the downside, with ETH/BTC eyeing a correction towards the triangle’s lower trendline following its pullback from the upper trendline. The bearish reversal scenarioAscending triangle breakouts reach their upside targets nearly 73% of all time, a study by Samurai Trading Academy shows. In a separate report, veteran investor Tom Bulkowski also highlights a 70% success rate for ascending triangles, thus underscoring the strong possibility for Ether to reach 0.10 BTC in 2022.Related: Bitcoin claws back $40K as 24-hour crypto liquidations near $500MNonetheless, this still leaves ETH/BTC with a 30% chance to invalidate its ascending triangle setup.ETH/BTC weekly price chart. Source: TradingViewAs it happens, the pair will break below its triangle’s lower trendline, which also coincides with its 50-week exponential moving average (the red wave in the chart above) near 0.06 BTC, opening the door for a further drop to 0.05 BTC, a support area from May-June 2021.The views and opinions expressed here are solely those of the author and do not necessarily reflect the views of Cointelegraph.com. Every investment and trading move involves risk, you should conduct your own research when making a decision.

Čítaj viac

Terra price key support level breaks after 30% weekly drop — more pain for LUNA ahead?

Terra (LUNA) price slid on April 11 as a broader correction across crypto assets added to the uncertainties concerning its token burning mechanism.Bitcoin (BTC) and Ether (ETH) led to a decline in the rest of the cryptocurrency market, with LUNA’s price dropping by over 8% to nearly $91.50, and about 30% from its record high of $120, set on April 6. The overall drop tailed similar moves in the U.S. stock market last week after the Federal Reserve signaled its intentions to raise interest rates and shrink balance sheets sharply to curb rising inflation.Arthur Hayes, the co-founder of BitMEX exchange, said Monday that Bitcoin’s correlation with tech stocks could have it run for $30,000 next. In other words, LUNA’s high correlation with BTC so far this year puts it at risk of more downside if BTC doesn’t rebound. The correlation between LUNA and BTC has been largely positive in 2022. Source: TradingViewTale of two exposésLUNA picked additional downside cues from at least two “exposé” threads that went viral on Twitter over the weekend. The first thread, penned by a pseudonymous analyst @DeFi_Made_Here on April 7, questioned LUNA’s capability to maintain the peg of Terra’s native stablecoin, TerraUSD (UST) since it is not backed by any tangible asset. The second thread, published on April 9 by Jack Niewold, an analyst at the Crypto Pragmatist — a DeFi newsletter, accused Terra co-founder Do Kwon of receiving all the LUNA tokens meant to be “burned” to mint UST. He also alleged that the Luna Foundation Guard, a nonprofit organization that backs the Terra ecosystem, has been using a percentage of burned LUNA supply to buy Bitcoin.Kwon refuted the claims in a tweet-to-tweet response to Niewold, calling him a “made up clickbait.” The self-proclaimed “master of stablecoin” asserted that Terra burns LUNA 1:1 to mint new UST, which can be seen by testing a swap on the Anchor Protocol dashboard.Jose Maria Macedo, head of crypto research platform Delphi Digital, also rubbished Niewold’s thread as “absolutely terrible.”Key LUNA price support breaksThe latest LUNA selloff also led its price below its key moving average support against the U.S. dollar.Related: Bitcoin plumbs April lows as US dollar strength hits highest since May 2020In detail, the Terra token dropped below its 50-day exponential moving average (50-day EMA; the red wave in the chart below), now near $90, almost two months after reclaiming it as support. The latest support-to-resistance flip exposes LUNA to the possibility of extending its downtrend toward its 200-day EMA (the blue wave) around $67 (around 20% lower than April 11’s price) in April. LUNA/USD daily price chart featuring 50-day EMA support. Source: TradingViewThe 200-day EMA also coincides with the 0.382 Fib line of the Fibonacci retracement graph, drawn from the $4-swing low to the $106-swing high, thus offering LUNA double-layered support against bears.Conversely, an early rebound from 0.236 Fib line (near $82) could have LUNA retest $106 as its interim upside target.The views and opinions expressed here are solely those of the author and do not necessarily reflect the views of Cointelegraph.com. Every investment and trading move involves risk, you should conduct your own research when making a decision.

Čítaj viac

Axie Infinity sees 'no signs of buyers' as AXS price tumbles 30% in two weeks

Axie Infinity (AXS) price has fallen by nearly 30% two weeks after losing $625 million to a hacking incident involving its play-to-earn gaming platform’s underlying blockchain, the Ronin Network.AXS/USD dropped to $46.69 on Monday, its lowest level since March 16, signaling a dampening buying sentiment among traders and investors following the hacking incident. Independent market analyst TJ asserted that there is “no sign of buyers” even with the price entering areas with a history of attracting accumulators.AXS/USD daily price chart featuring demand areas. Source: TradingViewFor instance, AXS broke below the demand zone that TJ highlighted as a potential inflection point during the weekend, a move that risked sending the price further lower towards its range support target near $45 this week.AXS bounce back ahead?The bearish prospects appear despite a strong assurance from Sky Mavis — the company that built Axie Infinity — that they would reimburse all the users who lost funds in the $625 million theft. Last week, the firm announced a $150 million raise, led by Binance, to honor its promise.Additionally, AXS hints at more downside after painting a death cross between its 20-day exponential moving average (20-day EMA; the green wave) and its 50-day EMA (the red wave).AXS/USD daily price chart featuring ‘golden cross.’ Source: TradingViewThe area around the $45-level has earlier served as an accumulation zone for traders. For instance, its last retest as support in March had preceded a nearly 70% rebound move to around $75. Similar retracement moves occurred in January and February when the price fell to around $45.Meanwhile, as AXS tests the key support level, it would also prompt its daily relative strength index (RSI) to move lower below 30 — an “oversold” signal. This suggests Axie Infinity could be due for a bounce higher in April.Falling wedge confirmation neededAXS’s price is already “oversold” on its four-hour chart, according to its RSI readings near 25. Meanwhile, AXS is breaking out of its prevailing falling wedge pattern to the downside despite it being a bullish reversal pattern in theory.AXS/USD four-hour price chart featuring ‘falling wedge’ setup. Source: TradingViewThe support confluence — featuring an oversold RSI and the accumulation zone near $45 — raises the AXS’s potential to re-enter the wedge range, followed by a breakout to the upside. If this happens, AXS/USD could move toward $58, a key March 2022 resistance level, based on the falling wedge’s theoretical profit target, measured after adding the distance between its upper and lower trendlines to the breakout point.Head-and-shoulders riskConversely, breaking below the key support area near $45 could trigger AXS’s head-and-shoulders (H&S) setup on longer timeframe charts.Related: BTC stocks correlation ‘not what we want’ — 5 things to know in Bitcoin this weekThat is primarily because the $45-level serves as the pattern’s neckline. As a rule, a break below the H&S neckline support shifts the asset’s downside target to the level at a length equal to the maximum distance between the head and the neckline, as illustrated in the chart below.AXS/USD weekly price chart featuring H&S breakout. Source: TradingViewAs a result, the H&S setup risks sending AXS’s price toward $12 on a decisive breakout below its neckline. The views and opinions expressed here are solely those of the author and do not necessarily reflect the views of Cointelegraph.com. Every investment and trading move involves risk, you should conduct your own research when making a decision.

Čítaj viac

Monero defies crypto market slump with 10% XMR price rally — what's next?

Privacy-focused cryptocurrency Monero (XMR) rallied by nearly 9.5% in the past week compared with the crypto market’s decline of 8.5% in the same period. What’s more, the XMR/USD pair has broken above a strong, multi-month resistance trendline, hinting at more upside ahead.XMR price action XMR’s price was down by a modest 0.87% on April 10 from its two-month-high of $245 established a day before. However, the cryptocurrency still outperformed its top rivals, including Bitcoin (BTC) and Ether (ETH), on a weekly timeframe.Speculations about entities using Monero to bypass sanctions could have boosted its appeal among investors. Meanwhile, The American research group Brookings warned last month that Monero, the first in the line of privacy coins, could be “used as part of a sanctions-evasion scheme.” “As a result of the difficulties in tracking and tracing the individuals involved in privacy coin transactions,” Brookings explained. “The IRS has offered payments of $625,000 to those that can crack the privacy protections of Monero, Zcash, and other such cryptocurrencies.”Monero’s market capitalization has risen by almost 85% to $4.30 billion since February. While technical indicators suggest that it could grow further in the second quarter.XMR market cap since February. Source: CoinMarketCapTechnical breakout in playThis week, XMR broke above a downward sloping trendline that had been capping its upside attempts since May 2021.Interestingly, the trendline constitutes what appears to be a bull flag pattern, in combination with a parallel lower trendline acting as support. A basic tenet of bull flags is that they send the price in the direction of its previous uptrend (called “flagpole”) after it decisively breaks to the upside.XMR/USD weekly price chart featuring ‘bull flag’ breakout. Source: TradingViewAs a rule, bull flag’s upside target is typically the sum of the breakout point and the flagpole’s height. That puts XMR en route to almost $480, up almost 110% from today’s price near $235.On longer timeframes, however, independent market analyst Don Yakka argues that XMR price could reach as high as $10,000 if a classic “cup-and-handle” pattern plays out.XMR/USD daily price chart featuring cup-and-handle pattern. Source: Don Yakka/TradingViewCup-and-handles are bullish continuation patterns with the “cup” representing a U-shaped price trend, including a period of strong correction followed by an equally decisive recovery, and the “handle” resembling a consolidation indicator, such as a “flag” or a “pennant.”Related: Top coins to buy in a bear market? | Find out now on The Market Report liveA cup-and-handle pattern resolves after the price breaks above its resistance level. The breakout target is measured after calculating the pattern’s maximum height and adding it to the breakout point. Nevertheless, privacy coins like Monero continue to face downside risks due to increasing regulatory pressure from multiple governments around the world.The views and opinions expressed here are solely those of the author and do not necessarily reflect the views of Cointelegraph.com. Every investment and trading move involves risk, you should conduct your own research when making a decision.

Čítaj viac

Solana risks 35% price crash with SOL price chart 'megaphone' pattern

Solana (SOL) risks crashing 35% in the coming days as it comes closer to painting a so-called “megaphone” pattern.SOL price “megaphone” patternIn detail, megaphone setups consist of a minimum of lower lows and two higher highs and form during a period of high market volatility. But generally, these patterns consist of five consecutive swings, with the final one typically acting as a breakout signal.SOL has been sketching a similar pattern since the beginning of 2022, with the coin undergoing a pullback after testing the megaphone’s upper trendline near $140 as resistance — the fourth wing.As a result of the pattern, the Solana token could extend its decline to test the megaphone’s lower trendline as support near $65, about 35% below today’s price. Could SOL crash further?If this scenario plays out, SOL could crash further after forming the fifth swing on its prevailing megaphone structure. While finding a perfect downside target in case of a breakout is tricky, traders typically select it by measuring the distance between the two trendlines from the point the lower one breaks and book profits when the price reaches 50-60% of that distance.SOL/USD weekly price chart featuring ‘megaphone’ breakout scenario. Source: TradingViewA bearish breakout risks putting SOL’s price en route to nearly $40 in the coming weeks.A pullback scenarioOn the other hand, SOL’s bearish megaphone setup could fall short of achieving its breakout target as its price holds above a flurry of concrete support levels.These levels include SOL’s 50-week exponential moving average (50-week EMA; the red wave) and an upward sloping trendline (the black line) that have served as accumulation zones for traders, as shown in the chart below. As a result, an early pullback from 50-week EMA could invalidate the megaphone scenario.SOL/USD weekly price chart featuring 50-week EMA and rising trendline support. Source: TradingViewSuppose the price falls below the 50-week EMA, only to seek a bounce from rising trendline support. In that case, it could confirm the presence of a “rising wedge” or “bear flag” setup in conjugation with the megaphone pattern’s upper trendline — again a bearish setup.SOL/USD weekly price chart featuring bear flag/rising wedge scenario. Source: TradingViewThe rising wedge’s downside target appears to be near $60 after measuring the maximum distance between its upper and lower trendline (about $40) and subtracting it from the potential breakout point near $100.Related: Profit taking and Bitcoin consolidation give bears an opportunity to take controlMeanwhile, the bear flag’s downside target is near $30 after calculating the height of its previous uptrend (about $60) and subtracting it from the potential breakout point near $90.The views and opinions expressed here are solely those of the author and do not necessarily reflect the views of Cointelegraph.com. Every investment and trading move involves risk, you should conduct your own research when making a decision.

Čítaj viac

Získaj BONUS 8 € v Bitcoinoch

nakup bitcoin z karty

Registrácia Binance

Burza Binance

Aktuálne kurzy